Transcription
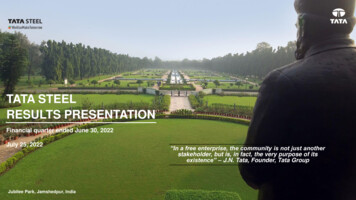
TATA STEELRESULTS PRESENTATIONFinancial quarter ended June 30, 2022July 25, 2022Jubilee Park, Jamshedpur, India“In a free enterprise, the community is not just anotherstakeholder, but is, in fact, the very purpose of itsexistence” – J.N. Tata, Founder, Tata Group
Safe harbour statementStatements in this presentation describing the Company’s performance may be “forward lookingstatements” within the meaning of applicable securities laws and regulations. Actual results may differmaterially from those directly or indirectly expressed, inferred or implied. Important factors that couldmake a difference to the Company’s operations include, among others, economic conditions affectingdemand/supply and price conditions in the domestic and overseas markets in which the Companyoperates, changes in or due to the environment, Government regulations, laws, statutes, judicialpronouncements and/or other incidental factors2
Overview1Performance update21QFY23 Results3
Tata Steel is focused on creating sustainable valueLeadership inSustainabilityLeadership inIndiaLeadership positionin technologyand digitalConsolidateposition as globalcost leaderRobust financialhealthBecome culturallyfuture ready4
Committed towards excellence in Safety & Health of our employeesSafety remains a top priority2.10LTIFR1 reduction by69% in the last 15 .650.600.560.580.440.39 0.460.47Worker Health & SafetyHealth is a key focus areaHealth check upsAwarenessCampaignsFirst Aidrefreshers To improve perception aboutsafety among employees andvendor partners, campaigns like‘Slip Trip Fall’ and ‘Working atheights’ were undertaken Campaign on ‘Beat the Heat’and awareness session onWorld Hypertension day wereorganised for employeesincluding contract workforce Further, Safety excellence rewardand recognition has beenintroduced to recognize andsustain a culture of safety Industrial Hygiene assessmentwas conducted at Jamshedpur.98% of employees have beenfully vaccinated21. Lost Time Injury Frequency Rate per million-man hours worked, for Tata Steel Group; 2. Cumulative till 30 th June 20225
Improving quality of life of our communities5.5 lakh lives1 reached outKey areas for CSR initiativesRural & UrbanEducationDignity for theDisabledHousehold Health &NutritionHouseholdLivelihoodsTribal CulturalHeritageWaterResourcesGrassroots RuralGovernanceGrassrootsSportsWomen & YouthEmpowermentPublicInfrastructure Spent more than Rs.1,200 crores2 since FY19 on Signatureprogrammes at regional scale as well as programmes forCommunities proximate to our operationsEducationDrinking water1. Cumulative till 30th Jun 2022 2. CSR Spending by Tata Steel StandaloneLivelihoodTribal heritage6
Focused on growth in India with future investments set to drive sector leading returnsCrude steel production (MTPA)Upstream› Pellet capacity to increase from 7 to 13 MTPA (TSK Ph II)› Iron ore mining to double from 30 to 60-65 MTPA40Flats› 2.2 MTPA CRM complex close to commissioning (TSK Ph II)› 5 MTPA expansion on track (TSK Ph II)Longs› NINL acquisition to facilitate rapid growth› EAF to drive scale through multilocational expansion› Tubes – From 1.0 MTPA to 2 MTPADownstream2018TSMTSLP2021FlatsLongs2030› Wires – From 0.45 MTPA to 1 MTPA› Tinplate – From 0.38 MTPA to 1.0 MTPA› Ductile Iron Pipes – From 0.2 MTPA to 1 MTPANote : TSM – Tata Steel Meramandali, TSLP – Tata Steel Long Products, TSK – Tata Steel Kalinganagar, CRM – Cold Rolling Mill, MTPA – million tons per annum, NINL- Neelachal Ispat Nigam Ltd7
Upstream Assets : Responsible and Smart mining driving cost leadership100 tonne dumper at Noamundi mines, India One of the largest miners in India, with annual despatch1 of 39mn tons of Iron ore, Coal, Manganese & Chrome ore Focus on Sustainability : Solar power, rainwater harvesting andElectric Vehicles at minesFirst miner in India to deploy women in all shiftsand onboarded transgendersNote : Annual despatch of 39 mn tons, of which 32 mn tons is Iron oreDrones for surveyIntegrated control centers forremote miningMachine Learning basedpreventive maintenanceReal time Fleet ManagementSystem to optimise utilisation8
Optimised portfolio : 2.2 MTPA CRM & 5 MTPA expansion to drive product mix enrichment in flatsTSK 5 MTPA expansion commissioning by end FY241QFY23FY24FY23PelletplantCRM :PLTCMCRM :CAL / CGL5 MTPAMarket share in Hi-end Auto / Engg. to grow Increase in high end Products for Automotive andEngineering Focussed on meeting customer requirements relatedto lightweighting and safety standardsBranded Products &RetailPellet Plant to drive cost savingsNote : TSK – Kalinganagar, CRM – Cold Rolling Mill, PLTCM – Pickling Line & Tandem Cold mill, CAL / CGL – Continuous Annealing / Galvanising lines9
Optimised portfolio : Ramp up in long products to drive high margin retail business NINL1 acquistion completed on 4th July 2022 Capacity growth to 10 million tons Leverage strong portfolio of retail brands andextensive distribution network to drive scale andprofitability Will benefit from significant pan India growth ininfrastructure and retail housing growth in semiurban IndiaBuild unshakeable structureswith Tata TisconSteelmaking capacityof 1 million tonLand Bank of2,500 acresCaptive Iron ore mine 100 mt reservesProximity to TSK2to drive synergiesNote : NINL – Neelachal Ispat Nigam Limited, TSK – Tata Steel Kalinganagar10
Expanding Downstream capacities and widening reach digitallyTubesWiresAashiyana2Tata Structura used at Sir VisvesvarayaRailway Terminal, KarnatakaTata Steel LRPC1 strands used at JioWorld Centre, Maharashtra‘Aashiyana’ registered 77% YoY growthin gross revenue in first quarterNote : 1. LRPC is Low Relaxation Pre-Stressed Concrete, 2. Aashiyana is Tata Steel’s online marketing platform, targeted towards ‘Individual home builder’ segment11
Pursuing sustainability through multiple pathways : Net zero by 2045Key focus areasClimate ChangeLong termdecarbonizationroadmap createdPursuing lowcarbontechnologiesCircular Economyintegrated, part ofbusiness modelResponsible supplychain & improvingdisclosuresIndiaEuropeSolar park at Noamundi Iron ore mineSteel with allocated reduction upto 100%to aid customers achieve net zeroWaterCircular EconomyBio-Diversity12
Pioneering initiatives that enable diversity & inclusion and empower people Strong leadership pipeline 90% home grownleadership talent. Providing leadership talent fororganic & inorganic growth across Tata group 100 year old learning & development set up focusedon creating future ready leaders Step Up program - 1st of its kind AI driven talentmarketplace First company to bring in equal benefits for same SexPartners and medical coverage for LGBTQIA colleagues First company in manufacturing & mining sector torecruit over 100 transgender employees and to opencore operations for womanAI – Artificial Intelligence, LGBTQIA - acronym for Lesbian, Gay, Bisexual, Transgender, Queer, Intersex, Asexual13
Overview1Performance update21QFY23 Results14
Moderation in Steel prices across key regions and input cost dynamics weigh on spot spreads Global steel prices have moderated in theApril – June period on slowdown in globalgrowth and regulationGlobal steel prices have moderatedHRC prices ( /t)2,5002,000 In China, COVID remains an overhang whileconsumer demand for goods has softened inthe western marketsCoking coal continues to be volatilePrices ( /t)US DomesticGermany domesticChina export FOBChina domesticPremium Low Vol HCC CFR China600Premium HCC, Australia FoBIron Ore-62% Fe, China CFR1,5004001,000200500 Coking coal prices have declined by around40% from 530/t levels in April to around 300/t by end June, but continue to remainvolatile0Jun-20Dec-20Jun-21Dec-21Jun-22Steel spot spreads are under pressure0Jun-20Dec-20Jun-21 Overall, this has led to pressure on steel spotspreads. Western spot spreads remain aboveChinese steel spreads750down on YTD basis, seasonally Apr – Juneare strong for export volumes33108500 China steel exports have risen but are still(mn tons)3712EU SpreadsChina export SpreadChina domestic SpreadsJun-22China Steel exports down on YTD basisHRC spot gross spreads ( /t)1,000Dec-21YTDYTDFY22 n-20 Oct-20 Feb-21 Jun-21 Oct-21 Feb-22 Jun-22Sources: World Steel Association, IMF, Bloomberg, Steelmint, and Tata Steel; China HRC exports spot spreads China HRC exports FOB – 1.65x Iron Ore (62% Fe China CFR) - 1x Coal (PremiumHCC China CFR); China HRC domestic spot spreads China HRC domestic prices – 1.65x Iron Ore (62% Fe China CFR) - 1x Coal (Premium HCC China CFR); EU HRC spot spreads HRC(Germany) - 1.6x iron ore (fines 65%, China spot, R’dam) - 0.8x premium hard coking coal (Australia spot, R’dam) - 0.1x scrap (HMS, R’dam)15
India recovering but supply imbalance; EU moderated on inflation and supply chain disruptionsEuropeIndia Apparent steel consumption declined by 4% QoQ.Exports volumes were down by 40% due to levy ofexport duty and moderation in overseas demand Automotive continues to recover while Infrastructure /Construction and Capital goods segments witnessedmoderation Supply chain disruptions primarily due to Russia – Ukrainecrisis and elevated inflation have led to moderation insteel demand Imports into EU / UK rose due to price differentials acrossmarkets. European commission is set to propose upgradeto steel safeguards, UK has extended tariffs for two yearsKey steel consuming sectors*Key steel consuming sectors (%, YoY growth)100%1500%MachineryCapital GoodsInfrastructure/ construction goodsConstructionAutomotiveVehicles 20Jan-21Apr-21Jul-21Oct-21Sources: Bloomberg, SIAM, Joint Plant Committee, MOSPI, CMIE, Eurostat and Tata Steel*Figures of Industrial Production for Capital Goods, Infrastructure/Construction, consumer durables and railways are rebased to Nov'18 100 using FY12 index based sector weights; number of unitsproduced as per SIAM; growth of key steel consuming sector is calculated by removing sub-segments which do not consume steelJan-22Apr-2216
India1: Resilient business model drives ramp up of domestic deliveriesSteel domestic deliveries (mn 2Highest market share, Catering to 87% of domestic marketService centers for lastpoint processing50 Product ApplicationEngineers250 distributors and14,600 dealersStrongmarketfranchiseCovering 95%districts across .521.790.340.330.381QFY221QFY234QFY220.681.516 Hubs and 14spokes100% fleet covered byvehicle tracking systemTOC2 enabledsupply chainIndia includes Tata Steel Standalone and Tata Steel Long Products on proforma basis without inter-company eliminations; 2. Theory of constraints. BPR – Branded Products and Retail, IPP –Industrial products & projects,17
India1: New products developed in 1QFY23 across customer segmentsLCV2 Wheel Rim(HR SPFH540,Mn / Si)Springs for automotiveapplicationFuel tank(Galvannealed withChrome free) for 2wheelersRim(Galvano)Washing MachinePanelTransformer Cover(HR Grade:S355MC 5-6mm,impact guaranteeat -48oC)Wire Rope (5.5 – 8 .0mm)Bulk Trailor (HR Grade HS900)Wire mesh forconstructionapplicationDust cover for Propeller or driveshaft of vehicle1. India means Tata Steel Standalone and Tata Steel Long Products on proforma basis; 2. LCV – Light Commercial Vehicle, Mn – Manganese, Si – Silicon, HR – Hot Rolled18
Tata Steel Europe : Transformation program and long term contracts yielding resultsTransformation programmeDiversified product nance& StructureValue Delivery& EnablementFunctional VsValue ChainEBITDA (in Y2319
Tata Steel Consolidated1: EBITDA margin improvement despite surge in coal costs1QFY234QFY221QFY22Production (mn tons)27.747.627.88Deliveries (mn tons)6.628.017.11Total revenue from operations63,43069,32453,465Raw material cost331,31924,87319,956Change in inventories(8,099)2,757(3,292)5,9636,0565,663Other Adjusted EBITDA414,34815,89115,892Adjusted EBITDA per ton 94512,13912,25939274182Tax expenses4,1922,0302,308Reported PAT7,7149,8359,768(6,611)519615(All figures are in Rs. Crores unless stated otherwise)Employee benefits expensesOther incomeFinance costPre exceptional PBTExceptional items (gain)/lossOther comprehensive incomeKey drivers for QoQ change: Deliveries: were down 17% driven by lower volumesin India and Europe operations Revenues: increased on per ton basis driven byhigher steel realisations in India and Europe Raw Material cost: increased primarily due to higherCoking Coal consumption cost across key entities Other expenses: decreased on lower power costs,consumption of stores and spares. 4QFY22 includedprovision related to Tata Steel Mining EBITDA: increased on per ton basis primarily drivenby margin expansion in Europe Tax expenses: increased primarily on account of risein deferred tax in Europe1. Figures for previous periods have been regrouped and reclassified to conform to classification of current period, where necessary. 2. Production Numbers: Standalone & Tata Steel Long Products Crude Steel Production, Europe - Liquid Steel Production; SEA - Saleable Steel Production. 3. Raw material cost includes raw material consumed, and purchases of finished and semi-finished products.4. Adjusted for fair value changes on account of FX rate movement on offshore liabilities20
Consolidated EBITDA1 stood at Rs 14,348 croresRs. Crores2,495 Selling Result: Primarily due to better steelrealisations across geographies1,3681,96315,89170714,348 Cost Changes: Primarily due to increase incoking coal prices resulting in rise inconsumption cost across entities Volume/Mix: Primarily due to lower steeldeliveries in India and Europe Others: reflects increase in royalty, lowerdividend and NRV provision at lume/MixOthersAdjustedEBITDA1QFY231. EBITDA adjusted for foreign currency revaluation gain/loss on offshore liabilities. TSLP – Tata Steel Long Products21
Volatility in commodity prices drives increase in working capital and debt7826,13611875,561Rs. Crores82,597-28,09354,504Gross DebtMar'22Addition ofnew leasesLoanmovementFX Impactand OthersNote : Cash balance includes Rs 10,890 crores paid out on 4 th July to acquire Neelachal Ispat Nigam LimitedGross DebtJun'22Cash, Bank &CurrentInvestmentsNet DebtJun'2222
Key metrices are at investment grade levelsEBITDA Margin (%)1EBITDA / ton (Rs.)122,71726.2%GoodInterest Coverage Ratio (x)1,223.7%21,626Good12.411.7GoodGross & Net Debt (Rs. ,77975,38969,21551,049 54,5046,2672.4FY 18FY 19FY 20FY 21FY22 1QFY23FY18Net Debt / EBITDA (x)FY19FY20FY21FY22 1QFY235.91FY21FY22 1QFY23FY18BBB-/ Baa370.80FY22 1QFY23FY21FY22 1QFY23Moody'sBB-/ Ba340.52FY21FY20S&PBB/ Ba253.200.87FY19Investment GradeBB / Ba161.421.432.44FY20FY20GrossCredit Rating0.983.19FY19FY19Good1.37FY18FY18NetNet Debt / Equity (x)1.72Good82,5970.483B / B12B/ B21B-/ B30Apr-17BBB-Ba1PositivePositiveMay 2022FY18Apr-18Apr-19FY19Jun 2022Apr-20FY20All data is on consolidated basis; 1. FY20 and FY21 includes Southeast Asia (SEA) Operations which is reclassified as continuing operations; 2. Interest Coverage Ratio: EBITDA / InterestApr-21FY21Apr-22FY2223
OutlookSteel demand China steel demand is likely tofind support as COVIDrestrictions ease and pave wayfor pent up demand India steel demand is expectedto improve in 2HFY23 with theend of monsoon, driven byincrease in government spendingand auto revival EU Steel demand affected bydestocking. Underlying demandacross key steel end use sectorsis more stableSteel pricesRaw material prices Heightened volatility to persist Coking coal prices to remainas concerns over inflation andgrowth collide with supply chain& cost push constraints Restocking to drive steel prices,low inventory across steel enduse sectorsrange bound & volatile, thermalcoal to provide support Seaborne iron ore prices to beimpacted by demand dynamicsesp. in China. Weather inAustralia and labour shortagesremain key watchpoints Indian steel prices should pickup post monsoon on revival inconstruction activities and earlyonset of festive demand European steel prices areexpected to be volatile on globalcues European power and energycosts to remain volatile due touncertainty about Russia gassupply to Europe. Netherlandsbetter placed in terms of gasstocks24
AnnexuresJubilee Park, Jamshedpur, India
Tata Steel Standalone: Continued focus on operational efficiencies and minimizingenvironmental impactMeramandaliSpecific Fresh Water Consumption 3.276.365.595.386.465.761QFY23Solid Waste utilisation 2.292.93FY20FY21Specific Dust Emission (kg/tcs)GoodFY19FY200.57CO2 Emission Intensity 99Good3.73Specific Energy Consumption (Gcal/tcs)Coke Rate (kg/thm)1QFY23FY19FY20FY21FY221QFY2326
FY224QFY211021QFY23145 Good4QFY22Electrode QFY20982QFY211353QFY201001QFY21PCI Y22554QFY21703QFY2184Good2QFY211001QFY21Power consumption4QFY20Good3QFY20923QFY20852QFY20Coke Y202QFY20Tata Steel Long Products: Key operating parameters(all figures are indexed; 1QFY20 100)Crude Steel Yield106101 GoodOil consumption at Mill11090Good6650301027
Tata Steel Standalone1: Operating performance(All figures are in Rs. Crores unless stated otherwise)1QFY234QFY221QFY22Production (mn tons)4.734.734.45Deliveries (mn tons)3.894.973.99Total revenue from operations32,02136,68127,690Raw material cost217,33612,6476,917Change in inventories(4,562)1,826(1,326)Employee benefits expenses1,5401,7231,546Other sted EBITDA38,30411,76613,04021,32623,69032,712Other income736506284Finance cost7226467738,23710,71511,4375576(153)Tax expenses2,0682,7992,810Reported PAT6,1147,8398,780434831Adjusted EBITDA per ton (Rs.)Pre exceptional PBT from continuing operationsExceptional items (gain)/lossOther comprehensive incomeKey drivers for QoQ change: Revenues: were up on per ton basis driven by betterrealisations but were down on absolute basis due tolower volumes Raw Material cost: increased primarily due to increasein coking coal prices Other expenses: were lower due to lower freight &handling charges and favourable FX movement EBITDA: margin stood at 30% and was broadly stableon per ton basis Finance cost: increased driven by marginal increase indebt Exceptional item: for the quarter primarily reflectscharge relating to Employee Separation Scheme andnet impairment on ICD / investments1. Tata Steel Standalone numbers have been restated from April 1, 2019 to reflect Tata Steel BSL’s merger into Tata Steel; Figures for previous periods have been regrouped and reclassified toconform to classification of current period, where necessary 2. Raw material cost includes raw material consumed, and purchases of finished and semi-finished products 3. Adjusted for fair valuechanges on account of FX rate movement on offshore liabilities28
Tata Steel Europe: Operating performance(All figures are in Rs. Crores unless statedotherwise)1QFY234QFY221QFY22Liquid Steel production (mn tons)2.442.312.67Deliveries (mn tons)2.142.402.33Total revenue from operations25,96126,38919,441Raw material cost111,1629,3649,785(2,563)902(1,458)Employee benefits expenses3,9293,8553,588Other 18,1356,590Change in inventoriesEBITDA per ton (Rs.)1.Raw material cost includes raw material consumed, and purchases of finished and semi-finished productsKey drivers for QoQ change: Revenues: increased on absolute basis (in ) and perton basis driven by relatively higher steel realisationsand sales mix Raw Material cost: increased primarily due to highercoal consumption cost due to higher prices. Iron orerelated costs were also higher Change in inventories: inventory value increased onhigher costs Other expenses: decreased primarily due to lowerenergy costs EBITDA: increased on significant margin expansionduring the quarter29
Tata Steel Long Products: Operating performance(All figures are in Rs. Crores unless stated otherwise)1QFY234QFY221QFY22Key drivers for QoQ change: Revenues: increased driven primarily by higher steelTotal revenue from operations1,9941,7991,688Raw material cost11,6651,132752Change in inventories(147)(13)(23)615453Other 86-9.8%32.9%(331)60332Employee benefits expensesEBITDA per ton (Rs.)2EBITDA Margin (%)Reported PAT1.2.realisations and product mix Raw material cost: was driven by higher coking coal& DRI coal prices and one-time NRV provision of Rs78 crores on Coking coal and Iron ore Change in inventories: inventory value increased onhigher costs net off one-time NRV provision of Rs 15crores Other expenses: increased due to rise in fuel andpower costs and higher freight and handling expensesRaw material cost includes raw material consumed, and purchases of finished and semi-finished productsEBITDA/Steel deliveries30
Tata Steel Thailand : Operating performance(All figures are in Rs. Crores unless statedotherwise)1QFY234QFY221QFY22Saleable Steel production (mn tons)0.310.340.35Deliveries (mn tons)0.310.340.35Total revenue from operations1.9661,9821,848Raw material cost11,5911,4201,338Change in inventories(189)(5)(130)539355Other loyee benefits expensesEBITDA per ton (Rs.)1.Key drivers for QoQ change: Volumes: production and sales were marginally lower.Export volumes were aided by rebar exports to Canada Revenues: were broadly similar as higher steel pricesoffset the drop in volumes EBITDA: increased due to higher prices and decrease inOther expenses. 4Q included provision for bonusRaw material cost includes raw material consumed, and purchases of finished and semi-finished products31
Investor relations contactInvestor enquiries :Hriday NairEmail: hnair@tatasteel.comPavan KumarEmail: pavan.kumar@tatasteel.com32
Today