Transcription
November 2018Occupational injuries and illnesses amongregistered nursesRegistered nurses often face workplace hazards whileperforming routine duties. They exhibit a higher-thanaverage risk of sustaining musculoskeletal disorders. Thetype and severity of their workplace injuries and illnessesdiffer by worker age and work environment.Registered nurses (RNs) play a crucial role in the U.S.healthcare system, primarily by providing care and healthservices to patients. They may also promote public healthby offering educational services, running health screenings,working with clinics, and performing a variety of additionalhealth-related tasks. Among healthcare occupations, RNshave the highest employment number,1 commonly workingin hospitals, physicians’ offices, home healthcare services,and nursing care facilities. Most nurses (61 percent) work intypes.2hospitals of variousPrevious research on hospitalshas demonstrated that hospital workers have a higher-thanaverage incidence rate of injury and illness.3 Historically,RNs have experienced some of the highest injury andillness rates in the healthcare and social assistance sector.4Many of the approximately 3 million RNs working across allindustries face workplace hazards in performing theirroutine duties.5 RNs spend time walking, bending,stretching, and standing (exposing themselves to possibleMichelle A. Dressnerdressner.michelle@bls.govMichelle Dressner is an economist in the Office ofCompensation and Working Conditions, U.S.Bureau of Labor Statistics.Samuel P. Kissingersampkissinger@gmail.comSamuel Kissinger is a former economist in theOffice of Compensation and Working Conditions,U.S. Bureau of Labor Statistics.fatigue, as well as slips, trips, and falls); often lift and movepatients (becoming vulnerable to back injuries); and comeinto contact with potentially harmful and hazardoussubstances, including drugs, diseases, radiation, accidental needlesticks, and chemicals used for cleaning (whichcan cause exposure-related injuries and illnesses).6 In 2016, workplace hazards for RNs resulted in 19,790nonfatal injuries and illnesses that required at least 1 day away from work, at an incidence rate of 104.2 cases per10,000 full-time workers (private industry).1
U.S. BUREAU OF LABOR STATISTICSMONTHLY LABOR REVIEWSince the workplace injuries and illnesses of RNs bear monetary and societal costs, understanding those injuriesand illnesses can help combat future hazards through improvements in policy and technology.7 RNs are thekeystone of the healthcare system, and injury and illness prevention strengthens the system at its core andimproves patient care.This article analyzes the workplace injuries and illnesses experienced by RNs in 2016.8 The analysis focuses onprivate industry nurses, because the majority of RNs work in private industry and because the types of injuries andillnesses experienced by private industry nurses differ from those of RNs in state and local governments.9Data and methodologyAll nonfatal occupational injury and illness data presented in this article come from the Survey of OccupationalInjuries and Illnesses (SOII) conducted by the U.S. Bureau of Labor Statistics (BLS). The SOII is a federal–statecooperative program administered by state agencies in cooperation with BLS. Employers report, on an annualbasis, injury and illness data for approximately 230,000 establishments in private industry and state and localgovernment.10 Definitions of recordable injury and illness cases for the SOII conform to guidelines set by theOccupational Safety and Health Administration (OSHA).11 The SOII also collects details of case circumstances andworker demographics for cases that result in at least 1 day away from work. This subset of data contains theoccupational injury and illness numbers and incidence rates that are the focus of this article. In addition, the SOIIcollects industry-level employment hours, which are used to calculate occupational injury and illness incidencerates by industry.The Occupational Injury and Illness Classification System (OIICS), developed by BLS, provides a standardizedcoding system for characterizing the case circumstances of nonfatal work-related injuries and illnesses from theSOII.12 The OIICS uses the following characteristics to describe an occupational injury or illness case: “nature” ofinjury or illness (e.g., a sprain or a heat burn); “part of body affected” (e.g., ankle); “source and secondary source,”or the equipment, substance, person, or bodily motion that contributed to the injury or illness (e.g., a box that felloff a shelf and struck the worker); and “event or exposure,” or the manner in which the injury or illness was inflicted(e.g., the worker slipped and fell on a wet floor).The 2010 Standard Occupational Classification (SOC) system is used by federal statistical agencies to classifyworkers into occupational categories for the purpose of collecting, calculating, or disseminating data. All workersare classified into one of 840 detailed occupations according to their occupational definition. To facilitateclassification, the SOC combines detailed occupations into 461 broad occupations, 97 minor groups, and 23 majorgroups. The grouping is based on similarity in job duties and, in some cases, skills, education, and training.13Registered nurses are classified under SOC code 29-1141 for all BLS programs using the 2010 SOC.Nonfatal injury and illness profile of registered nursesIn 2016, RNs in the private industry experienced an estimated 19,790 days-away-from-work injury and illnesscases. These cases occurred at an incidence rate of 104.2 cases per 10,000 full-time workers—significantlygreater than the rate for all occupations (91.7 cases per 10,000 workers).2
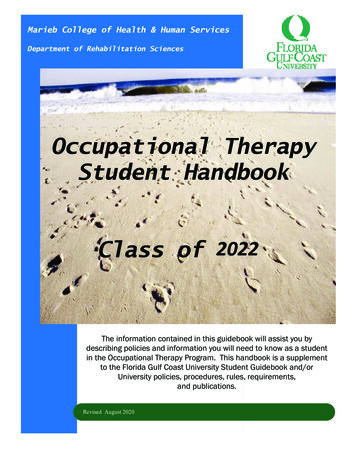
U.S. BUREAU OF LABOR STATISTICSMONTHLY LABOR REVIEWWhile 61 percent of all RNs work in hospitals, 74.1 percent of all nonfatal workplace injuries and illnesses to RNsin 2016 occurred in hospitals. This difference reflects that there are more RN injuries in hospitals than in all otherindustries.14 (See figure 1.)Female RNs sustained 91.2 percent of the 19,790 total injury and illness cases estimated to have occurred withinthe occupation in 2016. This corresponds closely with the distribution of employment by gender for this occupation.In 2016, about 90.0 percent of all RNs in the United States were women.15Nurses ages 45 to 54 accounted for 27.0 percent of all injuries and illnesses. About half (9,580) of the injured RNswere long-term employees who worked for their employer for 5 or more years. (See table 1.)Table 1. Number of nonfatal occupational injuries and illnesses among registered nurses, by length ofservice with employer, private industry, 2016Length of service with employerNumber of injuries and illnessesLess than 3 months3 months to 11 months1 year to 5 yearsMore than 5 yearsNote: Data are available only for cases involving days away from work.Source: U.S. Bureau of Labor Statistics, Survey of Occupational Injuries and Illnesses.Event or exposure37702,7706,4609,580
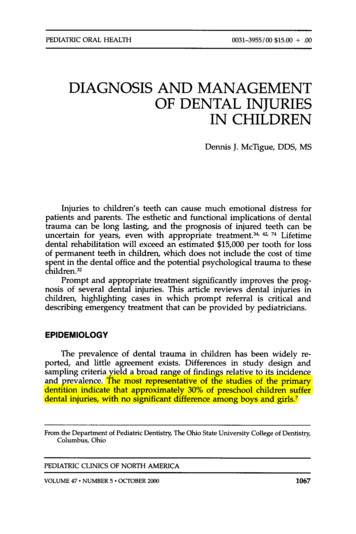
U.S. BUREAU OF LABOR STATISTICSMONTHLY LABOR REVIEWThe event or exposure describes the manner in which the injury or illness was produced or inflicted by the sourceof injury or illness. RNs stand and move throughout the day, have regular contacts with patients, and are oftenrequired to lift patients. As a result, overexertion and bodily reaction was the most prevalent event leading tooccupational injuries and illnesses to RNs, accounting for 45.6 percent of all cases within the occupation in 2016.(See figure 2.) The causes of this event are excessive physical effort, bending, twisting, lifting, and repetitivemotion.16 Falls, slips, and trips represented the next most common event, accounting for 25.0 percent of all injuriesand illnesses occurring to RNs. Violence and other injuries by persons or animals accounted for about 12.2percent of all cases. (From this point forward, the event category “violence and other injuries by persons oranimals” is referred to as “violent events.”17)While violent events accounted for only 12.2 percent of all injuries to RNs in 2016, the incidence rate—12.7 casesper 10,000 full-time workers—was approximately 3 times greater than the rate of violent events for all occupations(3.8 cases per 10,000 workers).Although RNs are exposed to medical-related workplace hazards on a regular basis, the percentage whoexperience days away from work due to needlesticks is low. In 2016, only 0.1 percent of RNs (20 cases)experienced needlesticks that were unintentional and that either transmitted an infectious agent or generated areaction to the drug injected. Needlesticks without exposure to a harmful substance were also uncommon,accounting for 0.6 percent of cases (120 cases). In total, 0.7 percent of cases involved needlesticks that required 1or more days away from work.4
U.S. BUREAU OF LABOR STATISTICSMONTHLY LABOR REVIEWSource of injury or illnessThe source of injury or illness is defined as the object, substance, equipment, or other factor that triggered theevent or exposure.18 In their typical work environment, RNs are exposed to injured or ill patients, needlesticks andsyringes, and chemicals. In 2016, the leading major source of injuries to RNs was “person other than injured or illworker,” with 8,370 total cases. Within this category, 8,080 of the injuries and illnesses resulted from healthcarepatients, accounting for 40.8 percent of all injuries and illnesses to RNs and occurring at a rate of 42.5 cases per10,000 full-time workers. Floors, walkways, and ground surfaces represented the next most common source ofinjury (typically, as a result of a fall or a slip), accounting for 18.4 percent of all cases among RNs.Nature of injury or illnessThe nature of injury or illness classifies the primary physical characteristic(s) of the work-related injury or illness,including traumatic injuries and disorders and various diseases.19 In 2016, 51.0 percent of all injuries and illnessesto RNs resulted in sprains, strains, or tears, which required a median of 7 days away from work. These injuriesoccurred at a rate of 53.1 cases per 10,000 full-time workers, significantly greater than the rate for all occupations(32.6 cases per 10,000 workers).Part of body affectedIn 2016, 27.7 percent (5,490 cases) of the days-away-from-work cases involving RNs resulted in injuries to theback and required a median recovery time of 7 days. These injuries occurred at an incidence rate of 28.9 casesper 10,000 full-time workers, greater than the rate of back injuries for all occupations (15.8 cases per 10,000workers).Differences in injuries and illnesses by age of workerRNs older than age 45 experienced more occupational injuries and illnesses than those age 44 and under. OlderRNs also experienced more severe injuries and illnesses than did younger RNs, with severity defined by mediandays away from work. The natures of injuries also differed between the two groups.RNs ages 45 to 54 accounted for 27.0 percent of total cases (5,350 occupational injuries and illnesses) within thisoccupation. (See table 2.) RNs ages 55 to 64 accounted for 24.7 percent of total cases (4,880 occupational injuriesand illnesses), followed by RNs ages 35 to 44, who accounted for 23.3 percent of total cases (4,610 occupationalinjuries and illnesses).While RNs age 65 and older accounted for only 3.3 percent of the total injuries and illnesses experienced by RNs(660 occupational injuries and illnesses), their injuries were relatively more severe than those of younger RNs.Table 2. Percentage of nonfatal occupational injuries and illnesses and number of median days away fromwork among registered nurses, by age group, private industry, 2016Age group (years)Occupational injuries and illnesses (percent)20–2425–3435–442.018.423.35Median days away from work (number)366
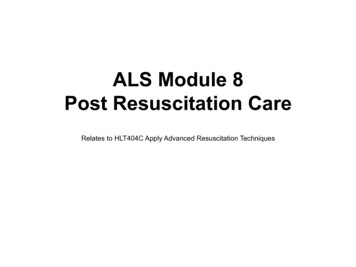
U.S. BUREAU OF LABOR STATISTICSMONTHLY LABOR REVIEWTable 2. Percentage of nonfatal occupational injuries and illnesses and number of median days away fromwork among registered nurses, by age group, private industry, 2016Age group (years)Occupational injuries and illnesses (percent)Median days away from work (number)45–5427.055–6424.765 3.3Note: Percentages may not add to 100 because of rounding. Data are available only for cases involving days away from work.Source: U.S. Bureau of Labor Statistics, Survey of Occupational Injuries and Illnesses.7817The events leading to occupational injuries and illnesses for RNs also differed by age group. (See figure 3.) AmongRNs ages 20 to 24, 25 to 34, 35 to 44, and 45 to 54, the most common event was overexertion and bodily reaction.Among RNs ages 25 to 34, 35 to 44, and 45 to 54, overexertion and bodily reaction was the event with the highestproportion of injury and illness cases. But for RNs older than age 64, the event with the highest proportion of caseswas falls, slips, and trips. RNs between the ages of 55 and 64 had equal proportions of overexertion and bodilyreaction and falls, slips, and trips. Together, these two events accounted for 75 percent of all RN cases in this agegroup.The most common nature of injury among RNs was sprains, strains, and tears. This was true for all age groups,except the 65-and-older group, whose natures of injury did not differ significantly.Injuries to the trunk were among the most common for RNs of all age groups. Trunk and upper extremities wereinjured equally often in the 20-to-24 age group, and trunk and lower extremities were injured equally often in the6
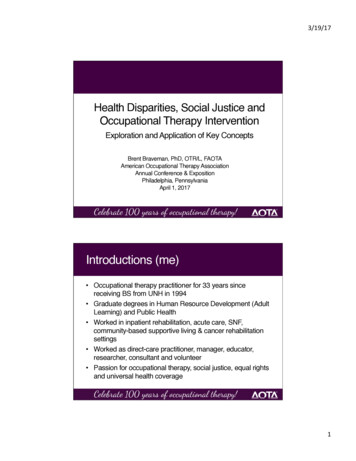
U.S. BUREAU OF LABOR STATISTICSMONTHLY LABOR REVIEW55-to-64 age group. For RNs age 65 and older, trunk, upper and lower extremities, head, and multiple body partswere all injured equally often. Trunk injuries accounted for approximately 40 percent of all RN cases in the 20-to-24age group, but only 20 percent of cases in the 65-and-older group.Patients are the largest source of sprains, strains, and tears. Floors, walkways, and ground sources are the largestsource of falls, slips, and trips. (See figure 4.)Musculoskeletal disordersWork-related musculoskeletal disorders (MSDs) include injuries or disorders of the muscles, nerves, tendons,joints, cartilage, and spinal discs. For instance, sprains or strains resulting from overexertion in lifting areconsidered MSDs. The SOII estimates the number and incidence rates of MSD cases requiring days away fromwork.In 2016, RNs in the private industry experienced 8,730 days-away-from-work cases classified as MSDs. TheseMSDs occurred at an incidence rate of 46.0 cases per 10,000 full-time workers, significantly greater than the ratefor all occupations (29.4 cases per 10,000 workers). (See figure 5.)7
U.S. BUREAU OF LABOR STATISTICSMONTHLY LABOR REVIEWSOII data show that MSDs accounted for 44.1 percent of all RN cases in 2016. Healthcare patients were theprimary source of these MSDs, causing 5,850 (67.0 percent) of all nonfatal MSD cases. The most affected part ofthe body was the back (51.8 percent of all MSD cases).Injury and illness experience by industryAs previously illustrated in figure 1, 74.1 percent of all injuries and illnesses experienced by RNs in 2016 occurredin a hospital setting. However, the most common event or exposure leading to RN injuries and illnesses varied bythe setting in which RNs were employed. For example, nearly half (49.7 percent) of the cases among RNs workingin hospitals were due to overexertion and bodily reaction. By comparison, this event accounted for approximatelyone-third of the cases among RNs in ambulatory healthcare services (35.0 percent) and nursing and residentialcare facilities (34.5 percent). (See figure 6.)8
U.S. BUREAU OF LABOR STATISTICSMONTHLY LABOR REVIEWConclusionThis article examined the prevalence of nonfatal occupational injuries and illnesses among RNs in 2016, providingthree main observations. First, RNs experienced a higher-than-average incidence rate of musculoskeletaldisorders. Second, the majority of nonfatal injuries and illnesses among RNs resulted from overexertion and bodilyreaction. Third, the case circumstances of nonfatal injuries and illnesses in the occupation varied by worker age.Data on the work environments of RNs by age group, the health effects of heavy workloads, and the types ofinjuries sustained by RNs would be useful in devising strategies for reducing the high rates of injury and illness inthe occupation. Additional measures to protect RNs from occupational hazards could benefit both patients and thehealthcare system as a whole.SUGGESTED CITATIONMichelle A. Dressner and Samuel P. Kissinger, "Occupational injuries and illnesses among registered nurses,"Monthly Labor Review, U.S. Bureau of Labor Statistics, November 2018, https://doi.org/10.21916/mlr.2018.27NOTES1 “Employment for the largest healthcare occupations, May 2016,” Occupational Employment Statistics (U.S. Bureau of LaborStatistics), https://www.bls.gov/oes/2016/may/healthcare.htm.9
U.S. BUREAU OF LABOR STATISTICSMONTHLY LABOR REVIEW2 Occupational outlook handbook, “Registered nurses: work environment” (U.S. Bureau of Labor Statistics), es.htm.3 Michelle Dressner, “Hospital workers: an assessment of occupational injuries and illnesses,” Monthly Labor Review, June 2017,https://doi.org/10.21916/mlr.2017.17.4 Jill A. Janocha and Ryan T. Smith, “Workplace safety and health in the health care and social assistance industry, 2003–07,”Monthly Labor Review, August 2010, -industry-2003-07.pdf.5 Occupational outlook handbook, “Registered nurses.”6 Ibid.7 “Safe patient handling programs: effectiveness and cost savings” (U.S. Department of Labor, Occupational Safety and HealthAdministration), https://www.osha.gov/Publications/OSHA3279.pdf.8 Fatal injuries and illnesses among RNs are relatively rare, and data on such cases are sparse. For these reasons, this articlefocuses on nonfatal injuries and illnesses in the occupation.9 Most private sector hospitals are general medical and surgical hospitals, whereas most state and local government hospitals arepsychiatric and substance abuse hospitals. Differences in patient interactions faced by RNs in these different kinds of hospitals lead todifferences in their injury and illness experiences. However, these differences are beyond the scope of the present analysis. See alsoDressner, “Hospital workers.”10 “Nonfatal occupational injuries and illnesses by case circumstances and worker characteristics,” Injuries, illnesses, and fatalities(U.S. Bureau of Labor Statistics), https://www.bls.gov/iif/oshcase1.htm.11 “OSHA injury and illness recordkeeping and reporting requirements” (U.S. Department of Labor, Occupational Safety and HealthAdministration), https://www.osha.gov/recordkeeping/index.html. OSHA differentiates between (1) cases involving days away fromwork or days of restricted work activity (or both) beyond the day of injury or onset of illness and (2) other recordable cases that do notresult in lost work time.12 Occupational injury and illness classification manual (U.S. Bureau of Labor Statistics, January 2012), https://www.bls.gov/iif/oiics manual 2010.pdf.13 “Standard Occupational Classification” (U.S. Bureau of Labor Statistics), https://www.bls.gov/soc/2010/home.htm.14 Occupational outlook handbook, “Registered nurses.” Sixty-one percent of RNs work in hospitals.15 “Household data annual averages—employed persons by detailed occupation, sex, race, and Hispanic or Latino ethnicity,” Laborforce statistics from the Current Population Survey (U.S. Bureau of Labor Statistics), https://www.bls.gov/cps/aa2016/cpsaat11.htm.16 Occupational injury and illness classification manual, section 2.4.2, “Event or exposure—titles and descriptions” (U.S. Bureau ofLabor Statistics, January 2012), https://www.bls.gov/iif/osh oiics 2010 2 4 2.pdf.17 This category includes intentional injuries by other persons, unintentional injuries by other persons, self-inflicted injuries, andanimal- and insect-related injuries and illnesses.18 Occupational injury and illness classification manual, section 2.3, “Source and secondary source of injury or illness” (U.S. Bureauof Labor Statistics, January 2012), https://www.bls.gov/iif/osh oiics 2010 2 3.pdf.19 Occupational injury and illness classification manual, section 2.1, “Nature of injury or illness” (U.S. Bureau of Labor Statistics,January 2012), https://www.bls.gov/iif/osh oiics 2010 2 1.pdf.10
U.S. BUREAU OF LABOR STATISTICSMONTHLY LABOR REVIEWRELATED CONTENTRelated ArticlesNursing and the Great Recession, Monthly Labor Review, July 2017.Hospital workers: an assessment of occupational injuries and illnesses, Monthly Labor Review, June 2017.A look at violence in the workplace against psychiatric aides and psychiatric technicians, Monthly Labor Review, March 2015.Workplace safety and health in the health care and social assistance industry, 2003–07, Monthly Labor Review, August 2010.Related SubjectsDays away from workHospitalsWorkplace Safety and HealthPrivate sectorOccupational safety and healthIndustry and Occupational studies11Health careIllnessesInjuries
RNs ages 45 to 54 accounted for 27.0 percent of total cases (5,350 occupational injuries and illnesses) within this occupation. (See table 2.) RNs ages 55 to 64 accounted for 24.7 percent of total cases (4,880 occupational injuries and illnesses), followed by RNs ages 35 to 44, who accounted for 23.