Transcription
V.SCS.0016 Carbon accounting technical manualProject codeV.SCS.0016Prepared byStephen WiedemannJane DunnIntegrity Ag & EnvironmentDate published13 January 2021Published byMeat & Livestock Australia LimitedLocked Bag 991NORTH SYDNEY NSW 2059Meat & Livestock Australia acknowledges the matching funds provided by the Australian Government to support theresearch and development detailed in this publication.This publication is published by Meat & Livestock Australia Limited ABN 39 081 678 364 (MLA). Care is taken to ensure theaccuracy of the information contained in this publication. However, MLA cannot accept responsibility for the accuracy orcompleteness of the information or opinions contained in the publication. You should make your own enquiries beforemaking decisions concerning your interests. Reproduction in whole or in part of this publication is prohibited without priorwritten consent of MLA.
GlossaryAEAdult equivalents (AE) is a standardised animal unit. An AE is a non-pregnant, nonlactating animal weighing 450kg LW that is maintaining condition.BenchmarkingComparing the performance of the enterprise against other producers and therest of the industry.Carbon accountingThe process used to quantify greenhouse gas (GHG) emissions from an enterprise.Carbon footprintingThe process of quantifying GHG emissions emitted directly or indirectly by anindividual, company or product.Carbon neutralityNet-zero carbon emissions.Carbon sequestrationThe process whereby carbon dioxide is removed from the atmosphere and storedin carbon sinks such as soils and vegetation.Carbon sinkA reservoir that absorbs carbon dioxide from the atmosphere. Natural carbonsinks include plants, soils and the ocean.Carbon stocksA carbon stock refers to the quantity of carbon that has been sequestered fromthe atmosphere and is stored in a carbon sink.CO2-eCarbon dioxide equivalents are a unit used to compare emissions from differentGHGs based on their global warming potential (GWP) over a specified time period,typically 100 years (GWP100).DMDry matter (DM) is moisture free feedDMIDry matter intake (DMI) is the amount of moisture free feed an animal consumes.DSEDry sheep equivalent (DSE) is a standardised animal unit. One DSE represents theenergy requirement of a 50kg dry ewe or Merino wether that is maintainingcondition.Emission intensityEmission intensity values are based on the net emissions relative to the output(e.g. per kg beef, sheep meat or greasy wool). Emission intensity values allow forcomparison and benchmarking between farms of different sizes. They are thestandard unit for a product carbon footprint.Enteric methaneEnteric methane is produced through enteric fermentation where plant materialis broken down in the rumen. Enteric methane is the by-product of this processand is expelled by the animal through belching.FullCAMThe Full Carbon Accounting Model (FullCAM) is a tool used for modelling GHGemissions from Australia’s land sector.GWPGlobal warming potential (GWP) is a measure of cumulative radiative forcing,which aims to quantify the long-term contribution of a gas to global warming.Each GHG has a specific GWP value and this is relative to a specified time period(typically 100 years, but values are also available for 20-year and 50-year timehorizons). For the 100-year time horizon, this is abbreviated as GWP100.GHGsGreenhouse gases (GHGs) are gases that absorb and emit radiant energy. Themain GHGs associated with agriculture are carbon dioxide (CO2), methane (CH4)and nitrous oxide (N2O).V.SCS.0016 Technical manual 2
HSCWHot standard carcase weight.Livestock inventoryAll information relating to livestock such as births, deaths, sales, purchases,weights and weight gain, and pregnancy status. Typically reported either at apoint in time (such as June 30) or over a whole year.LWGThe liveweight gain (LWG) of an animal. In this manual and the SB-GAF it isreported as kg/head/day.Net emissionsTotal emissions minus carbon sequestration.NGGIThe National GHG Inventory (NGGI) accounts for and estimates Australia’s GHGemissions.Purchased inputsPurchased products for the business such as fertilisers, herbicides, pesticides,feed, fuel, livestock and electricity.Radiative forcingThe difference between incoming solar radiation and outgoing infrared radiation.SOCSoil organic carbon (SOC) is the carbon component of organic matter in the soil.SOMSoil organic matter (SOM) is the living and dead organic materials, other thanliving plant roots, found in the soil.SB-GAFThe sheep and beef GHG accounting tool which can be used to generate a carbonaccount.TGPTotal gas production.V.SCS.0016 Technical manual 3
IntroductionThere is increasing concern around greenhouse gas (GHG) emissions and their contribution to global warming.Many companies, governments and industries are working to establish targets and strategies to achieve areduction in GHG emissions.Australia has set a target to reduce emissions to 26–28 % below 2005 levels by 2030 as part of the ParisAgreement (Commonwealth of Australia, 2017). Australian agricultural industries are facing increasing consumerand community pressure to reduce emissions. In response, the red meat industry has set a goal to achieve netzero carbon emissions (carbon neutrality) by 2030 (CN30). Achieving carbon neutrality will improve future accessto markets and ensure continued industry and community support.The yearly GHG emissions generated by livestock production and other farm-related operations can be measuredby conducting a ‘carbon account’. A carbon account allows producers to calculate their current GHG emissionsand also helps them to understand how GHGs and carbon management can impact enterprise productivity.The information required to complete a carbon account for a beef or sheep enterprise includes: a livestock inventory (births, deaths, sales, purchases, weights and weight gain, pregnancy status)an inventory of purchased inputscarbon in vegetation and (potentially) soil.A carbon account is an important tool for business planning as it allows producers to gain an understanding oftheir current position regarding GHG emissions and identify areas for improvement.Reducing GHGs can yield a range of benefits, such as: increased productivity and long-term sustainabilityimproving social licenceimproving market support for red meatengaging with emerging market opportunities for low carbon or carbon neutral products.This manualThis technical manual, developed for wider industry use, is based on the outcomes and feedback received from aseries of pilot carbon accounting workshops run in early 2020 across Australia. The purpose of this manual is toprovide background information on carbon accounting and guidance around building a carbon account using theGHG Accounting Framework calculators developed by the University of s manual will be used to develop further training materials and resources to enable Australian red meatproducers to build a carbon account as the industry pursues CN30.The manual includes: background information on livestock-related GHG emissionsa step-by-step guide detailing how to complete a carbon account for a beef and/or sheep enterpriseusing the sheep and beef GHG accounting tool (SB-GAF)carbon accounting example scenarios for farmstree and soil carbon storage on-farmopportunities to reduce GHG emissionsopportunities to store carbon to offset emissions.V.SCS.0016 Technical manual 4
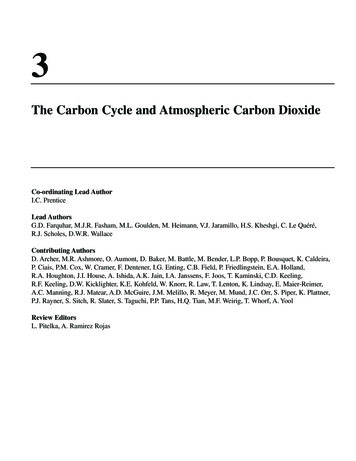
Carbon accountingUnderstanding greenhouse gasesMajor greenhouse gasesGHGs reported under the Australian government's National GHG Inventory (also known as the National InventoryReport or NIR (Commonwealth of Australia, 2020) include: carbon dioxide (CO2) methane (CH4) nitrous oxide (N2) sulphur hexafluoride (SF6) other hydrofluorocarbons and perfluorocarbons.The main emissions from agricultural production are CO2, CH4 and N2O (Figure 1, Figure 2, Figure 3). GHGemissions are measured in carbon dioxide equivalents (CO2-e) to allow for comparison in terms of the quantityand potency of emission sources. Each gas has a different capacity to contribute to global warming. For example,methane, a potent GHG, is the largest source of livestock emissions.Global warming potential (GWP) is a measure of cumulative radiative forcing, which aims to quantify the longterm contribution of a gas to global warming (Ranganathan et al., 2004). GWP100 is the global metric for assessingthe average contribution to global warming over the next 100 years. Using this system, the GWP100 value formethane is 28 (i.e. 28 times more warming potential than carbon dioxide), and the GWP100 value for nitrous oxideis 265.It is recognised by the industry that limitations may exist to the GWP100 method, particularly around howmethane is handled. Methane breaks down in the atmosphere after about 10–14 years, and accounting for thewarming effect over a much longer period (100 years) may be problematic if this breakdown factor is notaccounted for.Several other metrics have been proposed including Global Temperature Potential (GTP) (IPCC, 2014) and GWP*(Lynch et al., 2020), and these report lower impacts for methane under certain scenarios. In the future, newmethods may gain more traction and become standard practice, however, for the purposes of this manual, thestandard GWP100 values that are used by the Australian Government and internationally have been applied. Wenote that these GWP100 values are periodically updated in response to new science, and the values here align withthe Australian Government guidance as of July 2020.V.SCS.0016 Technical manual 5
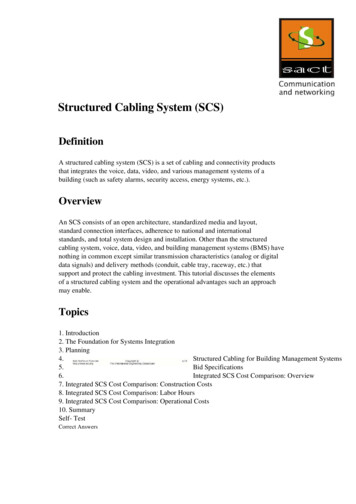
Figure 1: Sources of major farm greenhouse gas (GHG) emissionsSource: CN30 RoadmapWhen looking at global GHG emissions, carbon dioxide contributes the largest proportion, while methane andnitrous oxide make up a smaller part (Source: Australian Greenhouse Emissions Information System, Departmentof the Environment and Energy (May, 2020). These emission estimates account for multiple sectors: National GHGInventory Total, Energy, Fuel Combustion, Transport, Fugitive Emissions from Fuels, Industrial Processes,Agriculture, Land Use, Land-Use Change and Forestry KP, Waste, Other). In contrast, methane emissionsrepresent the majority of those generated via beef and sheep production while carbon dioxide and nitrous oxidemake up a smaller proportionEnteric (occurring in the intestines) methane arises from ruminant digestion and manure management. Carbondioxide emissions arise from fossil fuels used for lime and urea inputs, transport, machinery and other uses onfarm. Carbon dioxide emissions can also arise from the manufacture of purchased inputs such as fertiliser andfeed. Carbon dioxide emissions or removals (storage) can also occur from changes in soil and vegetation carbonlevels. Nitrous oxide emissions arise predominantly from manure excretion and fertiliser application.V.SCS.0016 Technical manual 6
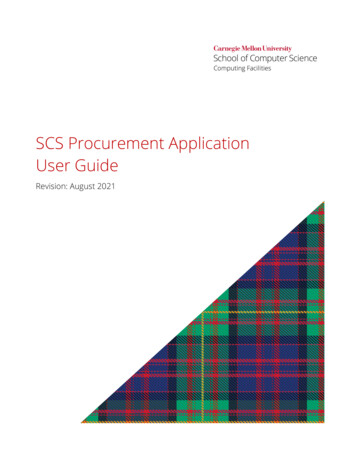
Figure 2: Australian GHG emissions by gasAustralian GHG emissions by gasCarbon dioxide(agriculture and otherland use)9%Nitrous oxide4%Methane21%Carbon dioxide (fossilfuel and industrialprocesses)66%Source: Australian Greenhouse Emissions Information System, Department of the Environment and Energy (May, 2020). These emissionestimates account for multiple sectors: National GHG Inventory Total, Energy, Fuel Combustion, Transport, Fugitive Emissions from Fuels,Industrial Processes, Agriculture, Land Use, Land-Use Change and Forestry KP, Waste, OtherFigure 3: Typical GHG emission breakdown in beef and sheep systemsTypical GHG emissions breakdown in beef and sheepsystemsNitrous oxide5%Carbon dioxide10%Methane85%Source: Wiedemann et al., 2015; Wiedemann et al., 2016. Note: the exact contributions can vary by 10% for methane and by about 5%for nitrous oxide and carbon dioxideV.SCS.0016 Technical manual 7
Methane from livestockMethane is a by-product of ruminant digestion and is released into theatmosphere via belching. It represents a major energy loss for theanimal, as methane has an energy content of 55.65MJ per kilogram(much the same as that of natural gas).In grazing ruminants, energy losses from methane are in the order of 6–10% of gross energy intake. Assuming a pasture with a gross energy of18 MJ/kg DM and metabolisable energy of 7. 3–11.7 MJ/kg DM, this lossequates to between 10–16% of metabolisable energy, depending onfeed digestibility.Methane (CH4) is the maingreenhouse gas generated inruminant grazing systems,typically contributingbetween 80–90% of totalfarm emissions.Reducing these emissions would substantially increase the amount of energy available for growth andreproduction. For this reason, it could be a major productivity gain if solutions or improvements were found formethane production.Methane production per animal has a linear relationship to dry matter intake (DMI) (Charmley et al., 2016). This istrue for most pasture types, but a small number of specific feed types have been shown to produce less methaneper kilogram of DMI. When assessing emissions for a herd or flock, the key determinants that influence the levelof these emissions are: livestock numberslivestock seasonal weights and mature weightsgrowth rates and reproductive status (the factors that influence feed intake).What is carbon accounting?It is both difficult and expensive to measure gas emissions (and carbondioxide uptake) on-farm. For this reason, carbon accounting is donethrough calculations to produce an estimate of emissions andsequestration.While it is called ‘carbon accounting’ for simplicity, it actually includescalculation of some nitrogen emissions (nitrous oxide) and could bebetter termed ‘GHG accounting’, but for the purpose of this manual, thetwo terms are considered synonymous.Creating a carbon accountallows producers tounderstand how GHGsinteract with the productivityof the enterprise.Draft minimum standards for carbon accounting and carbon footprinting (Appendix 1) have been developed forthe red meat industry to ensure consistency and minimise variation between different accounting methods(Wiedemann, 2019).Standard practice is to report emissions using different classifications depending on where the emissions ariseand how they relate to the business. These are termed emission ‘scopes’ according to the GHG ards/ghg-protocol-revised.pdf) (Ranganathan et al., 2004). Standardsdeveloped by the GHG Protocol govern the reporting and accounting of these GHG emissions.According to the GHG Protocol Ranganathan et al. (2004),chapter four, page 25, emissions are defined into threescopes: Scope one: emissions are direct GHG emissions from sources that are owned or controlled by thecompany. Scope two: emissions account for GHG emissions from the generation of purchased electricity consumedby the company. Scope three: emissions are a consequence of the activities of the company but occur from sources notowned or controlled by the company.V.SCS.0016 Technical manual 8
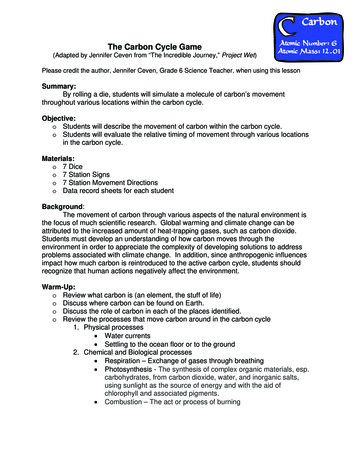
Some examples of scope three activities are those arising from the extraction and production of purchasedmaterials, the transportation of purchased fuels, and those from the use of sold products and services.These can be further broken down into two sources on-farm: Upstream scope three: emissions from pre-farm sources, such as the production of purchasedsupplementary feed, fertilisers and purchased livestock. Downstream scope three: emissions from post-farm sources, such as meat processing.Emissions can also be described with the terms direct and indirect emissions: Direct emissions are emissions from sources that are owned or controlled by the company. Indirect emissions are a consequence of the activities of the company but occur at sources owned orcontrolled by another company (Ranganathan et al., 2004) .Sources of emissions, by scope, for a grazing enterprise are outlined in Figure 4.Figure 4: Examples of scope one, two and three emission sources for a grazing systemMany businesses are primarily interested in scope one and two emissions, because these are the emissionsgenerated directly by the business. These can also be termed ‘on-farm emissions’. In Australia, under the NationalGreenhouse and Energy Reporting (NGER) system, businesses are required to report scope one and two emissionsif they exceed certain thresholds.However, it is important to note that there are no requirements to report livestock-related emissions under NGERand most agricultural businesses are well below the emission thresholds. In business accounting, scope threeemission reporting is generally optional (Ranganathan et al., 2004).If you only focus on scope one and two emissions in a livestock enterprise it is difficult or impossible to compare(benchmark) companies accurately, because each may operate in a different part of the supply chain (breeding,growing, finishing etc.). For the same reason, it is problematic and not advised to determine an emission intensityvalue based only on scope one and two emissions for benchmarking purposes.A carbon footprint requires scope one, two and three emissions to be included. This is required for carbon neutralcertification under systems such as the Federal Government Climate Active program (climateactive.org.au/).V.SCS.0016 Technical manual 9
Carbon accounting is the process by which producers can determine their net GHG emissions on an annualtimeframe. A carbon account includes two key elements:1. GHG emissions from:o enteric methane from ruminant productiono carbon dioxide from fossil fuels required for energy use, transport and purchased inputs such asfertiliser and supplementary feedo direct and indirect emissions of nitrous oxide from fertiliser application and excretao methane from manure.2. Carbon related to vegetation and soils on-farm:o Carbon that has been removed from the atmosphere through sequestration in vegetation andsoils, or emitted to the atmosphere through, for example, vegetation clearing or soildisturbance/degradation.Greenhouse Accounting Framework (GAF) toolProducers can create a carbon account for their farm by downloading the appropriate GAF tool from:piccc.org.au/Tools. These tools have been created by the University of Melbourne and in the case of the sheepand beef calculator, by Integrity Ag & Environment and the University of Melbourne in partnership with MLA. Thetools are free to access. They estimate the total GHGs emitted from a farm and identify the sources of theseemissions using the most up to date Australian National GHG Inventory (NGGI) methods.Sheep and beef GHG accounting (SB-GAF) toolThis manual focuses on the SB-GAF tool, which was developed for beef and sheep farms in 2020. The SB-GAF toolfocuses on emissions produced by livestock and major purchased inputs, and contains one module for estimatingsequestration from tree planting. Currently, it does not include an estimation tool for measuring changes in soilcarbon (positive or negative), nor does it include a tool for estimating vegetation carbon loss (e.g. from treeclearing). This may be developed in future versions of the tool.Full Carbon Accounting Model (FullCAM)Presently, tree and soil carbon can be estimated using FullCAM. FullCAM incorporates biological and managementprocesses that impact on carbon stocks and the flow of carbon in agricultural systems. FullCAM predicts biomass,litter and soil carbon pools, and accounts for human-induced land-use change practices and changes in majorGHG emissions.FullCAM is currently used to generate Australia's national GHG emissions account for the land sector(Commonwealth of Australia, 2020).To download FullCAM (free download) go to: ccounting-model-fullcam.FullCAM has recently been updated and the current version of SB-GAF needs to be updated to match the treesequestration data in the new release of FullCAM. This will be conducted as part of ongoing MLA CN30 activities.V.SCS.0016 Technical manual 10
Carbon accounting for beef cattle and sheepsystemsAccessing the sheep and beef GHG accounting tool (SB-GAF)To download the SB-GAF, go to: piccc.org.au/Tools and then click on the SB-GAF link. The file should automaticallydownload and, once downloaded, it can be accessed from the downloads folder on your computer.Open the file, rename it (perhaps include the year the carbon account is for) and save it. Once downloaded,renamed and saved, the tool can be used offline.What you will needThe information required to utilise the carbon accounting tool should be available from your farm taxationrecords, management records, or your memory. This includes: Livestock inventory: births, deaths, purchases, sales, weights and liveweight gain (LWG), weaningrates and reproductive status of animals. This contains the main information used to predictlivestock-related emissions, such as enteric methane emissions. This information could exist inlivestock reconciliation records for taxation or records in a livestock management program.Records of farm inputs: fertilisers, bought animal feed, fuel, electricity and purchases. Thisinformation is needed to estimate GHG emissions resulting from goods that you purchase from othercompanies. This information should be available in your tax records.Tree planting including area (ha), species and planting date (if available).General farm information (usually you can do this from memory).Inputs to other enterprises (e.g. cash cropping) operating on the same farm need to be separated as this toolcurrently only accounts for livestock activities.While the tool can be run for any year, we suggest selecting a ‘representative’ year that wasn't stronglyinfluenced by good or bad seasons, and preferably when the flock/herd was reasonably stable. This will give themost indicative starting point. Seeing there is often not a ‘representative’ year to pick from because change isalways occurring, it can be useful to average results from two to three years to get a baseline.Using data from an unusual year (drought or elevated rainfall) may give inaccurate results, particularly forcalculating emission intensity (emissions divided by LW or wool outputs). Calculating emissions intensity requiresthat the outputs are from a stable herd or flock. In a year where sales were artificially elevated to reduce livestocknumbers (for example, going into drought) it is inaccurate to divide emissions by livestock sales and the model isnot sophisticated enough to remove the effect of this.This is similar for financial records, where returns may remain high going into a drought because of elevatedsales, but this may not be a true reflection of business performance (unless sales are high by using gross profit assales less purchases plus inventory change). On the other hand, if you have a year where you are trying to buildyour herd or flock, and therefore have minimal sales, the simple calculation of emission intensity (emissionsdivided by sales) will be over-estimated as a result of reduced output relative to livestock numbers (just like yourfinancial records may indicate less money coming in). The tool is not sophisticated enough at this stage to correctfor these high or low sale events, so users need to compensate for this aspect to gain realistic results.How to use the livestock emissions calculatorThe ‘data input – beef’ and ‘data input – sheep’ tabs are the only tabs that require data to be input into them.Step-by-step instructions are provided below.V.SCS.0016 Technical manual 11
There is also a six-minute video available online to help explain how to input beef cattle data into quest). This video can also be used as a guide for inputting sheepdata as the data input pages for beef and sheep are relatively similar.Step one: Farm detailsStart at the top of the data input sheet and provide some basic information about your farm (Figure 5):a. Input your ‘farm name’b. Input your farm location details by selecting from the dropdown menu in each of these three questions:i.choose your region in Australiaii.is your property north of the Tropic of Capricorn?iii.is your property in the orange zone? (Ref Map. 1 in SB-GAF)Figure 5: Farm details section on the data input pageStep two: Livestock inventoryTo complete the livestock inventory section of the spreadsheet, ensure you have access to accurate and up-todate livestock records, including livestock numbers, liveweights (LWs) and LWG.If you would like an example of the data that goes in these cells, press the grey button located below the farmdetail sections, ‘Click here to populate the calculator with example beef data.’ Note that once you press the greybutton, you will not be able to undo it and will need to replace the example data with your own.For beef cattle, the livestock inventory is separated between breeder owner, bred cattle and traded cattle. Forsheep, it is separated between breeding flock and trade sheep.a. Livestock numbers: Input livestock numbers for each livestock category as an average for each seasonthroughout the year. This should take into account stock losses, sales and purchases. Traded cattle shouldbe placed in the separate category labelled ‘traded cattle’.b. Liveweight (LW): Input the average LW (kg/head) of each livestock category in each season. This should bean average weight for the season. If you do not know LW, it can be calculated from the LWG (if known). Tocalculate LW from LWG, see Figure 6.V.SCS.0016 Technical manual 12
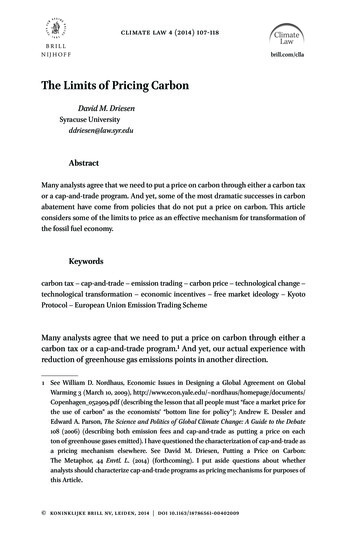
For example, as seen in Figure 6, to calculate the LW of ‘steers 1’ in summer, the LW from the previousseason is added on to the average LWG of that season and the previous season, and multiplied by thenumber of days in a season (91.25). If cattle are born in winter, the LW for spring would follow on from thewinter LW.When entering the LW of calves and lambs do not enter the birthweight. Instead, an average of LW acrossthe season is required. In the instance of calves born in the middle of spring, in both the ‘steers 1’ and‘heifers 1’ columns the average weight for the season would be calculated by adding the birthweight tothe growth rate and multiplying it by half the days in the season.For example, assuming a 35kg birth weight and growth rate of 1kg/head/day for calves for the first season,the average weight for spring would be 81kg (Figure 7).c. Liveweight gain (LWG): Input the estimated average daily LWG (kg/head/day). This should match the LWentered in the section above. If the LW across two seasons is known, then the LWG can be calculated fromthis. Figure 8 shows the calculation of LWG from LW. Find the difference in weight between the twoseasons (amount of growth) and divide this by the number of days in the season to give you the growthper day.Figure 6: LWG calculation (these functions can be found by clicking on the grey box in the spreadsheet to showexample data)V.SCS.0016 Technical manual 13
Figure 7: Calculating the LW for the birth season for calves and lambs based on the LWGFigure 8: Calculating LWG from LWStep three: Purchase inventorya. In ‘no. head purchased’ enter the total number of livestock purchased for each livestock category overthe year.b. In ‘purchase weight (LW/hd)’ enter the average LW (kg/head) when purchased.c. On the beef data input page, select ‘region where most cattle purchased’ for the breeding herd andtrade cattle from the dropdown list and enter ‘% of cattle purchased from this location.’ Check that theseV.SCS.0016 Technical manual 14
numbers add up to 100%. On the sheep data input page, enter the ‘% of sheep purchased’ as eitherMerino or cross-bred.Step four: Sale inventorya. In ‘no. head sold’ enter the total number of livestock sold in each category over the year.b. In ‘sale weight (LW/h)’ enter the average LW (kg/head) when sold.Step five: LWG (traded cattle)/LWG (traded sheep)This section automatically populates when you enter information into the purchase inventory and sale inventory.No action is required.Step six: Wool (only relevant on sheep input page; Figure 9)a. Enter the total ‘number shorn’ for each category.b. Enter the ‘wool shorn kg/hd’ for each category. This is intended to reflect wool shorn from woolproduced on the farm over the past 12 months (i.e. gross wool production). If sheep are purchased withsubstantial amounts of wool this wool should be removed. If sheep are sold with substantial wool thisshould be added.c. ‘Greasy wool production (kg/yr)’ will automatically populate based on the data entered in the cellsabove.d. Enter ‘clean wool yield’ as a %.Figure 9: Wool section on data input – sheepStep seven: Percentage of cows calving/ewes lambingEnter the calving rate/lambing rate. This should be calculated by dividing the number of calves/lambs born by thenumber of cows or ewes joined. If calving/lambing occurs over more than one season, ensure the total valuematches the annual calving or lambing rate. This should be a percentage.Step eight: Purchased inputsFor mixed sheep/beef enterprises be sure to split the purchased inputs between sheep and beef to avoiddoubling up.Fertilisera. Enter ‘urea fertiliser’ used in tonnes of urea used for pasture or crops used for grazing livestock only.b. Enter ‘other N fertiliser’ as tonnes of N. This requires that you calculate the amount of N based onthe tonnage and the percentage of N in the fertiliser.c. Enter ‘single super phosphate’ in tonnes.d. Enter ‘limestone applied to soils’ in tonnes.e. Enter ‘fraction’ of limestone (relates to the fractional purity of limestone. One is set as a default valuein the tool).V.SCS.0016 Technical manual 15
Energy and fuela. Select the ‘electricity source’ for the farm from the drop-down menu.b. Enter ‘annual diesel consumption’ for the livestock enterprise only in litres/year. This should includeon-road fuel use rel
V.SCS.0016 Technical manual 3 HSCW Hot standard carcase weight. Livestock inventory All information relating to livestock such as births, deaths, sales, purchases, weights and weight gain, and pregnancy status. Typically reported either at a point in time (such as June 30) or over a whole year. LWG The liveweight gain (LWG) of an animal. In .