Transcription
J. Water Resource and Protection, 2010, 2, 235-244doi:10.4236/jwarp.2010.23027 Published Online March 2010 (http://www.scirp.org/journal/jwarp)Photocatalytic Degradation of Isoproturon Pesticideon C, N and S Doped TiO2Police Anil Kumar Reddy, Pulagurla Venkata Laxma Reddy, Vutukuri Maitrey Sharma,Basavaraju Srinivas, Valluri Durga Kumari, Machiraju Subrahmanyam*Inorganic and Physical Chemistry Division, Indian Institute of Chemical Technology,Hyderabad, IndiaE-mail: subrahmanyam@iict.res.inReceived December 15, 2009; revised December 29, 2009; accepted January 22, 2010AbstractTiO2 doped with C, N and S (TCNS photocatalyst) was prepared by hydrolysis process using titanium isopropoxide and thiourea. The prepared samples were characterized by X-ray diffraction (XRD), scanningelectron microscopy (SEM), X-ray photo electron spectroscopy (XPS), BET surface area, FTIR and diffusereflectance spectra (DRS). The results showed that the prepared catalysts are anatase type and nanosized particles. The catalysts exhibited stronger absorption in the visible light region with a red shift in the adsorptionedge. The photocatalytic activity of TCNS photocatalysts was evaluated by the photocatalytic degradation ofisoproturon pesticide in aqueous solution. In the present study the maximum activity was achieved forTCNS5 catalyst at neutral pH with 1 g L-1 catalyst amount and at 1.14 x 10⁻⁴ M concentration of the pesticidesolution. The TCNS photocatalysts showed higher phtocatalytic activity under solar light irradiation. This isattributed to the synergetic effects of red shift in the absorption edge, higher surface area and the inhibitionof charge carrier recombination process.Keywords: Isoproturon, Pesticide Degradation, C, N and S Doped TiO2, Visible Light Active Catalysts1. IntroductionOrganic compounds are widely used in industry and indaily life, have become common pollutants in waterbodies. As they are known to be noxious and carcinogenic, an effective and economic treatment for eliminating the organic pollutants in water has been found to bean urgent demand. The treatment of water contaminatedwith recalcitrant compounds is an important task to attend every country in the world. To attain the standards,there is a need for new treatment. It is very much important that the treatment should be safe and economicallyfeasible. The wastewater purification technologies areclassified as physical, biological, and chemical methods.All the above processes are having some flaws duringtheir usage. The limitations include relative slow degradation, incomplete transformations and their inability tocover many organic compounds that do not occur naturally. Several chemical processes which use oxidizingagents such as ozone, hydrogen peroxide, H2O2/UV,H2O2/ozone/UV etc. have been carried out to mineralizemany synthetic organic chemicals. Sometimes intermeCopyright 2010 SciRes.diates formed are more hazardous than the parent compound. Therefore, alternative technologies are in demandfor development to treat recalcitrant compounds inwastewater effluents. Photocatalytic process has beenfound to be very active in the treatment of wastewatersfor the mineralization of broad range of organic pollutants. Thus, heterogeneous mediated photocatalysis treatment technique gained noteworthy importance for thetreatment of wastewaters.Semiconductor mediated photocatalytic oxidation ofwater pollutants offers a facile and cheap method.Among various oxide semiconductor phtocatalysts, TiO2has proved to be the most suitable catalyst for widespread environmental applications because of its biological and chemical inertness, strong oxidizing power,non toxicity, long term stability against photo andchemical corrosion [1,2]. However, its applicationsseems to be limited by several factors, among whichthe most restrictive one is the need of using an UVwavelength of 387 nm, as excitation source due to itswide band gap (3.2 eV), and this energy radiation availability is less than 5 % in solar light.JWARP
236P. A. K. REDDYSeveral works reported that doping TiO2 with anionssuch as carbon, nitrogen, sulphur, boron and fluorine shiftsthe optical absorption edge of TiO2 towards lower energy,there by increasing the photocatalytic activity in visiblelight region [3–9]. The preparation of doped TiO2 resultingin a desired band gap narrowing and an enhancement inthe phtocatalytic activity under visible light.In earlier reported studies, N doping of TiO2 isachieved by different methods such as sputtering of TiO2in a gas mixture followed by annealing at higher temperatures [3], treating anatase TiO2 powders in an NH3/Ar atmosphere [10], solution based methods like precipitation [11,12], sol-gel [13,14], solvothermal [15], hydrothermal processes [16] and direct oxidation of the dopentcontaining titanium precursors at appropriate temperatures [17]. In our earlier studies, we have concentrated ondegradation of isoproturon using TiO2 supported overvarious zeolites. The main idea of using Zeolite supportfor TiO2 is to enhance the adsorption capacity of thepollutant over the combinate photo catalyst systems[18–20]. In the present case the main focus is on shiftingthe absorption edge of TiO2 to visible light region byintroducing C, N and S into the TiO2 lattice structure.The present results obtained provides a simple route forthe preparation of C, N and S doped TiO2 with enhancedphotocatalytic activity under visible light irradiation forisoproturon pesticide degradation.2. Experimental Details2.1. Materials and MethodsAll the chemicals in the present work are of analyticalgrade and used as such without further purification. Isoproturon (IPU) ( 99% pure, Technical grade) was obtained from Rhône-Poulenc Agrochemie, France andtitanium isopropoxide was from Sigma-Aldrich chemieGmbH, Germany. HCl, NaOH and acetonitrile were obtained from Ranbaxy Limited, India. All the solutionswere prepared with deionized water obtained using aMillipore device (Milli-Q).2.2. Preparation of C, N and S Doped TiO2PhotocatalystC, N and S doped TiO2 photocatalyst was prepared by asimple hydrolysis process using titanium isopropoxide asthe precursor for titanium and thiourea as the source forcarbon, nitrogen and sulphur [26,34]. In a typical preparation, 10 mL of titanium isopropoxide solution wasmixed with 30 mL of isopropyl alcohol solution. Thissolution was added drop wise to 20 mL deionized watercontaining in a 250 mL beaker. The solution was thoroughly mixed using a magnetic stirrer for 4 h. To thissolution, required amount of thiourea, dissolved in 5 mLCopyright 2010 SciRes.ET AL.deionized water was added. The mixture was stirred for 6h and dried in oven at 80 0C for 12 h. The solid productformed was further calcined at 400 0C temperature for 6h in air to get C, N, and S doped TiO2 photocatalyst. Theweight (%) of thiourea doped TiO2 was controlled at 0, 1,3, 5, 10 and 15 wt% and the samples obtained were labeled as TCNS0, TCNS1, TCNS3, TCNS5, TCNS10 andTCNS15 respectively.2.3. CharacterizationThe catalysts were characterized by various techniqueslike XRD, XPS, FTIR, SEM, BET surface area andUV-Vis DRS. The XRD of catalysts were obtained bySiemens D 5000 using Ni Filtered Cu K α radiation ( 1.5406 A0) from 2θ 1-600. XPS spectra were recordedon a KRATOS AXIS 165 equipped with Mg Kα radiation (1253.6 eV) at 75 W apparatus using Mg Kα anodeand a hemispherical analyzer, connected to a five channel detector. The C 1s line at 284.6 eV was used as aninternal standard for the correction of binding energies.The Fourier transform-infra red spectra (FTIR) were recorded on a Nicolet 740 FTIR spectrometer (USA) usingKBr self-supported pellet technique. The SEM analysissamples were mounted on an aluminum support using adouble adhesive tape coated with gold and observed inHitachi S-520 SEM unit. BET data was generated on(Auto Chem) Micro Maritics 2910 instrument. UV–Visdiffused reflectance spectra (UV–Vis DRS) was fromUV–Vis Cintra 10e spectrometer.2.4. Photocatalytic ExperimentsIPU solution (0.114 mM) was freshly prepared by dissolving in double distilled water. All the phtocatalyticexperiments were carried out at same concentration untilunless stated. The pH of the solution was adjusted withHCl and NaOH. Prior to light experiments, dark (adsorption) experiments were carried out for better adsorptionof the herbicide on the catalyst. For solar experiments,isoproturon solution of 50 mL was taken in an open glassreactor with known amount of the catalyst. The solutionwas illuminated under bright solar light. Distilled waterwas added periodically to avoid concentration changesdue to evaporation. The solar experiments were carriedout during 10.00 A.M. to 3.00 P.M. in May and June2009 at Hyderabad.2.5. AnalysesThe IPU degradation was monitored by ShimadzuSPD-20A HPLC using C-18 phenomenex reverse phasecolumn with acetonitrile/water (50/50 v/v %) as mobilephase at a flow rate of 1 mL min-1. The samples werecollected at regular intervals, filtered through MilliporeJWARP
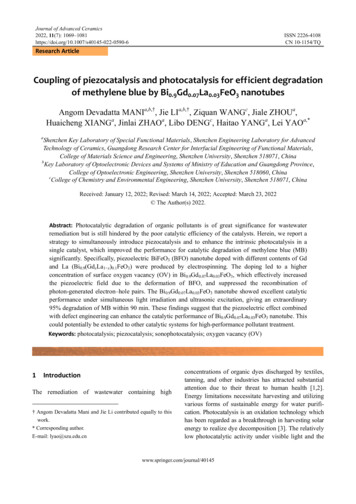
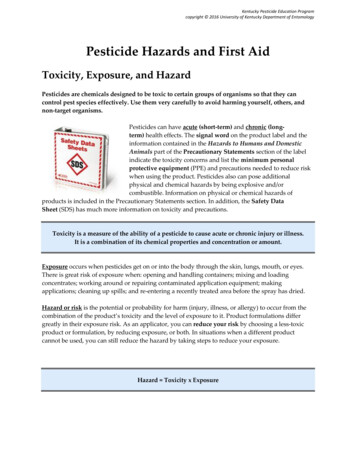
P. A. K. REDDYET AL.237micro syringe filters (0.2 μm).3. Results and Discussion3.1. Characterization3.1.2. XPSTo investigate the chemical sates of the possible dopantsincorporated into TiO2, Ti2p, O1s, C1s, N1s, and S2pbinding energies are studied by measuring the XPS spectra. The results are shown in Figure 2.The high resolution spectra of Ti2p3/2 and Ti2p1/2 corelevels are given in the Figure 2(a). The binding energyfor the Ti2p3/2 and Ti2p1/2 core level peaks for TCNS0appeared at 458.8 and 464.5 eV respectively which areattributed to O-Ti-O linkages in TiO2. Ti2p3/2 and Ti2p1/2core level peaks for TCNS5 are observed at 458.4 and464.1 eV with a decrease in the binding energy valuecompared to TiO2 indicating that the TiO2 lattice is considerably modified due to C, N and S doping [24].The chemical environment of carbon is investigated bythe XPS of C1s core levels as shown in the Figure 2(b).Three peaks are observed for the C1s at 284.6, 286.2 and288.8 eV. The first peak observed at 284.6 eV is assigned to elemental carbon present on the surface, whichis also in agreement with the reported studies [25]. Thesecond and third peaks at 286.2, 288.8 eV are attributedto C-O and C O bonds respectively [21,26].The high resolution XPS spectra of N1s core level isshown in Figure 2(c). Generally, N1s core level in Ndoped TiO2 shows binding energies around 369-397.5Copyright 2010 SciRes.Intensity (a.u)3.1.1. XRDTo investigate the phase structure of the prepared samples XRD was used and the results are shown in Figure1. It can be seen that TCNS exhibits only the characteristic peaks of anatase (major peaks at 25.410, 380, 480, 550)and no rutile phase is observed. The results are in goodagreement with earlier studies [21]. By applying DebyeScherrer equation, the average particle size of the TCNScatalysts is found to be about 3.8 to 5.8 nm. It can beinferred that the ratio of thiourea to titania slightly influence the crystallization of the mesoporous titania. Alsothe peak intensity of anatase decreases and the catalystbecomes more amorpous. It might be due to the fact thatthe doped nonmetals can hinder the phase transition(anatase to rutile) and restricts the crystal growth. It isnoteworthy that, even the doped samples exhibit typicalstructure of TiO2 crystal without any detectable dopantrelated peaks. This may be caused by the lower concentration of the doped species, and moreover, the limiteddopants may have moved into either the interstitial positions or the substitutional sites of the TiO2 crystal structure [22,23].abcdef1020302 405060Figure 1. XRD patterns of TCNS catalysts: (a) TCNS0, (b)TCNS1, (c) TCNS3, (d) TCNS5, (e) TCNS10, (f) TCNS15.eV that are attributed to substitutionally doped N into theTiO2 lattice or β nitrogen [3,27]. N1s peaks, with highintensity observed at and above 400 eV are assigned toNO, N2O, NO2-, NO3-. Sakthivel et al. [28] observed anintense peak at 400.1 eV that was assigned to hyponitrilespecies and concluded that the higher binding energy isdue to the lower valence state of N in N doped TiO2.Many researches pointed out that intense peak at 400 eVare due to oxidized nitrogen like Ti-O-N or Ti-N-Olinkages. Dong et al. [26] observed three peaks of N1s at397.8, 399.9 and 401.9 eV and has attributed to N-Ti-N,O-Ti-N and Ti-N-O linkage respectively. Recently,Gopinath observed N1s binding energy at 401.3 eV andclaimed the presence of Ti-N-O linkage on the surface ofN doped TiO2 nano particles [29]. Figure 2(c) shows theN1s spectra of TCNS5 catalyst and three peaks are observed at 397.8, 399.9 and 401.2 eV. Taking the literature support, here in the present investigation, the firstpeak at 397.8 eV is attributed to N-Ti-N linkages and thesecond and third peaks at 399.9 and 401.2 eV are ascribed to O-Ti-N, Ti-N-O linkages in the TiO2 latticerespectively.The O1s spectra of TCNS0 and TCNS5 are shown inFigure 2(d). The O1s peak for TCNS0 is observed at529.7 and 531.6 eV. The corresponding values are 530.2and 531.7 eV for the TCNS5 sample. The first peak ismainly attributed to the O-Ti-O linkage in the TiO2 lattice, and the second peak is closely related to the hydroxyl groups (-OH) resulting mainly from chemisorbedwater. It can be seen that the content of surface hydroxylgroups is much higher in the TCNS5 sample than in theTCNS0 sample. The increase in surface hydroxyl contentis advantageous for trapping more photogenerated holesand thus preventing electron–hole recombination [26].JWARP
P. A. K. REDDY238ET AL.(a)(b)(c)(d)(e)Figure 2. High resolution XPS of TCNS5 catalyst: (a)Ti2p, (b)C1s, (c)N1s, (d)O1s, (e)S2p.S2p XPS spectra for TCNS5 are shown as Figure 2(e).The oxidation state of the S-dopant is dependent on thepreparation routes and sulfur precursors. Previous studiesCopyright 2010 SciRes.have reported that if thiourea was used, the substitutionof Ti4 by S6 would be more favorable than replacingO2 with S2 [4]. S2p spectra can be resolved into fourJWARP
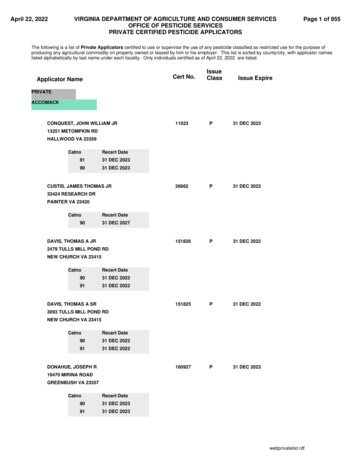
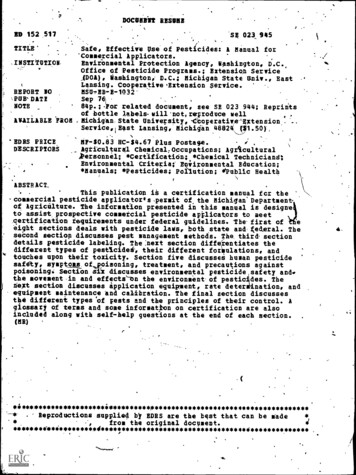
P. A. K. REDDYET AL.239peaks, S2p1/2 6 , S2p3/26 , S2p1/2 4 and S2p3/24 . The Figure 2(e) shows two peaks at 168.3 and 169.6 eV corresponding to S2p3/2 6 , S2p1/26 binding energies [30]. It isclear from the figure that S was doped mainly as S6 andnot S4 or S2 peaks. The sulfur doping further can besubstantiated by the decrease in binding energies of theTi2p1/2 and Ti2p3/2 of TCNS5 sample compared to thebinding energies Ti2p1/2 and Ti2p3/2 of the TCNS0 sample respectively (Figure 2(a)). This may be caused dueto the difference of ionization energy of Ti and S.Therefore, it could be concluded that the lattice titaniumsites of TiO2 were substituted by S6 and formed as anew band energy structure.3.1.3. FTIR SpectraFigure 3 shows the FTIR spectra of TCNS0 and TCNS5catalysts calcined at 400 C. The absorption bands2800–3500 cm-1, 1600–1680 cm-1 are assigned to thestretching vibration and bending vibration of the hydroxyl group respectively present on the surface of TiO2catalyst [31,32]. The presence of surface hydroxylgroups are substantiated by XPS of O1s spectra (Figure2(d)). The band around 1730 cm-1 is attributed to carbonyl group and bands at 1130, 1040 cm-1 are corresponding to nitrite and hyponitrite groups present inTCNS5 and they are absent in TCNS0 which shows successful doping of nitrogen into the lattice of TiO2[33,34]. No peak corresponding to NH4 absence (3189and 1400 cm-1) shows that N is present only in the formof nitrite and hyponitrite species [32].3.1.4. SEMThe surface morphology of TCNS photocatalyst is studied by scanning electron microscopy and the micrographs are presented in Figure (4). The samples appeared are agglomeration of smaller particles. From thisimage, we can see that the surface is rough and largenumber of pores found to be seen. SEM images for theundoped (TCNS0) and CNS-doped (TCNS5) shows thatFigure 3. FTIR spectra of TCNS catalysts.Copyright 2010 SciRes.Figure 4. SEM images of (a) TCNS0 and (b) TCNS5 catalysts.the particle morphology seems to be as spherical in boththe images and there is no considerable change in morphology of both. The photograph of thiourea doped TiO2(TCNS5) sample is exhibiting well-dispersed crystalsand the particle is homogeneous with the formation offine and well dispersed particles.3.1.5. UV-VIS DRSThe UV-Vis diffuse reflectance spectra (DRS) of TCNScatalysts are shown in Figure 5. It is seen from Figure 5(a)that the undoped TiO2 nano catalyst (TCNS0) showedstrong absorption band around 380 nm in the ultravioletregion. But, TCNS sample is showing absorbance at400-470 nm with red shift (about 100 nm) towards visible region. This shift in the absorption edge decreases thedirect band gap of TCNS catalyst compared to undopedTiO2 (TCNS0) and this may be due to the insertion of C,N and S into the TiO2 lattice [13,25,35]. Furthermore, thered shift in the DRS band increases with the increase indoped elements content into TiO2 lattice. Band gap energy (Eg value) of all the catalysts is estimated from theplot of absorbance versus photon energy (hv). TheJWARP
P. A. K. REDDY240ET NS0Absorbance (a.u)Absorbance (a.u)TCNS15TCNS10TCNS5TCNS3TCNS1TCNS0800Wavelength ( nm )1.61.82.02.22.42.62.83.03.23.43.63.84.0Bandgap (eV)(a)(b)Figure 5. UV-Vis diffusion reflectance spectra of TCNS catalysts.(a) Absorbance versus Wavelength; (b) Absorbance versus Bandgap.absorbance is extrapolated to get the bandgap energy forthe TCNS catalyst with good approximation as observedin Figure 5(b). The estimated bandgap energies of TCNS0,TCNS1, TCNS3, TCNS5, TCNS10 and TCNS15 are3.05, 2.91, 2.82, 2.7, 2.6 and 2.41 respectively. From theDRS results, it is clear that the C, N and S doping canshift the absorption edge of TiO2 to the visible range andreduce the band gap, which is beneficial for improvingthe photo absorption and ultimately photo catalytic performance of TiO2.3.1.6. BET Surface AreaThe surface area of TCNS catalysts calcined at 400 0C isshown in Table 1. The TCNS catalysts are showing highsurface area. The high surface area of the prepared catalysts is due to nanosize of the particles. It is also observed that the surface area of the catalysts increaseswith the increase in the ratio of thiourea to TiO2. Thiscan be attributed to decreasing of the crystallite sizes, asdiscussed in XRD analysis.3.2. Photocatalytic Activity3.2.1. Adsorption StudiesPrior to photocatalytic experiments adsorption and photolysis studies are carried out. The isoproturon solutionwas kept in dark without catalyst for 10 days and nodegradation is observed. Fifty milligrams of the catalystin 50 mL of isoproturon (1.14 10 4 M) solution is allowed under stirring in dark. Aliquots were withdrawn atregular intervals and the change in isoproturon concentration is monitored by HPLC. Maximum adsorption isCopyright 2010 SciRes.reached within 30 min for all the catalysts prepared. Thisillustrates the establishment of adsorption equilibrium as30 min and is chosen as the optimum equilibrium timefor all the future experiments. The photolysis (withoutcatalyst) experiment is carried out under the solar lighttaking 50 mL of isoproturon solution in glass reactor andonly 2–4 % of degradation is observed after 10 h of solarirradiation.3.2.2. Determination of Thiourea Loading over TiO2To compare the phtotcatalytic activity of the as-preparedsamples, phtocatalytic degradation of isoproturon undersolar light irradiation is performed. All the studies arecarried out at 1 g L 1 catalyst amount in 1.14 10 4 Misoproturon solution. The photocatalytic activity ofTCNS catalysts under solar light irradiation is shown inFigure 6. Among all the catalysts prepared, TCNS5 isshowing better phtocatalytic activity and complete degradation. The visible light activity of the samples hasincreased gradually with the increasing amount of dopentand it reaches optimum at 5 wt % loading (TCNS5) andfurther increase results an activity decrease gradually.Table 1. BET surface area and particle size of the NS15Particle size byXRD (nm)5.85.25.14.64.23.8BET surface area(m2/g)80.5382.4783.9789.1492.98124.28JWARP
P. A. K. TCNS10TCNS15Figure 6. Photocatalytic activity of C, N and S doped TiO2for the degradation of isoproturon aqueous solution (1.14 10-4 M) under solar-light irradiation.The different samples photo catalytic activity can beattributed to the following factors. It is known that thedoping of C, N and S elements in titania brings visiblelight absorption photocatalytic activity of titania. It canbe seen from the DRS spectra that C, N, and S dopingresulted in an intense increase in absorption in the visiblelight region and a red shift in the absorption edge of thetitania (Figure 5(a)). The band-gap narrowing of titaniaby C, N, S doping lead to enhanced photocatalytic activity of the titania under visible light. Because the prepareddoped samples can be activated by visible light, thusmore electrons and holes can be generated and participate in the photocatalytic redox reactions [21]. All together, the C, N, and S doped samples show much higherphotocatalytic activity than undoped tiantia. But we canalso see that at higher loadings photocatalytic activity ofTCNS samples has decreased though they show more redshift in the absorption edge. It might be due to the factthat, the excess dopent acts as recombination centerswhich facilitates electron-hole recombination thus lowering the activity. So, the photocatalytic activity is depressed to a certain extent. To conclude, the higher activity of the TCNS5 sample can be ascribed to the high surface area, strong adsorption in visible region and lowerrecombination of electron-hole pair due to high concentration of surface hydroxyl groups (Figure 2(d)) whichcan trap the photo generated holes and thus decreasingthe electron hole recombination process [26].3.2.3. Effect of Substrate ConcentrationThe effect of substrate concentration is an important parameter for photocatalytic degradation activity overknown catalyst amount. The 7.28 10 5, 1.14 10 4 and2.42 10 4 M concentrations of isoproturon are studiedover TCNS5 catalyst with 1.0 g L 1 catalyst amount. It isseen from Figure 7 a slight difference in degradation rateCopyright 2010 SciRes.3.2.4. Effect of Catalyst AmountThe catalyst amounts 0.5, 1.0 and 2.0 g L 1 of TCNS5are investigated for effective isoproturon degradation(Figure 8). It is observed that, increasing amounts0.5–1.0 g L 1, the photocatalytic activity has increasedand at the higher amounts the activity trend is not encouraging. This is due to the higher amounts of the catalyst makes the solution turbid which obstructs the lightpath into the solution and inturn reducing the formationof OH radicals. In the present study, 1.0 g L 1 is found tobe the optimum catalyst amount for efficient degradationof isoproturon.3.2.5. Effect of pHThe effect of pH is an important parameter because itcommands the surface charge properties of the catalystand therefore the adsorption of the pollutant. The pHstudies at 3–10 are carried over TCNS5 catalyst using1.0 g L 1 of 1.14 10 4M isoproturon solution. The adsorption capacity of the catalyst in different pH ranges isnot much affected due to the non-ionic nature of isoproturon. The results depicted in Figure 9 are showing thatat neutral pH, the rate of degradation is faster comparedto acidic or basic medium [36]. This may be due to thenon-ionic nature of isoproturon. In basic medium, thereis a slight increase in degradation rate and is observedwhen compared to the acidic medium. This may be because,the OH radicals are mainly attacking methyl groups0.0400.0350.030-10.025Rate constant k min0.030-1241over titania supported catalyst for 7.28 10 5, 1.14 10 4M concentrations are observed compared to 2.42 10 4 M.This indicates, at higher concentrations OH radicalsproduced by the catalyst are not sufficient to degrade thepollutant molecules which are adsorbed or near to thecatalyst surface. Hence, 1.14 10 4 M solutions is chosen for the degradation as there is an equilibrium between adsorption of reactant molecules and the generation of OH radicals from the active sites.0.035Rate constant k minET AL.0.0250.0200.0150.0100.0050.000-57.28 x 10 M-41.14 x 10 M-42.42 x 10 MFigure 7. Effect of initial concentration on the rate of solarphotocatalytic degradation of isoproturon over TCNS5.JWARP
P. A. K. REDDY242ET AL.63.5y 0.0334x5y 0.0207x2.5-2Ln(Co/C)4Rate constant x 10 min-13.03y 0.0129x212.01.51.00.500501001502000.0pH3Time (min)Figure 8. Effect of catalyst amount on photocatalytic degradation of isoproturon over TCNS5 catalyst under solar lightirradiation: 0.5 g L-1 ( ), 1g L-1( ) and 2 g L-1 ( ).1.0pH8pH10(i)Absorbance (a.u)% Isoproturon (C/C0)pH7Figure 9. Effect of pH on solar photocatalytic isoproturondegradation over TCNS5. (Experimental conditions: C0 1.14 10 4 M; catalyst amount 1.0 g L 1.)Cycle iCycle iiCycle iiiCycle iv0.8pH50.60.4(ii)0.20.0050100150200250300300Time (min)(a)400500600Wavelength (nm)700800(b)(c)Figure 10. Isoproturon degradation over TCNS5 catalyst. (a) Recycling activity studies. (Experimental conditions: C0 1.14 10 4 M; pH 7; catalyst amount 1.0 g L 1.) Characterization of 1) Fresh and 2) Used (after 4th cycle) catalysts (b)UV–Vis DRS spectra and (c) SEM photographs.Copyright 2010 SciRes.JWARP
P. A. K. REDDYand the hydroxylation of aromatic ring is clearly unfavored with decrease in pH, whereas in basic medium thehydroxylation of aromatic ring is favored but not themethyl groups. In neutral medium, the OH radicals attack both on the aromatic ring and on the methyl groups.This cumulative effect results a maximum degradationrate of the pollutant [20].3.2.6. Catalyst Recycling StudiesTo evaluate stability/activity of the catalyst for photocatalytic degradation, the recycling studies are conductedover TCNS5 using 1.0 g L 1 catalyst and the results areprovided in Figure 10(a). After completion of the 1st cycle, the catalyst is recovered, dried and is reused as such(without any calcination) for the 2nd cycle, a slight decrease in the rate of degradation is observed compared tothe first cycle. When same catalyst is reused without calcination for the third cycle, there is a slight decrease indegradation rate observed compared to first and secondcycle. The differences in rates are due to the accumulatedorganic intermediates on the surface of the catalyst, affecting the adsorption in turn reducing the activity. This isconfirmed by calcining the 3rd cycle used sample at 4000C for 3 h and reused for the 4th cycle activity. The original activity of the catalyst for degradation is restored.This indicates that calcination of the used catalyst is necessary in order to regain the activity. Furthermore, this issubstantiated by comparison of the surface characterization studies like SEM and UV–Vis DRS techniques onthe fresh and 4th cycle used samples Figures 10(b)-10(c).The band gap as well as wavelength excitations are nothaving any changes in the UV–Vis DRS spectra of thefresh and used catalysts. From SEM photographs, it isclear that the surface morphology is not changed muchand it indicates that catalyst is intact even after the 4thcycle. Thus, the above studies prove that the catalyst isreusable for number of cycles without any loss in activityand stable for longer life.4. ConclusionsThe present study demonstrates preparation of a C, N,and S doped TiO2 photocatalyst and its role in photocatalytic pesticide degradation. The results conclude that5 wt% thiourea doped TiO2 (TCNS5) is an efficientcatalyst for the photocatalytic degradation of isoproturon.The higher activity of TCNS5 catalyst may be due to thehigh surface area, lower electron-hole recombination andthe stronger adsorption in visible light region. The substrate concentration of 1.14 10 4 M, catalyst amounts 1g L 1 and neutral pH are found to be favorable for higherdegradation rates of isoproturon. The catalyst activity isfound to be sustainable even after the 4th cycle (as evidenced by SEM and UV–Vis DRS techniques).Copyright 2010 SciRes.ET AL.2435. AcknowledgementsThe authors PAKR, MS thank CSIR, New Delhi forfunding this work under Emeritus Scientist Scheme.6. References[1]A. Fujishima, K. Hashimoto, and T. Watanabe, “TiO2photocatalysis: Fundamentals and applications,” BKC,Tokyo, 1999.[2]L. Q. Wu, N. Xu, and J. Shi, “Leak growth mechanism incomposite Pd membranes,” Industrial & EngineeringChemistry Research, Vol. 39, pp. 342–348, 2000.[3]R. Asahi, T. Morikawa, T. Ohwaki, K. Aoki, and Y. Taga,“Visible-light photocatalysis in Nitrogen-Doped titaniumoxides,” Science, Vol. 293, pp. 269–71, July 2001.[4]T. Ohnoa, M. Akiyoshi, T. Umebayashi, K. Asai, T. Mitsui, and M. Matsumura, “Preparation of S-doped TiO2photocatalysts and their photocatalytic activities undervisible light,” Applied Catalysis A: General, Vol. 265, pp.115–121, February 2004.[5]X. Chen and S. S. Mao, “Titanium dioxide nano-materials: Synthesis, properties, modifications, and applications,” Chemical Review, Vol. 107, pp. 2891–2959,2007.[6]H. Irie, Y. Watanabe, and K. Hashimoto, “Carbon-dopedanatase TiO2 powders as a visible-light sensitive photocatalyst,” Chemistry Letters, Vol. 32, pp. 772–773, May2003.[7]W. Ho, J. C. Yu, and S. Lee, “Synthesis of hierarchicalnanoporous F-doped TiO2 spheres with visible lightphotocatalytic activity,” Chemical Communications, pp.1115–1117, January 2006.[8]L. Lin, W. Lin, Y. Zhu, B. Zhao, and Y. Xie, “Phosphordoped titania —A novel photocatalyst active in visiblelight,” Chemistry Letters, Vol. 34, pp. 284–285, November 2004.[9]T. Ohno, T. Mitsui, and M. Matsumura, “Photocatalyticactivity of S-doped TiO2 photocatalyst under visiblelight,” Chemistry Letters, Vol. 32, pp. 364–365, January2003.[10] H. Irie, Y. Watanabe, and K. Hashimoto, “Nitrogenconcentration dependence on photocatalytic activity ofTiO2-xNx po
236 P. A. K. REDDY ET AL. Several works reported that doping TiO2 with anions such as carbon, nitrogen, sulphur, boron and fluorine shifts the optical absorption edge of TiO2 towards lower energy, there by increasing the photocatalytic activity in visible light region [3-9]. The preparation of doped TiO2 resulting