Transcription
Measuring and ManagingCatastrophe Riskby Ronald T. KozlowskiStuart B. Mathewson81
Measuring and Managing Catastrophe RiskRonald T. KozlowskiStuart B. MathewsonAbstract:This paper gives a basic introduction to the standard framework behind catastrophe modelingand explores the output of catastrophe modeling via modernized “pin maps” and loss likelihoodcurves. This paper also briefly discusses some of the uses of catastrophe modeling in additionto traditional probable maximum loss estimation and comments on the use of modeling forreinsurers. This article is intended to be “food for thought” and hopes to stimulate newcatastrophe modeling ideas and enhancements.Biography:Ronald T. Kozlowski is a Fellow of the Casualty Actuarial Society, a Member of the AmericanAcademy of Actuaries, and a Consulting Actuary in the Hartford office of Tillinghast. Mr.Kozlowski holds a Bachelors degree in Actuarial Science from the University of Illinois atChampaign-Urbana. Among Mr Kozlowski’s many assignments and responsibilities is thedevelopment of TOPCAT, Tillinghast’s property catastrophe model.Stuart B. Mathewson is a Fellow of the Casualty Actuarial Society, a Member of the AmericanAcademy of Actuaries, a Chartered Property Casualty Underwriter and a Consulting Actuary inthe Chicago office of Tillinghast. Mr. Mathewson holds a Bachelors degree in Fire ProtectionEngineering from the Illinois Institute of Technology. Mr. Mathewson has spoken extensivelyat actuarial and other insurance group meetings on catastrophic loss modeling and heads thedevelopment of TOPCAT.82
Measuring and Managing Catastrophe RiskIntroductionProperty insurance companies have been concerned with the risk of catastrophic loss andhave used mapping as a method to control their exposure since the 1800s when insurancecompanies were hit by fires in major cities (Boston, Chicago and Philadelphia). Mapping wasfirst used to measure conflagration exposure; at that time there was no coverage for perilsother than fire and lightning. Underwriters would place pins on a map showing the location oftheir insured buildings, and they would restrict the exposure the company would retain in ablock or town. Wii the introduction of windstonn as a covered peril in the 1930% companiesused similar practices to assure that they were not overly concentrated for hurricane or tornadoperils. These “pin maps” were used until the expense reductions of the 1960’s forcedcompanies to abandon this time-consuming practice.About this time, the U.S. was experiencing a period of low frequency and severity of naturalcatastrophic events. Damaging hurricanes were scarce, especially in Florida, and a majorearthquake had not occurred since 1906. Modem fire fighting and construction practices hadminimized the threat of conflagration. As a result, the insurance industry largely lost thediscipline of measuring and managing exposures susceptible to catastrophic loss.The property catastrophe reinsurance industry had done well in these fortunate times andsubsequently reduced reinsurance rates to levels well below long term needs. Primarycompanies were able to purchase property catastrophe reinsurance at low prices. Property83
catastrophe reinsurance purchasing decisions were centered mainly on the desired maximumlimit; price considerations were not a significant concern. In essence, primary companiesmanaged their catastrophe exposures simply by purchasing appropriate reinsurance andignored their concentrations of exposure.In 1989, this naive world changed. Hurricane Hugo caused the largest catastrophe loss inhistory, and the Loma Prieta earthquake re-awakened fears of earthquake losses. Thereinsurance market reacted to these and other world-wide events. Catastrophe reinsuranceprices started to increase and coverage was restricted.On the heels of those events, Hurricane Andrew struck South Florida. Some insurancecompanies took significant hits to their surplus: others went bankrupt. Many insurancecompanies had not realized the extent of their exposure concentrations.Reinsurance marketsreacted swiftly by radically raising prices and retentions while restricting limits. Regulators,rating agencies, and boards of directors became instantly and intensely concerned aboutcompanies’ abilities to manage their catastrophe exposures.The Northridge Earthquake and the Kobe, Japan Earthquake have raised new concerns overthe insurability of the “big one” and the sucess of engineering against earthquakes.This paper will discuss some of the basics of catastrophe modeling, the current capabilitiesand some current modeling problems.841-
The Use of Quantitative Tools to Measure Catastrophic RiskWith advances in computer technology, new quantitative tools have been developed to helpmanage catastrophic risk. Geographic information systems have allowed companies toresurrect the “pin maps”, with significant additional abilities. But, well beyond merely looking atexposures, catastrophe simulation models have given us the ability to estimate potential lossesin a way that truly reflects the long term frequency and severity distributions.As actuaries, we know that expected catastrophic losses and reinsurance decisions should notbe based upon past catastrophic losses. Insured loss data from catastrophes has beencaptured for roughly the last 45 years. Severe hurricanes and earthquakes are so relativelyinfrequent that this body of experience cannot hope to represent the scope of potentialoccurrences. Also, the distribution of insured properties has changed dramatically over timewith the population movement towards the Atlantic and Gulf Coasts and earthquake-proneareas of California.Clark [1] and Friedman [2] have shown us alternative methods for determining catastrophelosses through the use of simulation modeling. This involves simulating the physicalcharacteristics of a specific catastrophe, determining the damage to exposures, andcalculating the potential insured losses from these damages. While specific catastrophesimulation models are different, they all operate within a simple framework. These three steps,which we named the Science Module, the Engineering Module, and the Insurance CoverageModule, will be discussed after we discuss the most important component of catastrophemodeling: The Exposure.85
The ExposureAll discussions of catastrophic exposure management must begin with the accuracy andavailability of exposure data. The most sophisticated, complex catastrophe modeling systemscannot estimate an insurer’s losses if the insurer cannot identify what insurance coverageshave been written and where those risks are located.Company exposure databases vary considerably. The decisions to retain exposureinformation may be based on statistical agency, rate filing, or management informationrequirements. Budget restraints have also contributed to the designs of some exposuredatabases. Catastrophe exposure management considerations are almost always ofsecondary importance.Exposure information can be separated into two categories: physical characteristics andinsurance coverage.Physical characteristics may include:ltypeof riskllocation.construction.number of stoneslageof risk.number of risks86-3*;;i;;
The type of risk can be described in insurance terms through the line of business, classificationand type of policy codes. The line of business codes can distinguish between personalproperty, commercial property, personal automobile, commercial automobile, personal inlandmarine, commercial inland marine, businessowner, or farmowner policies, Classification codescan distinguish the type of risks such as signs, boats, livestock, inventories, etc. The type ofpolicy code can distinguish between different types of commercial policies (mercantile,contracting, motel, office, apartment, etc.).The quality of location data available from companies varies substantially. Often, the locationrecorded is the billing location, rather than the location of the property insured. While this maybe only a moderate problem for personal lines, it can cause major distortions when modelingcommercial lines. For a more complex commercial policy, many of the locations will not beidentified. This may cause a false measure of concentrations at the billing location, whileunderstating other areas.Some companies cannot provide location detail at zipcode or street address. Location on acounty or state detail can be spread to finer detail using population densities or census data,but this can lead to severe distortions in measuring the concentrations for a specific insurancecompany. Insurance companies must be encouraged to retain fine location detail. Futureexposure location identification could use the latest satelite technology (global positioningsystems) to determine exposure locations within a few feet.Insured coverage data may include:0coverage type81
0coverage amounts.replacement cost provisions.insurance-to-value erage type distinguishes the type of insured exposure such as buildings, contents,appurtenant structures, vehicles, business interruption, etc. Replacement cost and insuranceto-value provisions identify those provisions where the insurance coverage may be greaterIIthan the specified coverage amount. Deductibles, co-insurance, and reinsurance provisionscan reduce the insured loss to the company.-Our experiences show that many insurance companies have difficulty retrieving their data in auseable fashion. Extracted information often does not balance with insurance companyreports. Exposure data can be unreliable due to input errors or heavy reliance on defaulterrors; for example, zipcodes often conflict with county or state coding.“.”3The first step that many insurance companies need to take to accurately measure theirexposures is to refine their data collection and retrieval so they can be assured that the datawill give an accurate picture of their insured properties. Most insurance company’s systemspersonnel do not understand underwriting specifications and therefore cannot verify thereasonability of the data provided. Underwriting and/or actuarial personnel must be involved toassure the reasonableness I f exposure data.88
Once exposure data is deemed to be reasonable, the modeling process can begin. We willnow briefly discuss the three modules in any catastrophe simulation model.The Science ModuleThe first module simulates the natural phenomenon (i.e., hurricanes, storm surge,earthquakes, fire following earthquake, tornadoes, hail, winter storms, etc.). The events canusually be described through a series of scientific equations and parameters that determinethe resulting force that causes damage.For hurricanes, numerous models exist to estimate windspeeds at risk locations caused byspecific storms. A sample of a simplistic hurricane function might look like this:Wz f(dp, r, s, I, a, t)where Wz Wtnd speed at location z,dp Ambient pressure minus central pressurer Radius of maximum windss Forward speed of the stormI Landfall location (longitude, latitude)a Angle of incidence at landfallt Terrain or roughness coefficient at location zClark [1] describes one such modeling system. That paper shows in detail how hurricanes canbe simulated and used to estimate insc-ante losses.89
For earthquakes, the result of this module is a shaking intensity at a specific location (i.e.,zipcode or street address). One possible relationship may look like this:Iz f( m, s, e, a, g, d )where Iz Shaking intensity at location z,m Magnitude of the earthquakes Fault or seismic area, including location and characteristicse Epicenter locationa Angle of the fault ruptureg Ground conditions, including poor soil and liquefaction potential,/,/xd Distance from fault rupture or epicentral areaThe equations underlying these functions are based upon scientific equations that are wellbeyond the scope of this paper. These equations can range from simple equations to morecomplicated series of differential equations.The Engineering ModuleThe engineering module is used to determine the exposure damage resulting from thewindspeeds or shaking intensities. Wind and earthquake engineering provide the research todetermine these relationships. We can express these functions as follows:Pz,c,a,s,v f( Wz, c. a, s, v), for hurricane orPz,c,a,s,v f( Iz, c, a, s, v ), for earthquake90,.
where Pz,c,a,s,v Percent damage at location z for risk characterized by c, a, s and vc Construction of buildinga Age of buildings Number of stonesv Coverage, i.e. building, contents, time elementIf we apply these damage percentages to the exposed properties from an insurancecompany’s database, the result will be an estimate of the total damage to those propertiescaused by the catastrophe being simulated.Dz,c,a,s,v Ez,c,a,s,v x f( Wz, c, a, s, v) for hurricane Ez,c,a,s,v x f( lz, c, a, s, v) for earthquakewhere Dz,c,a,s,v Damage at location z for risk characterized by c, a, s, vEz,c,a,s,v exposure at location z for risks characterized by c, a, s, vDamages can vary by more than just construction type, number of stories, age of building, andtype of coverage (e.g., regional construction practices, building code and building codeenforcement, occupancy use, surrounding terrain, etc. ).Friedman [2] gives an example of damage relationships, which form the basis of the earlierwind models. ATC-13 [3] provides much of the basis for earthquake damage relationships.More research is being done by the engineering community to refine these relationships toaccountforsome of these factors. The engineering community would welcome a cooperativeaction by insurance companies to pool detailed historical loss data to add to the theoreticalresearch now being done.91
Recent studies have shown that additional exposure information such as window and doorprotection, roof covering, and roof sheathing attachment have the greatest influence on theoverall resistance to hurricane damage [4]. New studies like these are helping insurancecompanies identify those underwriting factors that promote loss mitigation. Just as fire perilconcerns determined early statistical reporting, the wind and earthquake perils shouldencourage finer detailed exposure information for underwriting control and exposurequantification.The insurance Coverage ModuleThe last module translates the damaged exposure into insured damaged exposure. This,/,,/includes reflection of limits, replacement cost provisions, and insurance-to-value provisions.This module also includes loss reduction provisions such as deductibles, co-insurance, and. Ireinsurance.IDz,c,a,s,v f( ( Dz,c,a,s,v ), r, d, I ) Min[Max[(( Dz.c,a,s,v)x r)-d,01, I] [(Dz,c,a,s,v)x a]where IDz,c,a.s,v Insured damage at location z for risk characterized by c, a, s, v;;;IDz,c,a,s,v Damage at location z for risk characterized by c, a, s, vr Guaranteed replacement cost multiplierd DeductibleI Reinsurance limita ALAE percentage92,.wmi
Deductibles need to be modeled on a straight dollar deductible or percentage deductible,especially for earthquakes. The deductible calculation needs to reflect that the damagefactors used are based on the average damage and that, in some instances, the deductiblemay exceed the damage to the exposure. As the average damage value increases, thegreater the utilization of the full deductible.Reinsurance adjustments should reflect both pro rata and excess policies written on both afacultative and treaty basis. Deductibles and reinsurance coverage may vary on a per buildingor per occurrence basis.This module can also include reflection of allocated loss adjustment costs and loss of use orbusiness interruption policies.Deterministic/ProbabilisticModelingModels can have deterministic and/or probabilistic approaches.Deterministic modeling is thesimulation of specific events, either historical or hypothetical, which are pertinent to theportfolio under study. This can be helpful for validating model results, or for providing anestimate for a certain event which concerns management.However, probabilistic modeling has the potential to provide much more information tomanagement.In this method, the modeler runs a large library of hypothetical events thatcovers the range of potential events. From the results of all of these simulations, the modelercan estimate the probabilities of various levels of loss to the company (i.e., loss likelihood).This allows the company to manage its exposure portfolio and determine reinsurance93
decisions by comparing the potential losses with the company’s appetite for risk. The graphbelow shows the probabilistic loss curve for a sample insurance company.1,wJ. l, . 1Samale insurance Company”1loo010010Loss Likelihood(ReturnlwooPeriod)The above graph can also be depicted by a histogram, where the width of the bar is theprobability of the loss and the height of the bar is the size of loss.Probabilistic modeling can also provide information for primary or reinsurance pricing and forsetting underwriting or marketing strategies.Techniques to Locate and Prevent Dangerous ConcentrationsThe modeling process ties together the company’s exposures with the stormfrequency/severityinformation to determine the potential losses and dangerous concentrationsfor the company. The output of simulation modeling can provide a lot of useable informationbeyond the potential loss levels with their attendant likelihoods.With the introduction of computer mapping products, “pin , ?aps” have essentially been broughtback. Mapping packages can profile exposure concentrations on a county or zipcode basis94
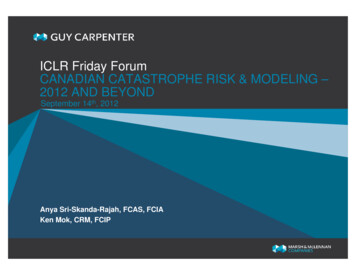
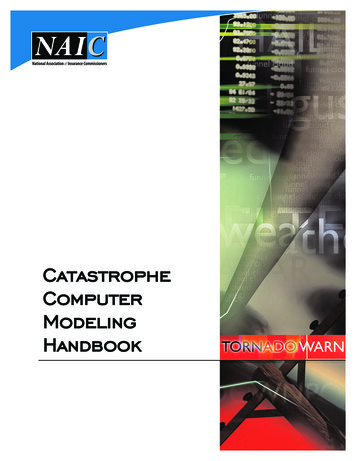
or, if necessary, show point locations. Mapping today is primarily limited by the amount ofexposure location information retained by insurance companies.Since most companies retain zipoode detail, the following section will assume this level ofdetail. Summing exposures by zipcode can be misleading, since zipcodes can varysignificantly in size. Using exposure densities solves this problem. Exposures are summed byzipcode and divided by the number of square miles within the zipcode. This tends toaccentuate those inner city zipcodes where more exposure is typically concentrated in asmaller area.Analyzing loss potentials by looking only at exposure densities can also be misleading. Lossdensities should be used. Loss densities are created by simulating a library of storms andretaining the losses on a zipoode level. The losses on a per storm basis are multiplied by theprobabilities of each event. After the losses are aggregated for all storms, the losses for azipcode are divided by the square miles within the zipcode. The loss density maps thuscombine both the exposure concentrations and the frequency and severity of catastrophicevents in that zipcode. Loss densities can also be used to determine catastrophic loss costsfor ratemaking. The maps on the next pages show an example of the exposure density andloss density maps for the northeast region for a sample insurance company.95
ExhibitExposure Density for Northeast RegionDensitiesbased 0” IpCode, CountyBoundariesiiiovedaid1i:gontop.InHighMediumI .,I
Loss Density for Northeast RegionLoss Densityper SquarenDensiliesbased on Zip Code, CountyBour&uies.?,pcode rnd County eoundanes Copylghled by GOToverlaidon top.HighMediumLowMileUlW(468)(3772)
Another graphical representation of a company’s exposures can be seen through the use of ahistogram. The histogram shows the relative loss by landfall area for a specific type of stormor return period storm. These storms could be a specific class hurricane or they could be the95th percentile storms for each area. The histogram below shows the hypothetical results forthe sample insurance company and the industry.IndustrySample Insurance Company
As can be seen from the histogram, our sample insurance company has significantly greaterexposure to a hurricane hitting central Florida than the industry.The results of the modeling can be used to help decide the most appropriate actions toaddress the problem areas.The most likely areas of action are marketing, underwriting,pricing, and reinsurance.For many companies, the focus of marketing is their agency force. They can, within limits,select where to appoint their agents, how much business they will accept from each agent,and where that business is to be located. The results of probabilistic modeling can give acompany some real help in this area. From those results, management can determine whichagents are producing business with a disproportional potential for catastrophic loss, and workwith those agents to reduce writings to acceptable levels while minimizing the effect on theagent. The company can also identify areas where new agents can more safely be appointed,so that additional writings will not exacerbate the exposure problem.Similarly, underwriting standards can be effected that discourage business in areas ofdangerous concentration, while encouraging business elsewhere. Modeling can be used toconstantly monitor the catastrophe potential in all areas of the country and to warn of growinglevels of concentration before they become a problem. It can also help test the effects ofvarious underwriting actions such as increased deductibles, policy sub-limits, and selectivepolicy non-renewals. And, it can be useful identifying those areas for more stringent individualrisk protection requirements. “Pin maps” are back!59
Reinsurance and Excess ModelingAs mentioned earlier, there was a dramatic drop in catastrophe reinsurance availabilityfollowing Hurricane Andrew. This drop was caused by fears among the reinsurers that theyhad become over-extended in catastrophe business and that they needed to better controltheir aggregate exposures. With the demise of the London Market Excess (LMX) market,there was very little retrocessional capacity to fall back upon if they wrote larger lines thanwere prudent. Therefore, the reinsurance markets cut back on their capacity.Modeling offers the ability for a reinsurance market to measure the potential exposures, so that.it can more efficiently write business while safe-guarding its assets. Models allow it tomeasure the maximum losses possible to certain events, so that it isn’t restricted merely to acertain amount of aggregate limit in an arbitrary geographic “zone”. By tying in the models tothe underwriting process, the market can determine the effect on its concentrations fromadding a contract. This ability to better measure potential losses increases the comfort of theunderwriter, thus increasing the availability in the market.Does Market Share Analysis Work?Unfortunately, current modeling for reinsurers is not as satisfying as that for primarycompanies. This is basically due to the differences in available data and additional complexityof contract conditions,Most primary companies have detailed exposure data, at least by zipcode, allowing themodeler to estimate losses at that level. However, until pscently, reinsurers have been ‘imitedto premium data by state. This necessitated a modeling approach wherein losses were first100-s/e,,.
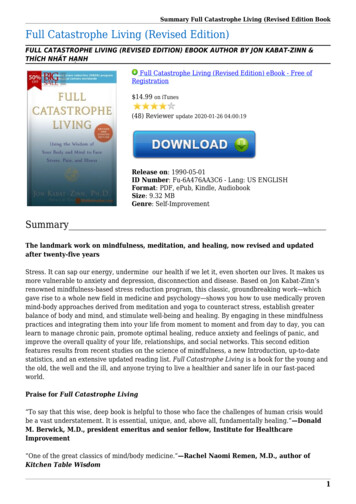
simulated for the entire insurance industry, then the individual ceding company losses wereestimated by using its market share. Exhibit Ill shows the relationship between the marketshare homeowner loss estimate and the actual loss for Hurricane Andrew. As is evident, thereis very little correlation between the two for individual companies.Market share analysis for earthquake is even more difficult since current line of businessstrucures do not clearty define whether earthquake coverage is provided. For example,personal earthquake coverage can be reported under homeowners or personal earthquake.In late 1993, exposure data by county was requested by many of the more technicalreinsurance markets. This enhanced reinsurers‘ abilities to estimate primary companies’losses, but not nearly to a level of accuracy needed to price reinsurance.Market share analysis is even less accurate when modeling excess property or large accountbusiness. A market share approach for an excess writer treats that business as ground-upbusiness, totally distorting the actual potential to the company. Similarly, large accountbusiness rarely carries accurate location information for all the buildings in a schedule. Even ifcounty exposure information is available, it is likely that the location data refers to the billinglocation rather than the risk location. This usually puts large concentrations of exposure in asmall number of locations, ignoring the real spread of risk.While market share analysis was a significant step forward in analyzing reinsurers’ losspotential, we believe that market share modeling based on county data still leaves much to bedesin-d. For instance, the differences in damages within a county for those zipcodes along thecoast versus those inland can be substantial, yet market share modeling does not differentiate101
ExhibitIIIStatewide market share Was not a good indicator oflosses-for Hurricane Andrew4.5% ,4.0%3.5% 3.0% 2.5%0.0%0.5%1.0%1.5%2.0%Share of IndustryIi i ii i2.5%Homeowner3.0%Loss3.5%4.0%4.5%
among them. This can be particularly misleading for a company with a distribution of riskswithin a county that is different from the industry distribution. Until either actual ripcodeexposures of the detailed results or the company’s own modeling are available to thereinsurance market, the information used by the most sophisticated reinsurance markets willcontinue to be inadequate to properly underwrite or price their book of business.One way to best utilize primary company modeling, is for a reinsurer or the market as a wholeto define a set of standard scenarios to be modeled against the primary company exposures.Then, the reinsurer can calculate contract losses based on contract terms to figure its portfoliolosses from each scenario. This information can help with underwriting and pricing decisionsby providing a quantitative comparison of various contracts as well as the effect of any newcontract to the portfolio. Adjustments may be necessary to compensate for differences amongthe various models used by the ceding companies.How to Model Reinsurance LossesWhile primary company loss modeling can usually be done on either a policy or aggreagatebasis, reinsurance modeling should be done only on a contract by contract basis. Combiningcontracts with different policy limits, loss limits, quota share percentages, and attachmentpoints for modeling purposes can severely distort your results.Losses should atways be calculated using the total values exposed, then limited based uponthe conditions of the reinsurance contracts. Policy limits apply to each individual risk location,whereas loss limits apply to all locations. The combinations of different contracts reduces theability to model losses appropriately.103
Compared to primary company analysis, mapping exposures is more difficult. For example,let’s assume that there are three risks covered under a 10 million excess 5 millionreinsurance contract.Risk A 3 millionPalm BeachRisk B 40 millionMiamiRisk C 12 millionAtlantaMapping the exposure to this policy could be done a number of ways. First, we could map the-full exposure for each risk. The problem with this method is it can severely overstate ther-importance of the second risk. Second, we could map the exposure inside the excess of losson a per risk basis ( 10 million for Risk B, 7 million for Risk C). The problem with this method-is that it ignores Risk A.The answer to catastrophe exposure mapping is to run the probabilistic database against allexposures under the same contract. One event could cause losses to both Risk A and Risk B.The resulting loss within the excess of loss agreement should be spread proportionately toeach risk. Unlike our first suggestion, Risk B won’t be over emphasized.Unlike our secondmapping suggestion, Risk A does pose some exposure.Models that use only mean damage factors can also distroti loss potential especially when anexcess contract is being modeled. It is posssible that using mean damage factors would resultin an estimate of no losses to an excess contract, when losses are possible. For example,let’s assume that a specific windspeed causes an average of 15% damage to a specific type of104 , .-
building. Within each estimate of damage, no matter how defined (frame conStrUCtiOn,shingled hip roof), there always exists a range of damage potential. Risks having an averageof 15% damage may consist of some risks having 5% damage and some having 75% damageIt is possible that the one risk having 75% damage may actually hit the reinsurance layer. Inmodeling reinsurance layers or when modeling a small number of risks, it is important to buildin this variation.“Payback”One of the pricing concepts in the reinsurance market is that of “payback” or “return time”.When an underwriter is considering the price he will charge for a treaty, he will determine anapproximate frequency of an event that will affect the layer in question. Thus, if he is pricing alayer 25,000,000 excess of 25000,000, he needs an idea of how often he can expect anoccurrence that will cause a loss to the ceding company of more than 25000,000.If hebelieves that such an event will happen every 5 years, and that every such event will actuallyexceed 50.000,000, he can estimate the amount that he will need to charge for the lossportion of the price. Simply put, a 25000,000 limit, with a 5 year payback, should cost 5000,000, plus provisions for expenses, risk load and profit.Catastrophe modeling can help the underwriter estimate these return times, or paybacks. Bymodeling the ceding company exposures, the reinsurer can simulate the effects of variousevents on the proposed layers to be offered. The probabilities of loss levels that will hit eachlayer c
Measuring and Managing Catastrophe Risk Ronald T. Kozlowski Stuart B. Mathewson Abstract: This paper gives a basic introduction to the standard framework behind catastrophe modeling . This article is intended to be "food for thought" and hopes to stimulate new catastrophe modeling ideas and enhancements. Biography: Ronald T. Kozlowski is .