Transcription
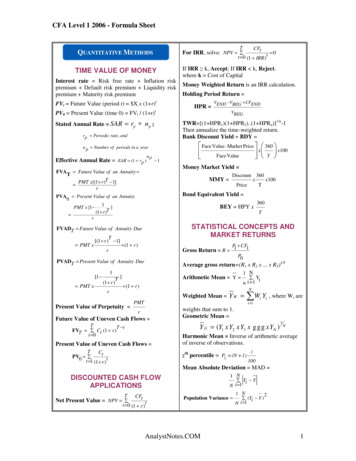
/C r i t i c a l C o n c e pt s f o r t h e 2 0 1 9ETHICAL AND IIIIII (B)V(C)VIVI(A)VI (B)VI(C)VIIVII(A)VII(B)ProfessionalismKnowledge of the Law.Independence and Objectivity.Misrepresentation.Misconduct.Integrity of Capital MarketsMaterial Nonpublic Information.Market Manipulation.Duties to ClientsLoyalty, Prudence, and Care.Fair Dealing.Suitability.Performance Presentation.Preservation of Confidentiality.Duties to EmployersLoyalty.Additional Compensation Arrangements.Responsibilities of Supervisors.Investment Analysis, Recommendations,and ActionsDiligence and Reasonable Basis.Communication with Clients andProspective Clients.Record Retention.Conflicts of InterestDisclosure of Conflicts.Priority of Transactions.Referral Fees.Responsibilities as a CFA InstituteMember or CFA CandidateConduct as Participants in CFA InstitutePrograms.Reference to CFA Institute, the CFADesignation, and the CFA Program.Global Investment Performance Standards(GIPS ) Compliance statement: “[Insert name of firm] hasprepared and presented this report in compliancewith the Global Investment PerformanceStandards (GIPS).” Compliance must be appliedon a firm-wide basis. Nine sections: fundamentals of compliance,input data, calculation methodology, compositeconstruction, disclosures, presentation andreporting, real estate, private equity, and wrapfee/separately managed account portfolios.QUANTITATIVE METHODSTime Value of Money Basics Future value (FV): amount to which investmentgrows after one or more compounding periods. Future value: FV PV(1 I/Y)N. Present value (PV): current value of some futurecash flow PV - FV/(1 I/Y)N. Annuities: series of equal cash flows that occur atevenly spaced intervals over time. Ordinary annuity: cash flow at end-oFum e. period. Annuity due: cash flow at beginning- of-time period. Perpetuities: annuities with infinite lives.PVperpetuity. PMT/(discountrate).vRequired Rate o f ReturnComponents:1. Real risk-free rate (RFR).2. Expected inflation rate premium (IP).3. Risk premium.E(R) (1 RFRreal)(l IP)(1 RP) —1C FA Approximation formula for nominal required rate:E(R) RFR IP RPMeansA rithmetic mean: sum of all observation values insample/population, divided by # of observations.Geometric mean: used when calculating investmentreturns over multiple periods or to measurecompound growth rates.Geometric mean return:YN* —1Rc [(l R1) x .x ( l R N)]/harm onic mean NNEi l , x [ ,Variance and Standard DeviationVariance: average of squared deviations from mean.N ( Xi— M)2population variance cr2 — -------------NnE (x i- x )2sample variance s2 i ln —1Standard deviation: square root of variance.Holding Period Return (HPR)RP r-P r-t D r orPt-1!Pt-1Coefficient of VariationC oefficient o f variation (C V): expresses how muchdispersion exists relative to mean of a distribution;allows for direct comparison of dispersion acrossdifferent data sets. CV is calculated by dividingstandard deviation of a distribution by the mean orexpected value of the distribution:CV XSharpe RatioSharpe ratio: measures excess return per unit of risk.c, —rP------rfbnarperatioa„Roy's safety-first ratio:Ex a mExpected return, variance o f 2-stock portfolio.E (R P) w a E(Ra ) w b E(Rb)v ar(R p) w 2 cr2 (R A) w 2cr2 (R B) 2w Aw Bcr(RA)cr(R B)p (R A,R B)Normal DistributionsN ormal distribution is completely described by itsmean and variance.68% of observations fall within I ct .90% fall within 1.65a.95% fall within 1.96a.99% fall within 2.58a.Computing Z-ScoresZ-score: “standardizes” observation from normaldistribution; represents # of standard deviations agiven observation is from population mean.z observation —population meanx —flstandard deviationaBinomial ModelsB inom ial distribution: assumes a variable can takeone of two values (success/failure) or, in the case ofa stock, movements (up/down). A binomial modelcan describe changes in the value of an asset orportfolio; it can be used to compute its expectedvalue over several periods.Sampling DistributionSampling distribution: probability distribution ofall possible sample statistics computed from a set ofequal-size samples randomly drawn from the samepopulation. The sam pling distribution o f the mean isthe distribution of estimates of the mean.Central Limit TheoremC entral lim it theorem: when selecting simplerandom samples of size n from population withmean p and finite variance a 2, the samplingdistribution of sample mean approaches normalprobability distribution with mean p and varianceequal to a 1In as the sample size becomes large.Standard ErrorStandard error o f the sample mean is the standarddeviation of distribution of the sample means.known population variance: a rpa targetFor both ratios, larger is better.Expected Return/Standard DeviationExpected return : E(X) P (x j) xnE(X) P (x1)x 1 P (x 2)x 2 . P (xn)x nProbabilistic variance : 2( x ) E p(xi ) h - E(x )f P (x1)[x1- E ( X ) f P (x2)[x2 - E ( X ) ]: . P (xn)[x „ —E ( x ) fStandard deviation: take square root of variance.Correlation and CovarianceCorrelation: covariance divided by product of thetwo standard deviations.COV (R j, Rjcorr R R: unknown population variance: s* Confidence IntervalsC onfidence interval: gives range of values the meanvalue will be between, with a given probability (say90% or 95%). With known variance, formula for aconfidence interval is:ax za llZ aJ2Z Z a lla ll1.645 for 90% confidence intervals(significance level 10%, 5% in each tail)1.960 for 95% confidence intervals(significance level 5%, 2.5% in each tail)2.575 for 99% confidence intervals(significance level 1%, 0.5% in each tail)continued on next page.
QUANTITATIVE METHODS continued.Oligopoly: Few firms that may have significantpricing power; high barriers to entry; products maybe homogeneous or differentiated.M onopoly: Single firm with significant pricingpower; high barriers to entry; advertising used tocompete with substitute products.In all market structures, profit is maximized atthe output quantity for which marginal revenue marginal cost.Null and Alternative HypothesesNull hypothesis (H{)): hypothesis that contains theequal sign ( , , ); the hypothesis that is actuallytested; the basis for selection of the test statistics.Alternative hypothesis (Ha): concluded if there issufficient evidence to reject the null hypothesis.Difference Between One- and Two-Tailed TestsO ne-tailed test: tests whether value is greater than orless than a given number.Two-tailed test: tests whether value is equal to agiven number. One-tailed test: H0: p 0 versus Ha: p 0. Two-tailed test: H0: p 0 versus Ha p * 0.Gross Domestic ProductReal GDP consumption spending investment government spending net exports.Savings, Investment, Fiscal Balance, and TradeBalanceFiscal budget deficit (G - T) excess of saving overdomestic investment (S - I) - trade balance (X - M)Type I and Type II Errors Type I error: rejection of null hypothesis when it isactually true. Type II error: failure to reject null hypothesis whenit is actually false.Equation of ExchangeMV PY, where M real money supply, V velocity of money in transactions, P price level,and Y real GDP.Types of Hypothesis TestsUse t-statistic for tests involving the populationmean (location of mean, difference in means,paired comparisons).Use chi-square statistic for tests of a singlepopulation variance.Use F-statistic for tests comparing two populationvariances.Business Cycle PhasesExpansion; peak; contraction; trough.Economic IndicatorsLeading: Turning points occur ahead of peaks andtroughs (stock prices, initial unemployment claims,manufacturing new orders)Coincident: Turning points coincide with peaksand troughs (nonfarm payrolls, personal income,manufacturing sales)Lagging: Turning points follow peaks and troughs(average duration of unemployment, inventory/sales ratio, prime rate)Technical AnalysisReversal patterns: head and shoulders, inverse H&S,double/triple top or bottom.Continuation patterns: triangles, rectangles,pennants, flags.Price-based indicators: moving averages, Bollingerbands, momentum oscillators (rate of change, RSI,stochastic, MACD).Sentim ent indicators: opinion polls, put/call ratio,VIX, margin debt, short interest ratio.Flow o f fu n d s indicators: TRIN, margin debt,mutual fund cash position, new equity issuance,secondary offerings.1ECONOMICSElasticityOwn p rice elasticityFactors Affecting Aggregate DemandConsumers’ wealth; business expectations;consumers’ income expectations; capacityutilization; monetary and fiscal policy; exchangerates; global economic growth.%A quantity demanded%A priceIf absolute value 1, demand is elastic.If absolute value 1, demand is inelastic.On a straight line dem and curve, total revenue ismaximized where price elasticity —1.%A quantity demandedIncom e elasticity%A incomeIf positive, the good is a normal good.If negative, the good is an inferior good. . . .%A quantity demandedCross p rice elasticity --------------------------------%A price of related goodIf positive, related good is a substitute.If negative, related good is a complement.Breakeven and ShutdownBreakeven: total revenue total cost.Operate in short run if total revenue is greater thantotal variable cost but less than total cost.Shut down in short run if total revenue is less thantotal variable cost.Market StructuresPerfect com petition: Many firms with no pricingpower; very low or no barriers to entry;homogeneous product.M onopolistic com petition: Many firms; somepricing power; low barriers to entry; differentiatedproducts; large advertising expense.Factors Affecting SR Aggregate SupplyInput prices; labor productivity; expectations foroutput prices; taxes and subsidies; exchange rates;all factors that affect LR aggregate supply.Factors Affecting LR Aggregate SupplySize of labor force; human capital; supply ofnatural resources; stock of physical capital; level oftechnology.Typ es of UnemploymentFrictional: time lag in matching qualified workerswith job openings.Structural: unemployed workers do not have theskills to match newly created jobs.Cyclical: economy producing at less than capacityduring contraction phase of business cycle.Policy Multipliersmoney multiplier --------------- ---------reserve requirementfiscal multiplier -------------------l- M P C (l- t)where MPC marginal propensity to consume,t tax rate.Expansionary and Contractionary PolicyM onetary p olicy is expansionary when the policyrate is less than the neutral interest rate (real trendrate of economic growth inflation target) andcontractionary when the policy rate is greater thanthe neutral interest rate.Fiscal p olicy is expansionary when a budgetdeficit is increasing or surplus is decreasing, andcontractionary when a budget deficit is decreasingor surplus is increasing.Balance of PaymentsCurrent account: merchandise and services; incomereceipts; unilateral transfers.Capital account: capital transfers; sales/purchases ofnonfinancial assets.Financial account: government-owned assetsabroad; foreign-owned assets in the country.Regional Trading AgreementsFree trade area: Removes barriers to goods andservices trade among members.Customs union: Members also adopt common tradepolicies with non-members.Common market: Members also remove barriers tolabor and capital movements among members.Economic union: Members also establish commoninstitutions and economic policy.M onetary union: Members also adopt a commoncurrency.Foreign Exchange RatesFor the exam, FX rates are expressed as p ricecurrency / base currency and interpreted as thenumber of units of the price currency for each unitof the base currency.Real Exchange Rate nominal FX rate Xbase currency CPIprice currency CPI yNo-Arbitrage Forward Exchange Rateforward 1 price currency interest ratespot1 base currency interest rateExchange Rate RegimesFormal dollarization: country adopts foreigncurrency.M onetary union: members adopt common currency.Fixed p eg: 1% margin versus foreign currency orbasket of currencies.Target zone: Wider margin than fixed peg.Crawling p eg: Pegged exchange rate adjustedperiodically.Crawling bands: Width of margin increases overtime.M anaged floating: Monetary authority acts toinfluence exchange rate but does not set a target.Independently floating: Exchange rate is marketdetermined.F in a n c ia l.ANALYSISr e p o r t in g a n dRevenue RecognitionTwo requirements: (1) completion of earningsprocess and (2) reasonable assurance of payment.Revenue Recognition Methods Percentage-of-completion method. Completed contract method. Installment sales. Cost recovery method.Converged Standards Issued May 2 0 14Five-step revenue recognition model:1. Identify contracts2. Identify performance obligations3. Determine transaction price4. Allocate price to obligations5. Recognize when (as) obligations are satisfiedUnusual or Infrequent Items Gains/losses from disposal of a business segment. Gains/losses from sale of assets or investments insubsidiaries. Provisions for environmental remediation.continued on next page.
FINANCIAL REPORTING AND ANALYSIS continued. Impairments, write-offs, write-downs, andrestructuring costs. Integration expenses associated with businessesrecently acquired.Discontinued OperationsTo be accounted for as a discontinued operation, abusiness—assets, operations, investing, financingactivities— must be physically/operationally distinctfrom rest of firm. Income/losses are reported net oftax after net income from continuing operations.Compute Cash Flows From Operations (CFO)D irect m ethod : start with cash collections (cashequivalent of sales); cash inputs (cash equivalent ofcost of goods sold); cash operating expenses; cashinterest expense; cash taxes.Indirect m ethod: start with net income, subtractingback gains and adding back losses resul
90% or 95%). With known variance, formula for a confidence interval is: x z a all ZaJ2 Z all Z all 1.645 for 90% confidence intervals (significance level 10%, 5% in each tail) 1.960 for 95% confidence intervals (significance level 5%, 2.5% in each tail) 2.575 for 99% confidence intervals (significance level 1%, 0.5% in each tail)