Transcription
Yakima Basin Beaver Reintroduction Project2011- 2015 Progress ReportEllensburg, WashingtonPrepared by:Melissa BabikProject Manager/ Wildlife BiologistMid-Columbia Fisheries Enhancement Group&William MeyerHabitat BiologistYakima Basin Integrated Water Resources PlanWashington Department of Fish and Wildlife
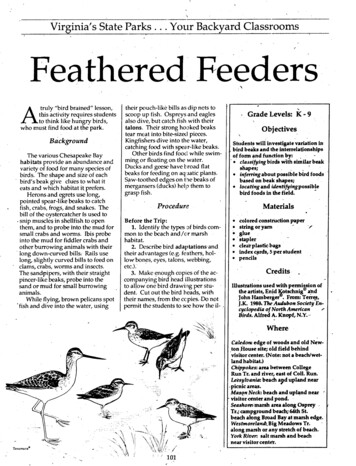
AbstractAn effort was made to inform over 33,000 local residents about the benefits of beavers viapresentations, festivals, newsletters, and interviews with media. Between 2011 and 2015 thisproject has acquired 358,139 in grant funding and has acquired 292,986 in match with over4,820 volunteer hours. To track nuisance complaints, a spread sheet was constructed loggingcommunication with over 150 land owners and managers. The installation of 3 pond levelers, 2beaver deceivers, 2 beaver dam analogues, and fencing around dozens of trees occurred onmultiple properties in Kittitas and Yakima counties. Four holding tanks were assembled onYakama Nation property complete with cinderblock lodges, flowing water, and shade for thebeavers. Protocols were established and improved for trapping, transporting, safe handling,equipment and facility sterilization, disease prevention, sexing, ear tagging, PIT tagging,feeding, and relocating beavers. Relocation sites were evaluated for food availability, cover,stream gradient, water flow, and resident beaver populations. Snares and Hancock traps weremodified for better success and safety of captured animals. Beaver reintroductions weremonitored for success and found that 16 of the 45 colonies were successfully establishedbetween 2011 and 2014. PIT tag arrays detected 17 of the 161 relocated beavers moving todifferent regions of the watershed. PIT tags are not an effective tool for monitoring beavermovement but they are able to suggest that beaver that leave a reintroduction site may still beperforming ecological restoration on the landscape years later. This project documented 26new dams, 24 pools, and 24.6 million gallons of water stored in 2015. Data suggests the longera beaver colony persists the more stream complexity they create.Project AreaTarget watersheds include: the Teanaway River, Swauk Creek, Manastash Creek, Taneum Creek,Yakima River, and their tributaries (figure 1).
Figure 1: Map of the Upper Yakima Focus WatershedsWork DescriptionThe goals of the Yakima Basin Beaver Reintroduction Project are to relocate “problem beavers”from urban and agricultural areas in the lower and mid Yakima Basin, where they are currentlybeing lethally removed, and re-establish them in upper Yakima River tributaries to enhancewatershed function. Nuisance beavers will be used as a tool to restore riparian habitat, increasestream complexity, attenuate flows, recharge underground aquifers, and adapt to climatechange impacts.Objective 1: Provide outreach and education to local school districts, communities, privatelandowners, and local agencies on ways beavers restore riparian function and are an essentialkeystone species.An effort was made to inform over 33,000 local residents about the benefits of beavers viapresentations, festivals, newsletters, and interviews with the media. The project has beendocumented by a free-lance videographer, a web designer, and public broadcastingorganizations. The project was featured on the Canadian Broadcast Corporation, NationalPublic Radio, the Associated Press, and in several local papers. This project has presented at theWashington State Beaver Workshop, The Methow Beaver Relocation Workshop, The Salmon
Recovery Conference, The Yakima Basin Science and Management Conference, and hosts theWashington Beaver Working Group meetings. In November 2012, Washington Department ofFish and Wildlife and Mid-Columbia Fisheries hosted a stake holder’s meeting to discuss newlegislation, integrate beaver relocation projects with interested parties, and to discuss ways tostreamline permitting .Figure 2: Melissa Babik performing outreach atYakima Arboretum Children’s Camp.Figure 3: Melissa Babik hosting a field trip to thecaptive beaver facility.Objective 2: Hire a crew to track and respond to nuisance beaver reports.A spreadsheet was compiled with over 150 land owners and managers experiencing problemswith resident beaver populations. Concerns included cutting down trees, blocking culverts,flooding adjacent property, and damming of irrigation water. A crew of 2-3 seasonal biologistsand a project manager responded to nuisance complaints between June and October from2011-2015.Objective 3: Set up a holding facility and care for captive beavers.The Yakama Nation donated four large metal fish tanks to the project to serve as a captiveholding facility for nuisance beavers prior to their reintroduction. The tanks were positioned onYakama Nation property and were outfitted with A-frame metal shade canopies, cinder block /plywood lodges, food dishes, and irrigation plumbing (figures 4-6). Water level was kept atapproximately 3 – 3.5 feet deep with artificial lodges elevated above the water mimicking a drybeaver lodge. Crews worked to minimize weight loss by modifying housing and feedingtechniques. Beavers were fed dry rodent pellets, apples, and aspen cuttings.
Figure 4: Captive Holding FacilityFigure 5: Kit leaving lodgeFigure 6: Lodge with rodent pelletsObjective 4: Purchase and modifying live traps, transport cages, and snares.Crews gathered 11 Handcock traps and replaced the springs as they weakened. They outfittedthree Havahart traps with plywood bottoms. They modified snares by placing deer stops, largerswivels, and thicker diameter cable to reduce injury to animals.Figure 7: Beaver in Hancock live trapFigure 8: Beaver in Havaharttrap.Figure 9: Kevlar bag for safelyhandling beavers.Figure 10: Snares (upper snare is old version with smaller clasp; lower snare is modified with a larger clasp.)Objective 5: Evaluate relocation sites for food availability, cover, stream gradient, water flow,and resident beaver populations.Tributaries were assessed by walking stretches of river noting beaver presence, abiotic andbiotic characterizes. Criteria for a suitable relocation site required a surplus of deciduousvegetation, low in-stream gradient, continuous flow, presence of deep pools, a wide floodplain,permission from the land owner, and a lack of resident beavers. Each potential site was scoredwith a numerical value representing its suitability for beaver reintroduction.
Objective 6: Develop and improve protocols for trapping, transporting, safe handling, sexing,ear tagging, PIT tagging, feeding, temporary lodge construction, and relocating beavers.PIT tags are inserted into the upper left rear thigh of the beaver to detect movementthroughout the watershed. Silver metal ear tags were used to detect recapture. Safe Handlingprocedures and protocols were established for equipment sterilization and disease prevention.Objective 7: Work with landowner to mitigate threats to property by managing beavers inplace or trapping.Beavers often become problematic in urban and agricultural areas. Typically these problemscan be addressed by installing a pond leveler (figure 10), beaver deceiver (figure 11), or byprotecting vegetation with fencing or a sand/paint mixture (figure 12). Land managers arebriefed on the various tools used to manage beaver populations on-site and the requiredmaintenance of each tool. This project has installed three pond levelers, two beaver deceivers,and painted dozens of trees in Kittitas and Yakima counties.Figure 10: Flexible Pond Leveler,Figure 11: Beaver DeceiverFigure 12: Protecting treesObjective 8: Relocate Nuisance Beaver.One hundred and sixty one beavers were relocated to headwater tributaries between 2011 and2015. Beaver families and single beavers paired up with an unrelated mate were transported toheadwater relocation sites (figure 13). In efforts to ease predation pressures, a temporary lodgewas constructed out of logs, branches, and mud (figure 14). The beavers’ nest box chips wereadded to initiate a homing instinct. A deciduous food cache was left to ease predationpressures as the beavers explore their new surroundings in search of food sources.
Figure 13: Relocating a beaverFigure 14: Temporary LodgeFigure 15 depicts areas were beavers were trapped and relocated. Notice the hot spots forbeaver conflicts are in urban areas. Capture sitesN Release sites PIT Tag arrayWESEllensburgYakimaTri-CitiesFigure 15: Trap and release locations as well as PIT tag array placement.
Objective 9: Monitor relocated beaver colonies.SuccessThis project conservatively identifies success by demonstrating that relocated beavers remainat or near a location for at least one year and construct/maintain beaver built infrastructure(dam, lodge, bank den). Trail cameras, visual surveys, delivering food caches, and PIT tag arraysare all useful tools in monitoring beaver presence. However, these tools cannot determine thenumber of beavers successfully reintroduced; they can only show that a site is occupied by atleast one beaver. Sixteen of the 45 colonies relocated between 2011 and 2014 were classifiedas successful. Results from 2015’s efforts will not be evaluated until summer of 2016.Table 1: Success metrics of beaver introduction 2011-2015Trapped Beavers180Escaped Captive Facility7Died in CaptivityReturned to colony or moved shortdistanceRelocated BeaversSuccessfully relocated colonies 2011Successfully relocated colonies 2012Successfully relocated colonies 2013Successfully relocated colonies 2014Successfully relocated colonies 2015Total colony success 2011-20143 adults, 3 kits, 1 juvenile3 kits, and a pair1613 out of 54 out of 115 out of 184 out of 11Unknown until 201616 out of 45 relocated colonies successfulOf the 161 beavers reintroduced between 2011 and 2015, 17 were documented on PIT tagarrays dispersing from the relocation site. One beaver was found to survive and migrate morethan 40 miles across the watershed 983 days post a successful reintroduction. This shows thatunsuccessful beaver relocations can still be performing ecological restoration in the watershedyears after relocation.Data show that monitoring beaver movement through PIT tags is not effective as beaver havebeen documented to travel undetected through PIT tag arrays. Beavers were documentedmoving both upstream and downstream from their relocation site and were found travelingwithout family members. Both related and unrelated beavers were shown abandoning theirrelocation partner at a relocation site. Data also suggests that site abandonment is not alwaysindicative of that site being of poor quality. One year a site can be accepted by relocatedbeavers whereas another year it may be rejected.
Objective 10: Monitor stream complexity.A goal of this project was to increase stream complexity. Table 2 depicts monitoring resultsfrom 2015 and ways this project increased stream complexity.Table 2: Increase of stream complexityGauge of ComplexityYBP’s measurement of increasing streamcomplexity in 2015Hydraulic retentionStored 24.6 million gallons of waterInstream structure (LWD)26 new beaver dams created24 new pools createdPond/pool circumferences varied from 5m² Large Pool Volumes1271 m².Pool depth varied from 0.3m – over waistEdge Habitat26 new beaver dams increased edge habitatand cover for juvenile fish by 365m.Floodplains connected overland flowYesSide Channels createdYesLength of beaver created habitat varied from60m to 850m of stream length.Number of dams (LWD) / colony varied fromHabitat heterogeneity1-7 dams.Pool depth varied from 0.3m – over waistPond/pool circumference varied from 5m² 1271 m².** Sample was 11 beaver colonies in 2015.** Longer beaver colonies persisted on the landscape the more complexity they created.An estimate of the groundwater storage was calculated from Pollock et al., (2003) as follows:Number of successful sites * Average pond surface area per site (m2/site) * infiltration rate (m/s)*number of days of infiltration * conversion factor volume of groundwater storage (m3/yr)11 * 670.3 m2 * 0.0000004 *365 * 86,400 93,008 m3/yr 93 million liters/yr 24.6 milliongallons/ yrWhere:Number successful sites in 2015 11sitesAverage pond surface area/successful site 670.3 m2/siteInfiltration rate 0.0000004 m/sec (Pollock et al., 2003)Number of days of infiltration 365 days (ponds are observed to have water year-round)Conversion factor 86,400 (converting from per seconds to days)
The estimated water storage for the 11 sites equals 24.6 million gallons per year. It must be noted thatthese measured benefits are only depicting the 11 colonies that were deemed still successful in 2015.Other sites may have been created that go undetected. Additionally, beaver colonies are dynamic anddecrease with normal attrition (predation, trapping, harsh winters, or disease) and increase withreproduction and dispersion. 12 million gallons of water storage translates to 0.05 CFS in streamvelocity.Figure 16: Beaver relocation site along the North Fork Manastash after 3 years of success.Lessons learned:1. Beavers can pass PIT tag arrays traveling upstream or downstream without detectionand lose ear tags making it difficult to evaluate successful reintroduction.2. Monitoring efforts can only detect if a site is occupied by at least one beaver it cannotshow individual beaver retention or abandonment.3. Data shows reproduction of relocated beaver.4. Antidotal evidence shows offspring dispersal from reintroduced parents.5. Site abandonment is not always indicative of that site being of poor quality.6. Beavers do not always remain or disperse from a site together. Our data showsinstances of both related and unrelated beavers abandoning their relocation partner ata relocation site.7. The longer a beaver colony persists the more complexity it brings to the watershed.
Project Match: 2011-2015AffiliationYakama Captive Holding FacilityField Truck and Staff TimeEducational Outreach & SuppliesEducational OutreachTrapping, Relocating, and MonitoringCWUOtherTotalHandcock trapsSuppliesTotal 140,530 47,945 18,494 5,729 69,600 10,000 670 292,968
4,820 volunteer hours. To track nuisance complaints, a spread sheet was constructed logging communication with over 150 land owners and managers. The installation of 3 pond levelers, 2 beaver deceivers, 2 beaver dam analogues, and fencing around dozens of trees occurred on multiple properties in Kittitas and Yakima counties.