Transcription
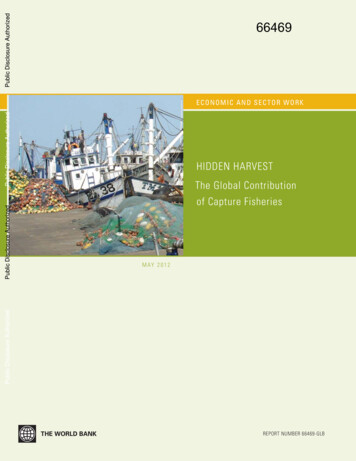
Public Disclosure Authorized66469HIDDEN HARVESTThe Global Contributionof Capture FisheriesM AY 2 0 1 2Public Disclosure AuthorizedPublic Disclosure AuthorizedPublic Disclosure AuthorizedECONOM IC AND SECTOR WOR KREPORT NUMBER 66469-GLB
ECONOMIC AND SECTOR WORKHIDDEN HARVESTThe Global Contribution of Capture FisheriesREPORT NO. 66469-GLB
2012 International Bank for Reconstruction and Development / International Development Association orThe World Bank1818 H Street NWWashington DC 20433Telephone: 202-473-1000Internet: www.worldbank.orgThis volume is a product of the staff of the International Bank for Reconstruction and Development/The World Bank. Thefindings, interpretations, and conclusions expressed in this paper do not necessarily reflect the views of the ExecutiveDirectors of The World Bank or the governments they represent.The World Bank does not guarantee the accuracy of the data included in this work. The boundaries, colors, denominations,and other information shown on any map in this work do not imply any judgment on the part of The World Bank concerningthe legal status of any territory or the endorsement or acceptance of such boundaries.Rights and PermissionsThe material in this work is subject to copyright. Because The World Bank encourages dissemination of its knowledge, thiswork may be reproduced, in whole or in part, for noncommercial purposes as long as full attribution to this work is given.Any queries on rights and licenses, including subsidiary rights, should be addressed to the Office of the Publisher, TheWorld Bank, 1818 H Street NW, Washington, DC 20433, USA; fax: 202-522-2422; e-mail: pubrights@worldbank.org.Cover Photo: Michael Arbuckle
IIICONTENTSTable ofCONTENTSList of Tables . . . . . . . . . . . . . . . . . . . . . . . . . . . . . . . . . . . . . . . . . . . . . . . . . . . .vList of Boxes . . . . . . . . . . . . . . . . . . . . . . . . . . . . . . . . . . . . . . . . . . . . . . . . . . . . viiList of Figures . . . . . . . . . . . . . . . . . . . . . . . . . . . . . . . . . . . . . . . . . . . . . . . . . . . viiAbbreviations and Acronyms . . . . . . . . . . . . . . . . . . . . . . . . . . . . . . . . . . . . . . . . . . ixForeword . . . . . . . . . . . . . . . . . . . . . . . . . . . . . . . . . . . . . . . . . . . . . . . . . . . . . . xiAcknowledgments . . . . . . . . . . . . . . . . . . . . . . . . . . . . . . . . . . . . . . . . . . . . . . . . xiiiTerminology as Used in This Report. . . . . . . . . . . . . . . . . . . . . . . . . . . . . . . . . . . . . . xvExecutive Summary . . . . . . . . . . . . . . . . . . . . . . . . . . . . . . . . . . . . . . . . . . . . . . . . . . xviiApproach . . . . . . . . . . . . . . . . . . . . . . . . . . . . . . . . . . . . . . . . . . . . . . . . . . . . . .xviiKey Findings . . . . . . . . . . . . . . . . . . . . . . . . . . . . . . . . . . . . . . . . . . . . . . . . . . . . xviiiConclusions . . . . . . . . . . . . . . . . . . . . . . . . . . . . . . . . . . . . . . . . . . . . . . . . . . . . . xixChapter 1: Introduction . . . . . . . . . . . . . . . . . . . . . . . . . . . . . . . . . . . . . . . . . . . . . . . . . 1Chapter 2: Estimating the Economic Contribution of Global Capture Fisheries . . . . . . . . . .32.1 Disaggregating Small- and Large-Scale Commercial Capture Fisheries . . . . . . . . . . . . . . . . .32.2 Case Study Methods . . . . . . . . . . . . . . . . . . . . . . . . . . . . . . . . . . . . . . . . . . . . . .62.3 Uncovering the Hidden Harvests of Subsistence Fisheries . . . . . . . . . . . . . . . . . . . . . . . .112.4 Estimating the Economic Contribution of Recreational Fisheries . . . . . . . . . . . . . . . . . . . . .122.5 Estimating the Extended Global GDP Contribution of Commercial CaptureFisheries along the Value Chain . . . . . . . . . . . . . . . . . . . . . . . . . . . . . . . . . . . . . . . .15Chapter 3: Results . . . . . . . . . . . . . . . . . . . . . . . . . . . . . . . . . . . . . . . . . . . . . . . . . . .213.1 The Global Profiles of Small- and Large-Scale Commercial Fisheries . . . . . . . . . . . . . . . . . . .213.2 Small- and Large-Scale Fisheries in the Sampled Countries . . . . . . . . . . . . . . . . . . . . . . . .253.3 Supplementary Data . . . . . . . . . . . . . . . . . . . . . . . . . . . . . . . . . . . . . . . . . . . . . .343.4 The Hidden Harvest of Subsistence Fisheries . . . . . . . . . . . . . . . . . . . . . . . . . . . . . . . .353.5 Recreational Fisheries . . . . . . . . . . . . . . . . . . . . . . . . . . . . . . . . . . . . . . . . . . . . .383.6 The Contribution of Commercial Fisheries to GDP . . . . . . . . . . . . . . . . . . . . . . . . . . . . .39Chapter 4: Implications for Decision Makers . . . . . . . . . . . . . . . . . . . . . . . . . . . . . . . . . 434.1 Recommendations . . . . . . . . . . . . . . . . . . . . . . . . . . . . . . . . . . . . . . . . . . . . . . .45Bibliography . . . . . . . . . . . . . . . . . . . . . . . . . . . . . . . . . . . . . . . . . . . . . . . . . . . . . . .47Annex: Data Sources and Notes for GDP Calculations . . . . . . . . . . . . . . . . . . . . . . . . . . . 55A.1 Notes on Data Sources . . . . . . . . . . . . . . . . . . . . . . . . . . . . . . . . . . . . . . . . . . . . .EC O N O M I C A N D S E CT OR WORK55
LI S T O F TA B L E SList ofTABLESTable 2.1: Example Definitions of Small-Scale Marine Fisheries from Developing Country Case Studies . . . 4Table 2.2: Generic Characteristics of Categories of Fisheries. . . . . . . . . . . . . . . . . . . . . . . . . . . . 5Table 2.3: Estimated Expenditures on Fishing Tackle in Relation to Total Angler Expenditures . . . . . . . . 13Table 2.4: Recreational Fishing Gear Trade Classification Code . . . . . . . . . . . . . . . . . . . . . . . . . 13Table 2.5: Estimated Global Number of Anglers . . . . . . . . . . . . . . . . . . . . . . . . . . . . . . . . . 14Table 2.6: Global Expenditures on Recreational Fishing Tackle . . . . . . . . . . . . . . . . . . . . . . . . . 15Table 2.7: U.S. Expenditures on Fishing Equipment by Type, 2006 . . . . . . . . . . . . . . . . . . . . . . . 15Table 2.8: Selected Information Sources for Recreational Fisheries Contribution . . . . . . . . . . . . . . . 15Table 2.9: Summary of Information Sources for Fisheries GDP . . . . . . . . . . . . . . . . . . . . . . . . . 20Table 3.1: Global Profile of Small- and Large-Scale Fisheries . . . . . . . . . . . . . . . . . . . . . . . . . . 22Table 3.2: Small- and Large-Scale Fisheries in Developing Countries . . . . . . . . . . . . . . . . . . . . . . 22Table 3.3: Small- and Large-Scale Fisheries in Developed Countries . . . . . . . . . . . . . . . . . . . . . . 23Table 3.4: Employment in Capture Fisheries in Developing Countries, by Continent (thousands) . . . . . . 23Table 3.5: Results from Developed Countries (thousands) . . . . . . . . . . . . . . . . . . . . . . . . . . . . 24Table 3.6: Catch Used for Local Human Consumption . . . . . . . . . . . . . . . . . . . . . . . . . . . . . . 24Table 3.7: Discard Rates in Developing and Developed Countries . . . . . . . . . . . . . . . . . . . . . . . . 24Table 3.8: Summary of Developing Country Case Studies . . . . . . . . . . . . . . . . . . . . . . . . . . . . 25Table 3.9: Summary of Developed Country Sample . . . . . . . . . . . . . . . . . . . . . . . . . . . . . . . 26Table 3.10: Full- and Part-Time Fishing and Postharvest Employment in the Case Study DevelopingCountries (thousands) . . . . . . . . . . . . . . . . . . . . . . . . . . . . . . . . . . . . . . . . . 27Table 3.11: Estimated Employment in Developed Countries (thousands). . . . . . . . . . . . . . . . . . . . 28Table 3.12: Women in Fisheries Workforce in Developing Countries . . . . . . . . . . . . . . . . . . . . . . 28Table 3.13: Women in Fisheries Workforce in Developed Countries. . . . . . . . . . . . . . . . . . . . . . . 29Table 3.14: Reported and Estimated Catches in Inland Capture Fisheries (thousand tons) . . . . . . . . . . 29Table 3.15: Fish Production in the Sampled Countries (million tons) . . . . . . . . . . . . . . . . . . . . . . 30Table 3.16: Comparison of Apparent per Capita Fish Consumption in theLower Mekong Basin (kg/capita/yr) . . . . . . . . . . . . . . . . . . . . . . . . . . . . . . . . . . 30EC O N O M I C A N D S E CT OR WORKV
VILIST OF TA B LESTable 3.17: Catch per Ton of Fuel . . . . . . . . . . . . . . . . . . . . . . . . . . . . . . . . . . . . . . . . . 32Table 3.18: Fuel Efficiency Estimates: Examples from Developing Country Marine Fisheries . . . . . . . . . 32Table 3.19: Catch per Ton of Fuel Consumed in Fisheries in the Northeast United States . . . . . . . . . . . 33Table 3.20: Fuel Costs as Share of Revenue from Fish Landed . . . . . . . . . . . . . . . . . . . . . . . . . 33Table 3.21: Profile of World Fisheries in 1980: The Thomson Table . . . . . . . . . . . . . . . . . . . . . . . 34Table 3.22: Comparative Results of Previous Studies . . . . . . . . . . . . . . . . . . . . . . . . . . . . . . 35Table 3.23: Comparison of Vietnam Fish Production Case Studies (million tons) . . . . . . . . . . . . . . . 38Table 3.24: Estimated Participation in Vietnam Inland Fisheries under Alternative Scenarios (millions) . . . 38Table 3.25: Estimated Total Expenditures on Recreational Fishing for 2009 ( million) . . . . . . . . . . . . 39Table 3.26: Contribution from the Fisheries Harvest Subsector to National GDP (%) . . . . . . . . . . . . . 40Table 3.27: VARs for Fisheries Subsectors in Developing Countries in the Pacific . . . . . . . . . . . . . . . 41Table 3.28: Value Chain Analysis for Lake Victoria Nile Perch . . . . . . . . . . . . . . . . . . . . . . . . . . 41Table A.1: Postharvest Share of Fisheries GDP for 21 Sample Countries . . . . . . . . . . . . . . . . . . . . 57Table A.2: Calculation of Mean and Median Fisheries Sector GDPs Based on 128 Countries . . . . . . . . . 57Table A.3: Base Data and Data Sources Used to Estimate Extended Fisheries Sector GDP . . . . . . . . . . 58Table A.4: Estimated Extended Fisheries Sector GDP (proportion and millions) . . . . . . . . . . . . . . . 64Table A.5: Fisheries Sector Multipliers . . . . . . . . . . . . . . . . . . . . . . . . . . . . . . . . . . . . . . . 67Table A.6: Examples of Supply-Driven Multipliers . . . . . . . . . . . . . . . . . . . . . . . . . . . . . . . . 69H ID D EN H A RV ES T
LI S T O F B O X E SList of:BOXESBox 2.1: The Case for Separate Consideration of Small-Scale Fisheries. . . . . . . . . . . . . . . . . . . . . . 6Box 2.2: The Code of Conduct and Small-Scale Fisheries . . . . . . . . . . . . . . . . . . . . . . . . . . . . . 7Box 2.3: Key Features of Case Study Methods . . . . . . . . . . . . . . . . . . . . . . . . . . . . . . . . . . . 8Box 2.4: Subsistence Fishing in Bangladesh. . . . . . . . . . . . . . . . . . . . . . . . . . . . . . . . . . . . 12Box 2.5: Calculation of GDP. . . . . . . . . . . . . . . . . . . . . . . . . . . . . . . . . . . . . . . . . . . . . 16Box 2.6: Classification of Fisheries-Related Activities in the System of National Accounts . . . . . . . . . . 17Box 3.1: Inland Fisheries in Cambodia . . . . . . . . . . . . . . . . . . . . . . . . . . . . . . . . . . . . . . . 27Box 3.2: Defining Bycatch and Discards . . . . . . . . . . . . . . . . . . . . . . . . . . . . . . . . . . . . . . 34Box 3.3: Bycatch Collection in Mozambique . . . . . . . . . . . . . . . . . . . . . . . . . . . . . . . . . . . . 34Box 3.4: Subsistence Fishing in Thailand . . . . . . . . . . . . . . . . . . . . . . . . . . . . . . . . . . . . . 35List of:FIGURESFigure 3.1: Income from Fisheries in Bangladesh by Income Group . . . . . . . . . . . . . . . . . . . . . . 36Figure 3.2: Bangladesh Fish Consumption by Rural and Urban Poor and Nonpoor . . . . . . . . . . . . . . 37EC O N O M I C A N D S E CT OR WORKV II
IXABB R E V I AT I O N S A ND ACRONYMSABBREVIATIONS AND ACRONYMSDANIDADanish International Development AgencyMRCMekong River CommissionEUEuropean UnionNASNational Accounts StatisticsFAOFood and Agriculture Organization of theUnited NationsNMFSNational Marine Fisheries ServiceNZNew ZealandOECDOrganization for Economic Cooperation andDevelopmentFCPFishery Country Profile (FAO publication)GDPGross domestic productGGPGross geographical productPROFISHGlobal Partnership on FisheriesGPPGross provincial productSFLPSustainable Fisheries Livelihoods ProgrammeGTGross tonnageSINTEFHIESHousehold Income and Expenditure SurveyStiftelsen for industriell og teknisk forskning;The Norwegian Foundation for Scientific andIndustrial ResearchHPHorsepowerSNASystems of National AccountsIFADInternational Fund for AgriculturalDevelopmentSUMASupport for Brackish Water and MarineAquaculture project (DANIDA, Vietnam)IFREMERL’Institut Français de Recherche pourl’Exploitation de la MerUKUnited KingdomISICInternational Standard Industrial Classificationof All Industrial ActivitiesUNUnited NationsU.S.United States of AmericaVARValue-added ratioIUUIllegal, unreported and unregulated (fishing)UNITS OF MEASURE U.S. dollarton(s)metric ton(s)NOKNorwegian kronerTT Trinidad dollarEC O N O M I C A N D S E CT OR WORK
FO R E W O R DFOREWORDThe important contribution of fisheries to human well-being is frequently underestimated. This report highlights thatcontribution.Not only do fisheries generate employment for millions, but fish provides vital nutrition to billions of people and is essentialto the diet of the poor in many countries. About half of those working in the fisheries sector are women, mostly engaged inmarketing and processing. However, the foundations of this natural bounty, this infinite cash flow, are threatened by overexploitation, pollution, and habitat loss. This study strengthens the case for investment in sustainable fisheries and improvementof fisheries and aquatic environmental governance.The report focuses on small-scale fisheries and developing countries because the livelihoods of 90 percent of the 120 millionemployed in fisheries are in the small-scale fisheries, and almost all of those workers, 97 percent, live in developing countries.Many small-scale fishing communities have high levels of poverty, and poverty reduction is a core focus of the contributingpartners to the report.Raising awareness of the importance of small-scale fisheries is particularly relevant, not only because these livelihoods depend on sustainable use of the natural resource base, but also because these fisheries provide vital local nutritious food and asafety net for many poor households in coastal communities in developing countries. In developing countries, these fisheriesalso underpin the social fabric of many communities.Because of their concentrated and largely urban base and their visibility as an important earner of foreign exchange, largescale fisheries have been the target of considerable management efforts. Because of their variety, dispersion, and socialcomplexity, small-scale fisheries are often poorly documented and poorly regulated, and many of the complex managementissues remain largely unresolved. At a time when fisheries resources are increasingly depleted and climate change poses agrowing threat, failure to effectively address the issues confronting small-scale fisheries places the livelihoods of millions ofpeople at risk. By quantifying the global economic and social footprint of fisheries, this study calls for increased attention toissues facing both large- and small-scale fisheries.The report compiles information from case studies on countries representing over half of the world’s fish workers and drawson a range of published information to provide a global picture of capture fisheries from a largely social and economic perspective. It presents an estimate of the contribution of the fisheries sector to the gross domestic product, including recreationalfishing and postharvest activities, and highlights the importance of subsistence fishing.The report is the result of a collaborative effort by Food and Agriculture Organization of the United Nations (FAO), theWorldFish Center, and the World Bank’s Global Program on Sustainable Fisheries (PROFISH).EC O N O M I C A N D S E CT OR WORKXI
ACK N O W L E D G ME NT SACKNOWLEDGMENTSThis report was made possible through the contributions and support of many experts.Kieran Kelleher is the former Fisheries Team Leader at the World Bank. He prepared the overall terms of reference for thestudy, proposed the methodology for raising the gross domestic product (GDP) estimates to the global level, prepared therecreational fisheries component, and drafted the report.Lena Westlund (World Bank and Food and Agriculture Organization of the United Nations [FAO] consultant) synthesized thecountry case study materials, drafted the background study on the relative contributions of large- and small-scale fisheries,and undertook the initial estimates of their respective global contributions.Eriko Hoshino (World Bank consultant) assisted by Glen-Marie Lange (Senior Environmental Economist, World Bank), KieranKelleher, and Petter Jern (FAO), prepared the background study to estimate the contribution of capture fisheries to global GDP.David Mills (WorldFish Center), a member of the initial study design team, prepared the background study on subsistencefisheries and coordinated the country case studies prepared by WorldFish, supported by Yumiko Kura and David Walfoort.David Mills applied the term hidden harvest to fisheries in the context of the subsistence case studies.Rolf Willmann and Gejan de Graaf were members of the initial study design team; they coordinated the preparation of FAOexecuted case studies and were supported by Felix Marttin, Daniela Kalikoski, Marc Taconet, and Shunji Sugiyama.Randall Brummett, Senior Fisheries Specialist at the World Bank, edited the text.The authors wish to thank and acknowledge the valuable contributions to the developing country case studies made by thefollowing individuals and their organizations: I. Adikwu (Nigeria); L. I. Braimah (Ghana); M. Démé (Senegal); L. Garces and N.Salayo (Philippines); D. Lymer, S. Funge-Smith, P. Khemakorn, and N. Sukumasavin (Thailand); S. Koeshendrajana, L. Adrianto,T. Trihartono, and E. Anggraini (Indonesia); J. Kurien (India); A. M. Menezes (Mozambique); N. V. Nghia, B. V. Hanh, and P. G.Hai (Vietnam); M. G. Mustafa and H. Bose (Bangladesh); N. Thuok, P. Somany, S. Kao, and D. Thomson (Cambodia); M. vander Knaap (Lake Victoria–Kenya, Tanzania, and Uganda); G. Velasco Canziani (Brazil); and X. Yingliang (China). The extensiveresearch and data analysis on developed country fisheries by Pavel Salz (FAO consultant) is gratefully acknowledged, and theauthors wish to thank the following experts for assistance with data collection and interpretation of information for specificcountries and subject matters: L. Sonsini (Department of Fisheries and Oceans, Canada), M. Boudreau (Statistics, Canada),R. Gillett (Asian Development Bank consultant), A. Kitts (National Oceanic and Atmospheric Administration United States[NOAA]), M. Sandberg (Stiftelsen for industriell og teknisk forskning; The Norwegian Foundation for Scientific and IndustrialResearch (SINTEF), Norway), and S. Vannuccini (FAO).The invaluable advice and inputs provided by the following people are gratefully acknowledged: C. Barlow (Mekong RiverCommission [MRC]), S. Funge-Smith (FAO), M. Akester (Danish International Development Agency [DANIDA] Support forBrackish Water and Marine Aquaculture project), A. Poulsen (DANIDA Strengthening of Capture Fisheries Management Project),K. Hortle (consultant/MRC), H. Båge (FAO), F. Chopin (FAO), B. Kuemlangan (FAO), S. Siar (FAO), M.-C. Badjeck (WorldFishCenter). Participants at the side event of the Global Conference on Small-Scale Fisheries: Bringing Together ResponsibleFisheries and Social Development (Bangkok, Thailand, October 13–17, 2008) offered constructive advice and comments onEC O N O M I C A N D S E CT OR WORKX III
XI VA CK NOWL ED GM ENTSthe preliminary report “Small-Scale Capture Fisheries: A Global Overview with Emphasis on Developing Countries”;1 theircontribution is gratefully acknowledged.Grateful thanks are extended to the peer reviewers and commentators: R. Volk (USAID); S. Garcia (consultant); J. Ward(National Marine Fisheries Service [NMFS] National Oceanic and Atmospheric Administration); and C. de Haan, J. Virdin, X.Vincent, and M.-A. Bromhead (World Bank).The study is the result of a joint activity with FAO and WorldFish Center, both of which are partners in Global Partnership onFisheries (PROFISH). This study is one of a series of knowledge products produced by PROFISH.2 Complementary PROFISHknowledge products include The Sunken Billions: The Economic Justification for Fisheries Reform; Changing the Face of theWaters: The Promise and Challenge of Sustainable Aquaculture; and Rising to Depletion? Towards a Dialogue on the Stateof National Marine Fisheries (publications are available at http://www.worldbank.org/fish). A background study for this reportwas also prepared to inform policymakers and decision makers participating in the 28th Session of the FAO Committee onFisheries.The term hidden harvest is not original. It has been used by several authors and for several different purposes. These aresome examples: Employment and food recovery. Hidden Harvest is a produce recovery program in Coachella Valley, California, that employs low-income farm workers to “rescue” produce that is left behind in the fields and orchards after harvest (http://www.hiddenharvest.org) Food rescue. Hidden Harvest is a surplus food rescue program that strives to alleviate hunger and end food waste inthe Bay, Midland, and Saginaw, Michigan, regions by providing a safe and coordinated system of rescuing surplus foodand redistributing it to feed people in need (http://www.hiddenharvest.com) Food policy report. Hidden Harvest: U.S. Benefits from International Research Aid, Philip G. Pardey, Julian M. Alston,Jason E. Christian, and Shenggen Fan (Washington, DC: International Food Policy Research Institute, 1996) Integrated farming services. Pacific Ag Solutions (The Hidden Harvest ) provides a full range of integrated farmingservices (http://www.pacagsol.com) Forests. Uncovering the Hidden Harvest: Valuation Methods for Woodland and Forest Resources, B. M. Campbell andMartin Karl Luckert (London: Earthscan Publications, 2001) Wild foods. The Hidden Harvest: Wild Foods and Agricultural Systems: A Literature Review and AnnotatedBibliography, Ian Scoones, Mary Melnyk, and Jules N. Pretty (London; Sustainable Agriculture Programme,International Institute for Environment and Development, 1992) Wild resources. Valuing the Hidden Harvest: Methodological Approaches for Local-Level Economic Analysis of WildResources, International Institute for Environment and Development (London: Sustainable Agriculture ProgrammeResearch Series 3:4. International Institute of Environment and Development, 1997) Garments. The Swedish company, Our Legacy’s SS10, Hidden Harvest collection features garments of naturally grownfabrics and “personal identity” Poetry. “Hidden Harvest,” in Platform, Rodrigo Toscano (Berkeley, CA: Atelos, 2003)1The preliminary report of “Small-Scale Capture Fisheries: A Global Overview with Emphasis on Developing Countries” is available athttp://www.4ssf.org.2Donors to the PROFISH Partnership have included UK Department for International Development; Ministry Foreign Affairs, Iceland, Norway, and Finland; Ministry of Fisheries New Zealand; and Agence Française de Développement. PROFISH also benefited from the supportof FAO, WorldFish Center, and the International Union for Conservation of Nature.H ID D E N H A RV ES T
TER M I N O L O G Y A S USE D IN T HIS RE P ORTTERMINOLOGY AS USED IN THIS REPORTCommercial includes both large- and small-scale fisheries subsectors aimed at generating cash revenues.The fisheries sector includes all stakeholders and economic activities associated with the capture fisheries value chain,including preharvest and postharvest. Industrial, commercial, inland, recreational, small-scale, large-scale, and artisanal aresubsectors. Except in the case of recreational fisheries for which fishing equipment data were available, preharvest inputsto other subsectors are not included in calculations due to lack of disaggregated data.The footprint of an activity is the collective economic, social, and environmental impacts of its undertaking.Full-time fishers receive at least 90 percent of their livelihood from or spend at least 90 percent of their working time atfishing. Part-time fishers receive at least 30 percent, but less than 90 percent, of their livelihood from fishing or spend atleast 30 percent, but less than 90 percent, of their working time in that occupation. Occasional fishers receive less than30 percent of their income from fishing or spend less than 30 percent of their working time at fishing.Industrial represents the large-scale, commercial fishery subsector most often conducted from motorized vessels greaterthan 20 meters in length operating inshore and/or on open oceans.Inland fisheries are operated in (mostly) freshwater marshes, swamps, rivers, lakes, and reservoirs.Postharvest activities take place after the capture and landing of fish and include cleaning, storing, wholesaling, retailing, andother processing before consumption.Recreational fishers in both high- and low-income countries catch fish for pleasure and home consumption. Few, if any, ofthe fish are sold.Small scale generally refers to the commercial fishery subsector conducted without boats and/or from motorized or nonmotorized vessels of less than 20 meters in length. The concept of small scale is discussed in greater detail in the text. In thisreport, artisanal is the same as small scale.Subsistence fisheries comprise the subsector in which the majority of fishers are poor and captures are primarily consumedby local households without entering the value chain. Only surpluses are sold.The value chain comprises all economic activities and subsectors that directly or indirectly contribute to capture and postharvest processing and marketing of fish. In this report, the value chain does not include activities that occur before fishcapture, such as boatbuilding and net fabrication.EC O N O M I C A N D S E CT OR WORKXV
EX E C U T I V E S U MMARYEXECUTIVE SUMMARYThis study provides a disaggregated profile of the world’s small- and large-scale fisheries and an estimate of their direct andindirect contributions to the gross domestic product (GDP), food security, and rural livelihoods. The study is directed at decision makers, the development community, and professionals to uncover the hidden importance of the fisheries sector with aview to increasing its economic and environmental contributions in a sustainable manner.APPROACHKey indicators on production, employment, productivity, and economic contributions were compiled from 17 developingcountry3 and region case studies supplemented with recent sector studies from other developing countries and publishedinformation from Organization for Economic Cooperation and Development (OECD) member states. Case study data werecompiled and extrapolated to the global level using available global fisheries statistical information. The primary raising factors were statistical information, most importantly from the national catch reports submitted to the Food and AgricultureOrganization of the United Nations (FAO). Developing and developed countries and marine and inland fisheries were treatedseparately. Rather than being a random sample, the case study countries ensure coverage of countries where approximately80 percent of the world’s fishers live.Specific case studies on subsistence fisheries were undertaken in Bangladesh, Vietnam, and the Philippines to complementand extend the case studies described previously.Estimates of recreational fisheries’ contribution to GDP and estimates of numbers of recreational fishers (anglers) werecompiled from the published literature. Because most countries report the value of recreational fishing tackle sold but do notreport the number of anglers and their other nontackle expenses (such as for licenses, ice, bait, accommodation, boat hire,travel costs, etc.), the percentage of expenditures attributable to fishing equipment in the (mostly OECD) countries that dodisaggregate these data was used to ascertain the aggregate value of expenditures made by anglers globally. Most studiesacknowledge some overlap and possible double accounting with the tourism sector.Available national fisheries sector GDP estimates were compiled and examined to ensure consistency and to establish whether postharvest or aquaculture segments were included or excluded. For most countries, postharvest economic activitiesare considered as “manufacturing” under the System of National Accounts and generally are not included in reported GDPcontribution of the fisheries sector. However, recent studies of some countries in West Africa, the Pacific Islands, and OECDmember states have included disaggregated estimates of the postharvest contribution of fisheries to GDP where available.This sample was used to correct estimated GDP from fishing alone (available for more than 120 countries) to include thepostharvest value chain. Available data did not permit the disaggregation and/or extrapolation of the preharvest value chaincontributions to GDP.3Bangladesh, Brazil, Cambodia, China, Ghana, India, Indonesia, Lake Victoria (Kenya, Uganda, Tanzania), Mozambique, Myanmar, Nigeria,Philippines, Senegal, Thailand, and Vietnam.EC O N O M I C A N D S E CT OR WORKX V II
XV I I IEX ECUTIV E S UM M A RYMethodological IssuesNo standard definition allows for easy disaggregation of small- and large-scale fishery subsectors from national capturefishery reports. Many countries do not even report these su
Table A.2: Calculation of Mean and Median Fisheries Sector GDPs Based on 128 Countries . . . . . . . . . 57 Table A.3: Base Data and Data Sources Used to Estimate Extended Fisheries Sector GDP . . DANIDA Danish International Development Agency EU European Union FAO Food and Agriculture Organization of the United Nations FCP Fishery Country .


