Transcription
A N N UA LR E P O R TIndian Textile and Apparel Industry20211
ContentGlobal GDPGlobal Textile & Apparel Industry OverviewIndian Textile & Apparel Industry OverviewImpact of Covid on Indian Textile & Apparel IndustryIndian Textile Industry: Structure and Supply ScenarioFinancial Health of Indian Textile IndustryDISCLAIMER: This document is a copyright of Wazir Advisors. No part of this publication may be reproduced, stored in, or introduced into a retrieval system, or transmitted in any form or by any means(electronic, mechanical, photocopying, recording or otherwise), without the prior written per-mission of the copyright owner. Wazir Advisors has made every effort to ensure the accuracy of informationpresented in this document. However, neither Wazir Advisors nor any of its office bearers or analysts or employees can be held responsible for any financial consequences arising out of the use ofinformation provided herein. However, in case of any discrepancy, error, etc., same may please be brought to the notice of Wazir Advisors for appropriate corrections.
2020: A year that was The year 2020 has been the most challenging year in our lifetimes. What started as a promising year forour industry quickly turned into a difficult one. COVID-19 pandemic brought the entire world to a standstill,equitably affecting markets and supply chains globally. Consumer purchase of textile and apparel were hit badly due to the global lockdowns and economic recession.The global apparel consumption is estimated to have shrunk by 22% in 2020. However, 2021 looks brightergiven the onset of vaccination drives, growth in e-commerce sales of apparel, and resumption of globalsupply chains. We present to you our review of the Indian textile and apparel industry in 2020. This document covers keyindustry statistics - consumption, production, export, import, and financial health.1
Global Industry Overview2
Global GDP ContractionAnnual GDP Change (%)Country202020192021Pre Covid ForecastRevised EstimatePre Covid ForecastRevised ata Source: IMF World Economic Outlook Update, January 20213
Global Apparel MarketValue US billionRegion20192020Y-o-Y ChangeProjected CAGR2019-25Global apparel market shrunk2025 (P)by 22%, coming down fromUS 1,635 billion in 2019 toEU-27264219-17%1%280US 1,280 billion in 2020.United States235171-27%2%265The consumption is 07to reach to pre-Covid levelsover next couple of years andthen retrace its growth pathto reach US 2,007 billion by2025.Data Source: Published Data & Wazir Analysis4
Global Apparel MarketCategory-wise Share of Global T&A Trade (US Billion)Global T&A TradeFibreCAYarnFabricApparel%R4CAGHome gory Share100070606651FibreYarnFabric8%6%6% 3%Apparel600444201948219%Home 3306020052010201520192025 (P)58%The global textile and apparel trade has grown at a CAGR of 4% sinceApparel dominated T&A trade with a 58% share in the overall trade2005 to reach US 839 billion in 2019 and is expected to reach US 1value, followed by fabrics with a share of 19%.trillion by 2025, growing at a CAGR of 3%.Data Source: UN Comtrade & Wazir Analysis5
Global Textile and Apparel TradeLeading Textile and Apparel Exporters (2019)CountryValue US billionExportsShare (%) China’s share in global T&Atrade in 2019 was 34%. 839.35India20.216.236.44apparel exporters in 28.23USA21.75.226.93exporter of T&A in the worldSpain514.319.32with exports worth US 9838.7share has come down from39% in 2015. Vietnam and Bangladeshwere the second and thethird largesttextileandIndia is the 5th largest36.4 billion.Data Source: UN Comtrade & Wazir Analysis6
Leading T&A Exporters Category-wiseFibreUSAAustraliaChinaExport Value (US Bn)6.673.30Market Share20%YarnHome TextilesChinaIndiaTurkey3.12Export Value (US Bn)19.205.794.1410%9%Market shVietnamExport Value (US Bn)5.533.693.17Export Value (US Bn)149.9040.9033.70Market Share21%14%12%Market Share31%8%7%FabricChinaItalyS. KoreaExport Value (US Bn)72.707.577.26Market Share45%5%5%Data Source: UN Comtrade & Wazir Analysis7
Indian Industry Overview8
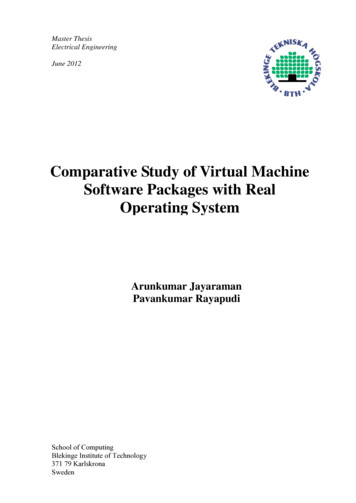
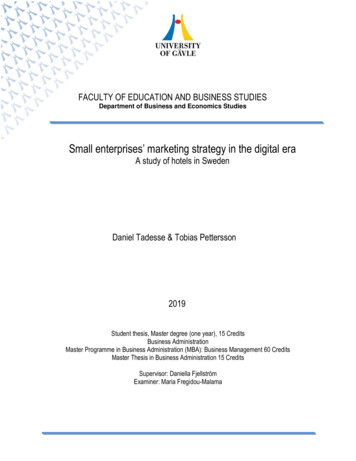
India’s Domestic Textile and Apparel MarketIndia’s Domestic Textile and Apparel Market Size (US billion)Indian domestic textile and apparelmarket is estimated at US 75 billionR1GCA0%19013-30%RGCA10 %106504112005-06ApparelThe market is expected to recover andgrow at 10% CAGR from 2019-20 to756.515Apparel constitutes 73% share of the135total T&A market in India.7855352010-11US 106 billion in 2019-20.reach US 190 billion by 2025-26.82028252142in 2020-21. The market fell 30% from2019-20Technical Textiles2020-21 (E)Home Textiles2025-26 (P)TotalData Source: DGCI&S and Wazir Analysis9
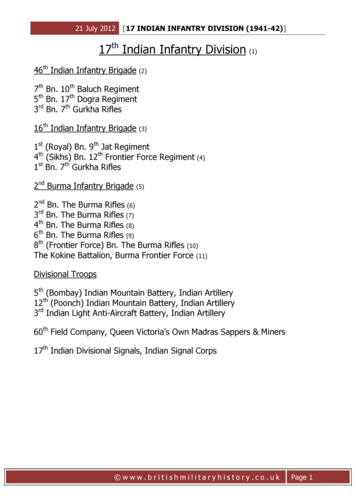
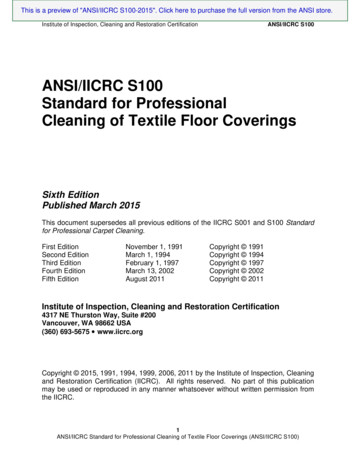
Indian Textile and Apparel ExportsIndian Textile and Apparel Exports (US billion)India’s T&A exports reached US 33.5billion in 2019-20.GRCA6511 %Due to the impact of Covid-19, India’s4T&A exports are expected to fall11around 15% to reach US 28.4 billion-15%%R5GCA29in 2020-21.33.525141815.5India’s exports of T&A are expected to3028.4grow to US 65 billion by 2025-26,24.8growing at a CAGR of 25-26(P)3212005-06FiberYarn5FabricApparel12Home Textiles107OtherTotalData Source: DGCI&S and Wazir Analysis10
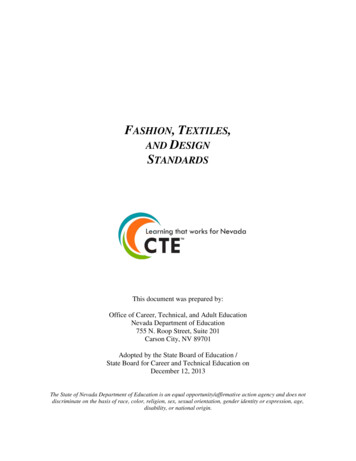
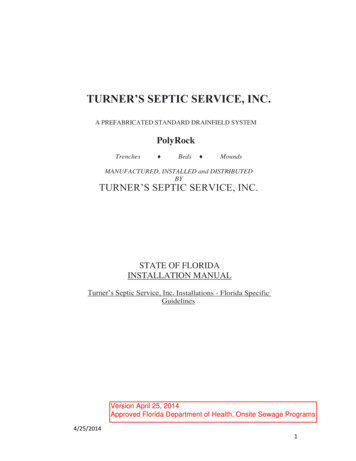
Indian Textile and Apparel ImportsIndian Textile and Apparel Imports (US billion)India’s T&A imports were US 8.60%R1GCA15.2billion in 2019-20. However, they are1.4expected to decline by around 35% 20ApparelThe imports of T&A are expected togrow at a CAGR of approx. 10% toreach US 15.2 billion by 2025-26.0.84.10.20.21.98.6reach US 5.6 billion in 2020-21.4.15.60.510.70.91.50.31.64.32020-21 (Est)Home Textiles2025-26(P)OtherTotalData Source: DGCI&S and Wazir Analysis11
Impact of Covid on Indian T&A IndustryDue to the pandemic, all economic activities except for the essential goods and services came to a standstill.The textile and apparel industry was no exception to this.Manufacturing ShutdownCancelled OrdersThe industry faced a complete shutdown for around 2-3Due to the uncertainty across the market, internationalmonths, while a few manufacturers who dedicated theirand domestic buyers cancelled or suspended their orders,production systems for PPE manufacturing were permittedadding to the woes of the industry.to function. However, most of the units operated at suboptimal utilization levels for next several months.Slump in Physical Retail SalesLockdown restrictions across the country resulted in aLogistics SuspendedDisrupted logistics and frozen external trade caused dueto the pandemic affected the entire value chain alike. India’sslump in the retail sales of apparel for at least 4-5 months.Moreover, the festive and wedding season sales weredeeply impacted.April and May 2020 net trade were around 50% lowerNew Consumer Trends Emergedmonth-on-month compared to that of the previous year.India’s e-commerce sale of goods and apparel saw a steeprise in 2020, thanks to an increased market.Work-From-Home drove the demand for casual wearapparel over formals.12
Category-wise Recovery in Domestic MarketConsumption in all the apparel categories was impacted negatively in 2020. However, the pace of recovery for each category was different.Sales for kids wear andPace of Recoverycasualwearrecoveredfaster, while ethnic wearand formal wear were theHighworst hit segmentsLowParty, Evening &Occasion wearFormal wearDenimEthnic wearKids wearCasual wearInnerwearLoungewear13
Indian Textile Industry:Structure and Supply Scenario14
Staple Fibre ProductionIndian Fibre Production Breakup (million Kg)FibreProductionShare 2019-20(%)CAGR 2015-19(%)2015-162019-205,7505,75062%0%Silk2936 0.5%6%Wool47450.50%-1%Others1,6901,68318%0%Natural Fibre7,5167,514Viscose Staple Fibre3425786%14%Polyester Staple Fibre8941,08512%5%Acrylic Staple Fibre107981%-2%54 0.1%-5%MMSF1,3471,7657%Total Fibre8,8639,2791%CottonOther MMSFIndia’stotalibre Data Source: Ministry of Textiles, GoI and Wazir analysis15
Staple Fibre ExportsIndia’s Fibre Exports (US million)FibreExportsShare 2019-20(%)CAGR se Staple Fibre274148Polyester Staple Fibre197Acrylic Staple FibreOther MMSFCottonNatural FibreMMSFTotal FibreIndia exported fibre worth US 1,891 million in 2019-20, whichhas reduced at a CAGR of 9%since 2015-16.Cotton occupied 70% share intotal fibre exports in 2015-16,while this has reduced to 56%-11%in 2019-20.8%-14%India’s Polyester staple -9%exports have grown at a CAGRof 10% since 2015-16.Data Source: DGCI&S and Wazir Analysis16
Staple Fibre ImportsIndia’s Fibre Imports (US million)FibreImportsShare 2019-20(%)CAGR 91657%1%Wool32424810%-6%Others861496%15%Natural Fibre9631,890731125%11%1131346%4%Acrylic Staple Fibre711004%9%Other MMSF951456%11%MMSF3514919%1,3142,38216%Viscose Staple FibrePolyester Staple FibreTotal FibreIndiaimportedfibreworthUS 2,382 million in 2019-20,which has grown at a CAGRof 16% since 2015-16.Overall imports of man-madestaple fibre (MMSF) has grownat a CAGR of 9%.18%Data Source: DGCI&S and Wazir Analysis17
Yarn ProductionIndian Yarn Production (million Kg)YarnCotton Spun YarnBlended & 100% non-Production2015-162019-204,1383,996Share 2019-20(%)CAGR 2015-19(%)71%-1%1,5271,66329%2%Total spun yarn5,6655,713100%0%Polyester Filament Yarn3,2053,934cotton spun yarn Annual Report: Indian Textile and Apparel Industry 2021, is a copyright of Wazir million kg in 2019-20.Polyester(PFY)filamentyarnproductionhashas grown at a CAGR5%ofsince 2015-16.Data Source: Office of Textile Commissioner, Govt. of India and Wazir Analysis18
Yarn ExportsIndia’s Yarn Exports (US million)FibreExportsShare 2019-20(%)CAGR 2015-19(%)2015-162019-203,5722,77458%-6%Man made spun yarn67168014%0%Other spun yarn1221383%3%Cotton spun yarn(Silk, Jute)Total spun yarnIn 2019-20, India’s total yarnexports stood at US 4,813million.Exports of spun yarn hasdeclined at a CAGR of 5%since 2015-16.India’s Nylon filament yarn4,3663,593-5%exports has grown at a CAGRViscose filament yarn52361%-9%of 35% between 2015-16Polyester filament 2-2%Total Yarn5,6514,813-4%Nylon filament yarnOther MMSFand 2019-20.Data Source: DGCI&S and Wazir Analysis19
Yarn ImportsIndia’s Yarn Imports (US million)FibreImportsShare 2019-20(%)CAGR 2015-19(%)2015-162019-20Cotton spun yarn42191%-18%Man made spun yarn17733426%17%Other spun yarn23912610%-15%(Silk, Jute)Total spun yarn4785816113%29%12717714%9%76675%-3%Other MMSF32240231%6%MMSF5838071,0421,285Polyester filament yarnNylon filament yarnTotal Yarnmillion worth of yarn in2019-20.India’s imports of viscosefilament yarn saw a sharprise between 2015-16 and2019-20 at a CAGR of 29%.459Viscose filament yarnIndia imported US 1,2851%8%100%5%Data Source: DGCI&S and Wazir Analysis20
Fabric ProductionIndian Fabric Production (Million Sq. Mtr.)FabricProductionShare 2019-20(%)CAGR 2015-19(%)2015-162019-20Mill Sector2,3152,0223%-3%Decentralized Sector62,26974,26697%5%64,58476,288Grand Total (Exc. Khadi,Wool & Silk)4%Fabric production in India stoodat 7,436 million sq. mtr, whichhas grown at 2% CAGR in thepast five years.The production of fabric fromdecentralized sector has alsogrown at a CAGR of 5%, whileproduction of mill sector hasdecreased at 3% CAGR .Data Source: Office of Textile Commissioner, Govt. of India21
Fabric ExportsIndia’s Fabric Exports (US million)FabricExportsShare 2019-20(%)CAGR 2015-19(%)2015-162019-20Cotton Woven1,7501,90538%2%Synthetic 7915,066Other WovenTotal Woven FabricKnitted FabricTotal Fabric8%India exported fabric worthUS 5,066 million in 2019-20,which has grown at 1% CAGRsince 2015-16.Woven fabric comprised 92%of the total fabric exports of1%2019-20.15%However, exports of knitted1%fabric has grown at 15% CAGRsince 2015-16.Data Source: DGCI&S and Wazir Analysis22
Fabric ImportsIndia’s Fabric Imports (US million)FabricImportsShare 2019-20(%)CAGR 2015-19(%)2015-162019-20Cotton Woven1631828%3%Synthetic Woven71286837%5%Other Woven63072531%4%1,5051,7743495501,8542,324Total Woven FabricKnitted FabricTotal Fabric4%24%Fabric imported by India in year2019-20 worth US 2,324million.Imports of knitted fabric andsynthetic woven fabric haveincreased at 12% and 5%respectively since 2015-16.12%6%Data Source: DGCI&S and Wazir Analysis23
Garments and Made-ups ProductionIndian Garments and Made-ups ProductionProductionY-o-Y change2018-192019-202020-21 (Est.)Garments (Mn pcs)21,00022,00016,000-27%Made-ups (Mn kg)2,3002,4002,100-12%Garment production in Indiawas estimated at 22 billion pcsin 2019-20, while made-upsproduction stood at approx.2.4 billion Kg.Due to Covid-19, the 202021apparelandmade-upsproduction is expected to fall27% and 12%, respectively.Data Source: Wazir estimates24
Garments and Made-ups ExportsIndia’s Garments and Made-ups Exports (US million)ExportsShare 2019-20(%)CAGR 2015-19(%)India exported garments worth2015-162019-20Cotton garments8,3598,20553%0%Synthetic garments3,9943,37122%-4%Other garments4,6373,93325%-4%Total garments16,99015,509-2%from 2015-16 to reach US Made-ups6,4946,9412%6,941 million in 2019-20.US 15,509 million in year2019-20, declining at a CAGRof 2% since 2015-16.Made-upsexportsonthecontrary grew at 2% CAGRData Source: DGCI&S and Wazir Analysis25
Garments and Made-ups ImportsIndia’s Garments and Made-ups Imports (US million)ImportsShare 2019-20(%)CAGR 2015-19(%)2015-162019-20Cotton garments23946441%18%Synthetic garments15033629%22%Other garments19134530%16%Total US 1,145million worth of garments andUS 1,022 million worth ofmade ups in 2019-20.Imports of synthetic garmentshas increased at 22% CAGRsince 2015-16.Data Source: DGCI&S and Wazir Analysis26
Domestic Market Size of Technical TextilesDomestic Market Size of Technical Textiles in India (US billion)The Indian technical textiles marketwas estimated at US 20 billion in20CAGR-25%2019-20, and grew at a CAGR of 10%since 2015-16.However, due to Covid-19, the market%1015is expected to fall 25% in 2020-21 toreach US 15 billion.1152005-062015-162019-202020-21 (Est)Data Source: Wazir Estimates Based on Published Data27
Technical Textiles ExportsImports of Technical Textiles by India (US million)India’s exports of Technical Textiles in2019-20 was worth US 2,423 million,which has grown from US 1,5282,423%R 12CAGmillion at a CAGR of 12%.-43%1,978from April to November 2020 has ��s exports of Technical Textiles2018-192019-20US 1,370 million.2020-21(Apr-Nov)Data Source: DGCI&S and Wazir analysis28
Technical Textiles ImportsImports of Technical Textiles by India (US million)India’s imports of technical textiles havegrown at a CAGR of 10% betweenCAG1,655%R 102,1052015 to 2018.-23%However, imports have declined at2,20923% from US 2,209 million in 201819 to US 1,730 million in 2019-20.1,7031,672-55%India’s imports of Technical Textilesfrom April to November 2020 has beenUS 769 -21(Apr-Nov)Data Source: DGCI&S and Wazir analysis29
Wazir Textile Index30
Wazir Textile Index (WTI) - H1 FY21Top listed textile companies in terms of sales turnover in FY20 have been included for financial analysis.S. No.Company NameAnnual Sales* - FY20 (Rs. Crore)1Arvind6,7052Vardhman6,3253Welspun India5,3244Trident4,6995Raymond3,1866KPR r Spinning2,083* Sales constitutes total operatingincome, standalone financials havebeen considered for analysisNote: Companies that have shown significantnegative deviation in numbers or those whichhave not yet reported the financials have notbeen included in the overall analysis.Data Source: Money Control31
Half yearly Analysis for the Selected Top PlayersHalf yearly Sales Trend – H1 FY21 (Rs. 111289627382304262618791663ArvindVardhmanWelspun R MillFilatex1278RSWM656Sutlej Textiles928750Nahar SpinningHalf yearly EBITDA Margin Trend – H1 FY2122%15%10%6%ArvindH1 FY2019%21%6%VardhmanH1 FY2119% 20%18%8%6%Welspun IndiaTrident3%RaymondKPR MillFilatex8%6%-4%RSWM-1%Sutlej Textiles2%1%Nahar SpinningGrowth %-70%Data Source: Money Control32
Half yearly Analysis - Major Expenses as % of Sales80% 78%Raw Material Cost% of SalesH1 FY2051% 49%52%60%58%50% 46%45% 44%WelspunTrident57% 56%57% 59%58% 58%RSWMSutlejTextiles44%H1 FY21ArvindVardhmanRaymondKPR MillFilatex54%Employee Cost% of SalesH1 FY2064% 65%H1 FY2112%16%Arvind9% 11%9% 10%11% 13%VardhmanWelspunTrident15%14% 14%RaymondKPR Mill3% ng12% 10%NaharSpinning58%Other Costs% of SalesH1 FY2027% 29%35%24% 24%19%25%23% 25%11% 10%10%15%24% 27%20%24%22% 24%H1 FY21ArvindVardhmanWelspunTridentRaymondKPR MillFilatexRSWMSutlejTextilesNaharSpinningData Source: Money Control33
Market Update - Key Economic IndicatorsIndia’s GDP (at constant prices)Index of Industrial Production (IIP*)Tex lesApparel200FY21 as compared to 9Apr'19Feb'19Dec'18Oct'18Aug' 18Jun'18Apr'18Feb'18130declined by '19June'19Apr'19Feb'19Dec'18Oct'18Aug' 18Jun'18Apr'18Feb'18100Dec'17same period last year.decreased by 4% in H1FY20, while that of apparelOct'174.8 per cent during theTex lesApparelAverage WPI for textiles140Aug'17compared to a growth ofWholesale Price Index (WPI*)June'17by 15.8% in H1 FY21 asDec'17Oct'17Aug'17H1 FY21India’s real GDP shrinksdecreased by 47% in H10Apr'17H1 FY20apparelshowed a decline of 44%.50June'1760.0forFY20, while that of textiles100Apr'17-15.8%IIPFY21 as compared to H115071.3AverageData Source: Reserve Bank of India, Economic Advisor, Govt. of India34
Measuring Financial Performance of Indian Textile Sector Wazir Textile Index has been developed for assessingnumber to assess quarterly (Q1), half yearly (H1),the overall financial performance of the textile sector nine monthly (9M) and yearly performance (FY) foron a continuous basis.subsequent years against the set benchmark.This index takes the collective performance of top Overall textile index includes the following threeten textile companies (by sales) of 2015-16 as thecomponents:base/benchmark which is represented by the base»Index number 100. Base value of 100 is assigned separately to eachquarter performance and full year performance in2015-16, and correspondingly financial performanceof the textile industry is benchmarked to this baseWTI Sales: Consolidated sales index of top tencompanies»WTI EBITDA: Consolidated EBITDA index»WTI Cost: Consolidated index for cost of Rawmaterial, employee & others35
US Monthly Apparel Store SalesValues in US bn.Jan. to Dec. 2020 store sales stand atUS 130 bn., approx. 32% less than23.616.011.9 12.1 12.316.515.613.110.77.46%1%15.415.711.6The sales recovered sharply in Jun.18.616.714.212.512.515.813.714.4same period last year.14.32020, and then again in Sep. after aperiod of drastic reduction since 39%-66%-88%JanFeb2019Mar2020AprMaySepOctNovDecYoY ChangeData Source: Eurostat; Extra EU-27 Imports Data36
US Monthly Home Furnishings Store SalesValues in US bn.Jan. to Oct. 2020 store sales stand atUS 41 bn., approx. 10% less than4.24.44%4.04.24.54.74.53.63%4.4 4.34.7 4.64.9 5.04.54.84.8 4.9The sales recovered sharply in May.2020, and then again in Jun. after a3.12.0same period last year.-4%-1%2%JunJulAug8%period of drastic reduction since P)YoY ChangeData Source: US Census Bureau37
US Monthly Apparel Import UpdateValues in US bn.US apparel imports are recoveringsteadily after hitting lowest in 0. Jan. to Nov. 2020 apparel imports8.46.06.67.86.67.4 6.94.0-15%-22%-15%-7%stand at US 59 bn., approx. 24% less5.5 5.3than same period last JulAugSepOctNovYoY ChangeData Source: US Census Bureau38
Share Change of Top 10 Apparel Suppliers in USCountryImport Value(US mn.)YoY shareChangeChina has lost approx. 7% share as1,647-0.5%Jordan1,4300.3%Sri Lanka1,3630.2%Others13,408-6.5%the US apparel imports which has3.7%1.2%mainly been taken up by Vietnam,Bangladesh and Cambodia0.3%-0.1%1.2%0.6%Data from Jan to Nov 202039
Monthly Apparel Import Update of EUValues in bn.EU-27 apparel imports are recoveringsteadily since Jun. 2020.8.17.5 7.46.3 6.16.56.45.55.85.7Jan. to Oct. 2020 apparel imports8.06.97.5 7.57.2were 58.4 bn., approx. 14% less6.65.5than same period last 8%-37%AprMayJun-8%-14%-20%JulAugSepOctYoY ChangeData Source: US Census Bureau40
Share Change of Top 10 Suppliers of EUCountryImport Value( ndia2,644Cambodia2,138Viet s7,324YoY shareChangeChina’s share increased by 1% during1.0%Jan to Oct. 2020. The main losers wereBangladesh, India and 0.1%Data from Jan to Oct 202041
About Wazir AdvisorsWazir’s services for the textile sector clients covers complete businessOur services span the entire breadth of textile manufacturingcycle, including strategy formulation, implementation, formingvalue chain – from fibre to finished goods. We cover thealliances and joint ventures, investments, market understanding,following segments:sector analysis, due diligence, etc. Fibres and FilamentsOur experience with leading Indian and international companies, Yarns Fabrics Garmentsconnect with the people who matter. Made-upsOur consulting team possesses experience across the key functions of Technical Textilesoperations, sourcing, projects and marketing in the sector. The team Textile Machinery and Equipmentmembers have executed strategy and implementation assignments Handlooms and Handicrafts Personal Protective Equipment (PPE)public sector organizations, Government departments, internationaldevelopment agencies, trade bodies, etc. has helped us to developa deep understanding of global textile sector dynamics and rightin key textile and apparel manufacturing countries.Wazir leverages its body of knowledge, contacts and combinedexpertise of its team to deliver value to clients.42
O U R S P E C I A L I Z AT I O NStrategyImplementationAlliancesWazir delivers practical, implementable strategiesWazir provides implementation services to textilePartnerships and collaborations are ways to achievefor clients to meet their objectives. We assist clientsand apparel sector entities to convert the plansaccelerated growth, expand market reach and attainto conceptualize, evaluate and select businessinto reality. Wazir has the capability to executetechnical advancement.opportunities in the textile and apparel sector.every strategy that it recommends.Be it corporate strategy intending to enhanceWhether it is to manage a Government schemesorganization alliances in textile and apparel sector,profitability or new market opportunity identificationor to improve productivity in apparel factoriesWazirhas developed broad range of services toor sector growth strategy to support MSMRs, we areor to identify the most suitable technology; wesupport companies and organizations looking forgeared to advise our clients efficiently and effectively.have in-house competence to cover all the criticalinorganic growth globally.elements of implementation. Corporate Strategy Market Opportunity Assessment Benchmarking and Gap Study Market Entry Strategy Process Re-engineering Location Analysis Productivity and Profitability Improvement Business Performance Enhancement Management Contract Product Diversification Project Management and Monitoring Marketing and Distribution Strategy Supply Chain Optimization Sector Mapping and Growth Strategy Feasibility and Techno Economic Viability Policy Formulation Support Government Scheme EvaluationRealizing the importance and need of inter- Company Due-diligence Joint Venture Marketing Tie-up Technology Transfer M&A Execution Strategic and Financial Funding(TEV) Study Cluster and Industrial Park Development43
Get the most out of yourApparel Factory with Wastra.www.wastra.inWastra can help you achieve Excellencein Apparel redModules44
Contact UsPrashant AgarwalWazir Advisorsprashant@wazir.in 91 9871195008Surender Jainsurender@wazir.in 91 r.com/WazirAdvisorsSanjay Arorasanjay@wazir.in 91 9971110566Varun Vaidvarun@wazir.in 91 9899985979B. Prakashprakash@wazir.in 91 .com/WastraByWazirWazir Advisors Pvt. Ltd. 3rd Floor, Building No.115, Sector 44, Institutional Area, Gurugram – 122 002, National Capital Region, India.
market is estimated at US 75 billion in 2020-21. The market fell 30% from US 106 billion in 2019-20. The market is expected to recover and grow at 10% CAGR from 2019-20 to reach US 190 billion by 2025-26. Apparel constitutes 73% share of the total T&A market in India. 21 35 78 55 135 5 11 20 15 42 2 4 8 6.5 13 28 50 106 75 190