Transcription
World J Gastroenterol 2013 April 21; 19(15): 2348-2354ISSN 1007-9327 (print) ISSN 2219-2840 (online)Online Submissions: 48/wjg.v19.i15.2348 2013 Baishideng. All rights reserved.BRIEF ARTICLEUnited States-based practice patterns and resourceutilization in advanced neuroendocrine tumor treatmentJonathan Strosberg, Roman Casciano, Lee Stern, Rohan Parikh, Maruit Chulikavit, Jacob Willet, Zhimei Liu,Xufang Wang, Krzysztof J Grzegorzewskitherapy, radiotherapy, targeted therapies), hospitalizations and physician visits, diagnostic tests (biomarkers,imaging, laboratory tests). Comparisons between categories of resource utilization and tumor progressionstatus were examined using univariate (by tumor site)and multivariate analyses (across all tumor sites).Jonathan Strosberg, H Lee Moffitt Cancer Center and ResearchInstitute, Gastrointestinal Tumor Department, Tampa, FL 33612,United StatesRoman Casciano, Lee Stern, Rohan Parikh, Maruit Chulikavit, Jacob Willet, LA-SER Analytica, New York, NY 10018,United StatesZhimei Liu, Xufang Wang, Krzysztof J Grzegorzewski, Novartis Oncology, Florham Park, NJ 07932, United StatesAuthor contributions: Strosberg J, Casciano R, Stern L, ParikhR, Chulikavit M, Liu Z, Wang X and Grzegorzewski KJ contributed to the study design and manuscript review; Willet J contributed to the writing, development, and editing of the manuscript.Supported by Novartis Pharmaceuticals Corporation, FlorhamPark, NJ 07932, to Liu Z, Wang X and Grzegorzewski KJ; LASER Analytica, to Casciano R, Stern L, Parikh R, Chulikavit Mand Willet JCorrespondence to: Lee Stern, MS, LA-SER Analytica, 24West 40th Street, Floor 8, New York, NY 10018,United States. lstern@la-ser.comTelephone: 1-212-6864100 Fax: 1-212-6868601Received: September 14, 2012 Revised: November 20, 2012Accepted: November 24, 2012Published online: April 21, 2013RESULTS: Fifty-five physicians were included in thestudy and completed online data extraction forms using the charts of 110 patients. The physician sampleshowed a relatively even distribution for those affiliatedwith academic versus community hospitals (46% vs55%). Forty (36.3%) patients were reported to havepancreatic NET (pNET), while 70 (63.6%) patients hadgastrointestinal tract (GI)/Lung as the primary NET site.Univariate analysis showed the proportion of patientshospitalized increased from 32.7% during baseline to42.1% in the progression stages. While surgeries wereperformed at similar proportions overall at baseline andprogression, pNET patients, were more likely than GI/Lung NET patients to have undergone surgery duringthe baseline (33.3% vs 25.0%) and any progression periods (26.7% vs 23.4%). While peptide-receptor radionuclide and targeted therapy utilization was low acrossNET types and tumor stages, GI/Lung types exhibitedgreater utilization of these technologies compared topNET. Chemotherapy utilization was also greater amongGI/Lung types. Multivariate analysis results demonstrated that patients in first progression period were over 3times more likely to receive chemotherapy when compared to baseline (odds ratio: 3.31; 95%CI: 1.46-7.48,P 0.0041). Further, progression was associated with agreater likelihood of having a study physician visit [relative risk (RR): 1.54; 95%CI: 1.10-2.17, P 0.0117],and an increased frequency of other physician visits (RR:1.84; 95%CI: 1.10-3.10, P 0.0211).AbstractAIM: To assess advanced neuroendocrine tumor (NET)treatment patterns and resource utilization by tumorprogression stage and tumor site in the United States.METHODS: United States Physicians meeting eligibility criteria were provided with online data extractionforms to collect patient chart data on recent NET patients. Resource utilization and treatment pattern datawere collected over a baseline period (after diagnosisand before tumor progression), as well as initial andsecondary progression periods, with progression defined according to measureable radiographic evidenceof tumor progression. Resource categories used in theanalysis include: Treatments (e.g. , surgery, chemo-WJG www.wjgnet.comCONCLUSION: Resource utilization in advanced NETin the United States is significant overall and data suggests progression has an impact on resource utilization2348April 21, 2013 Volume 19 Issue 15
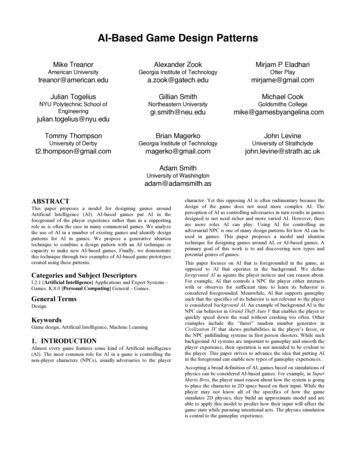
Strosberg J et al . United States resource utilization in advanced NETin a real-world setting. Therefore, the aim of the currentstudy is to assess advanced NET treatment patterns andresource utilization by tumor progression stage and tumorsite in the United States.regardless of NET tumor site. 2013 Baishideng. All rights reserved.Key words: Gastrointestinal cancers; Neuroendocrinetumors; Resource utilization; Health economics; Clinical practice patternsMATERIALS AND METHODSStudy designIn a United States-based sub-analysis of a global study(details of which have been published elsewhere[7]) Physicians (gastroenterologists, endocrinologists, and oncologists) were contacted to take part in the research fromDecember 2010 to January 2011. A total of 4100 physicians were identified in a market research database, andwere recruited via an online invitation. A conveniencesampling method was applied in order to achieve a final global study sample of 197 physicians, with a targetsample of 55 physicians in the United States sub-study.Eligibility criteria included the following: practicing medicine for at least 3 years (but no more than 30 years) priorto the study date, spending at least 50% of one’s workingtime on patient care, treating at least 3 NET patients inthe past year, and specializing in gastroenterology, endocrinology, or oncology.Physicians were instructed to complete internet-baseddata extraction forms, referring to clinical charts of patients. They were asked to refer only to charts on theirmost recent patients who were diagnosed with advancedNET of the GI tract, lung, or pancreas - at least onepatient must have experienced tumor progression. Additionally, selected patients had to have confirmed well to moderately-differentiated tumor histology, assessed asper the 2000 World Health Organization criteria[8]. Dataregarding patients with poorly differentiated tumors werenot selected for this study. Proportions, frequencies, andmeans (respectively) were compared by NET progressionstage and tumor site for the following measures:Strosberg J, Casciano R, Stern L, Parikh R, Chulikavit M, WilletJ, Liu Z, Wang X, Grzegorzewski KJ. United States-based practice patterns and resource utilization in advanced neuroendocrinetumor treatment. World J Gastroenterol 2013; 19(15): 2348-2354Available from: URL: htm DOI: TIONNeuroendocrine tumors (NET) are a group of diverseneoplasms, commonly originating in the gastrointestinaltract (GI), lungs, and pancreas. The prevalence of NET isestimated to be 35.0 per 100000 in the United States, andthe age-adjusted incidence of NET has increased froman estimated 1.1 per 100000 persons in 1973 to 5.3 per100000 persons in 2004[1]. The specific factors responsible for this rise in incidence are not know; however,improved classification of tumors and widespread use ofendoscopy as a screening tool are likely contributors tothis increase[1].Pancreatic NET (pNET) are often classified based onhormone produced (e.g., gastrinoma, insulinoma)[2]. GIand lung NET types have traditionally been classified bysite of origin, and morphologic pattern. Newer classifications, however, have been formulated to reflect the considerable variability in histopathology and presentationwithin each site of origin[3]. Patients with ileocecal NETtypically present with carcinoid syndrome, which resultsfrom an over production of serotonin. Symptoms andcomplications include diarrhea, hot flashes, bronchoconstriction, and right-sided valvular heart disease[3]. NET iscommonly perceived as indolent[1]; however, due to thevariability and uncertainty of symptoms associated withthe disease, NET is often diagnosed in an advanced stagewhereby the prognosis is poor (65% 5-year mortalityrate). This is particularly true of pNET, where the 5-yearmortality rate has been reported to be as high as 73%[1].Patients with localized NETs and those with resectableoligometastases are often managed surgically. Advancedunresectable tumors are often treated with somatostatinanalogs (SSA), either for control of symptoms or inhibition of tumor growth[4]. Other treatment options includestreptozocin or temozolomide-based chemotherapy, ortargeted therapies such as sunitinib or everolimus[5,6]. Platinum and etoposide-based regiments are typically usedfor poorly differentiated tumors. While guidelines to aidtreatment decisions have been published[5,6], little is knownabout how disease progression and tumor type influenceNET treatment decisions among United States physiciansWJG www.wjgnet.comNET progression: The main variable of interest was3-level tumor progression stage. The baseline period, orfirst stage, was defined as the time between diagnosis ofNET and diagnosis of tumor progression with measurable or radiographic evidence as reported by physicians.Initial progression, or second stage, was defined as thetime period during which tumor progression was firstdiagnosed and treated. Secondary progression, or thirdstage, was defined as the time point when further measurable or radiographic evidence for progression wasfound, and the following period of treatment. Since notall patients had a second progression, physicians wereasked to project resource use during this period, assuming a duration of 12 mo for all patients. The date of thelast resource use served as a proxy for patients who hadno recorded first progression or second progression date.Initial and secondary progression, in aggregate, were referred to as any progression (i.e., the any progression period encompasses both the initial and secondary progression period, assessing resources accrued in both; Figure 1).2349April 21, 2013 Volume 19 Issue 15
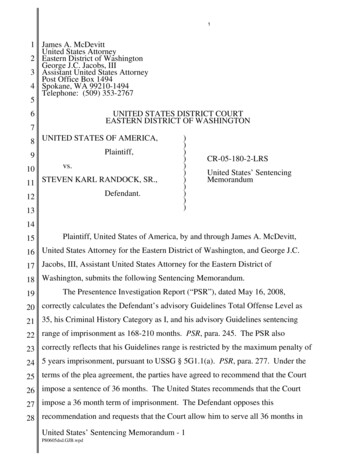
Strosberg J et al . United States resource utilization in advanced NETDiagnosis ofadvanced NETDiagnosis of initialprogressionevents per patient. For any progression, utilization rateswere reported as a proportion of patients per event foreach specific resource. Any time included resources usedat least once during baseline, first progression, or secondprogression. A given patient is counted only once if aparticular resource is received in two or more time periods. Practice patterns for any time were analyzed as theproportion of patients utilizing each resource.Diagnosis of secondprogressionWatch and wait period(optional)DiagnosticperiodBaseline period Initial progressionSecondperiodprogression periodFigure 1 Advanced neuroendocrine tumor patient study timeline. Secondprogression period resource utilization data was derived from physician projections. NET: Neuroendocrine tumor.Post-hoc statistical analysisMultivariable models were conducted to compare resource use across disease progression stages. As the studywas not powered to ascertain statistically significant differences, these analyses were considered secondary. Somepatients did not have baseline or first progression data(Measures), and repeated measurement of outcomes overtumor stage progression produced correlated outcomes.Therefore generalized estimating equations (GEE) wereemployed. GEE are generalized linear models whichestimate the average response over the population, asopposed to predicting responses for individuals. Utilizing such an approach, models were computed for binary(yes/no) outcomes assuming a binomial distribution. Forcount outcomes a Poisson distribution was assumed. Allmodels adjusted for the following covariates: primaryNET location, age, country, physician specialty, tumorhistology, ECOG performance status, and patient followup time. It should be noted that the resource use categorystudy physician visits was assessed as a binary outcome(i.e., did a patient have 1 visit or not); however, dueto the issue of convergence, a Poisson distribution wasassumed for this variable rather than a binomial distribution. A Bonferroni correction on P value was calculatedto determine an appropriate alpha value for the statisticalsignificance threshold (0.05/9 0.0055).NET type: The patient sample was further stratified intotwo groups, one with primary NET location as either thelung or GI, and the other with primary NET location asthe pancreas. It should be noted that no pre-specified distribution among NET sub-types was implemented; physicians were asked only to report data on their most recentpatients.Patient baseline attributes: Include age, site of metastasis, ECOG performance status, tumor histology andgrade, performance status, comorbidities, and tumorsymptoms.Physician attributes: Include primary specialty, whetherthey practiced in an academic or community hospital,number of years of training and practice, and proportionof time spent in direct patient care.Medical resources: Chemotherapy, peptide-receptor radionuclide therapy (PRRT), SSA, and other pharmaceutical therapies including targeted therapies; as well as studyphysician and other physician visits, hospitalizations,surgical procedures such as radiofrequency ablation,microwave ablation, cryoablation, radiotherapy, hepaticarterial embolization, and transplant; Biomarker testsincluding neuron specific enolase, chromogranin A, pancreatic polypeptide, neurotensin, plasma serotonin, vasoactive intestinal polypeptide, Ghrelin, human chorionicgonadotropin, Ki-67, 5-hydroxyndoleacetic acid, plasmasubstance P, total and free T4; other lab tests includingCBC, BUN, serum glucose, Darkfield microscopy, serumcreatinine, and lipid profile; and imaging test includingultrasounds, computed tomography (CT) scans, helicalscans, and others.RESULTSPatient and physician characteristicsOut of the total sample of physicians (n 55), 13% (n 7) primarily practiced medical oncology, 29% (n 16)hematology/oncology, 29% (n 16) gastroenterology,and 29% (n 16) endocrinology. The physician sampleshowed a relatively even distribution for those affiliatedwith academic versus community hospitals (46% vs 55%).Each physician reported data on 2 patients (n 110 total). Baseline data were not available for 6 United Statespatients because their date of diagnosis of advancedNET and first progression were the same; however, 61patients had at least initial progression.Forty (36.3%) patients were reported to have pNET,while 70 (63.6%) patients had GI/Lung as the primaryNET site (GI/Lung NET). The mean duration of baseline period was found to be 14.0 mo for pNET, 13.3mo for GI/Lung, and 13.6 mo for both tumor types.The mean duration of initial progression was 5.7 mo forpNET, 7.9 mo for GI/Lung, and 7.1 mo for both tumortypes. Sixty three (57.3%) patients had well differentiatedStatistical analysisProportions and frequencies (for dichotomous) as wellas means and medians (for count outcomes) were assessed for the study resource use categories (listed above)were compared according to NET progression stage andtumor site. Resources were assessed for any progressionand any time. Any progression was measured at an eventlevel, where first progression and second progressionwere considered as separate events. Thus, it includedboth first progression and second progression resourceuse information, which may have resulted in multipleWJG www.wjgnet.com2350April 21, 2013 Volume 19 Issue 15
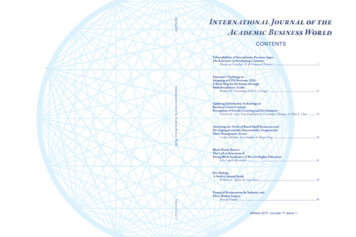
Strosberg J et al . United States resource utilization in advanced NETbetween the two groups: SSA (80.0% vs 77.1%), targetedtherapy (5.0% vs 7.1%), hospitalization (55.0% vs 57.1%),helical scans (37.5% vs 38.6%), other imaging tests (57.5%vs 58.6%), and biomarker tests (65.0% vs 67.1%; Table 1).Resource utilization by progression state and by tumor site is summarized in Table 2. First, chemotherapyutilization followed markedly different patterns betweenpNET and GI/Lung NET patients. No chemotherapyuse was observed among pNET patients at baseline;however, it increased to greater than 26.7% during progression. Doxorubicin, streptozocin, and temozolomidewere the most frequently used chemotherapies. AmongGI/Lung NET patients chemotherapy use gradually increased from baseline to second progression; cisplatin,5-fluorouracil, etoposide and doxorubicin being the mostfrequently used chemotherapies. Second, targeted therapies were not widely used among pNET patients (2.8%at baseline; 1.7% during progression). GI/Lung NETpatients showed marginally higher use of targeted therapies, with increased utilization during second progression(5.7%) over baseline (2.9%) and initial progression (2.4%).Third, PRRT was not utilized among pNET patients;however, a small number of GI/Lung NET patientsreceived PRRT (4.4% during baseline, 4.5% during progression).Similar SSA use was observed among both pNET andGI/Lung NET patients. At baseline 63.5% of all NETpatients received SSA. Utilization at first progressionwas marginally lower (62.3%), while second progressionutilization decreased to 40.9%, with an average of 48.5%at any progression. The proportion of patients who werehospitalized increased between baseline and any progression periods (32.7%-42.1% overall). Proportions ofpatients utilizing CT Scans increased upon progression.Ultrasound, biomarker, laboratory tests and other imaging decreased upon progression. Lastly, surgeries wereperformed at similar proportions overall at baseline andprogression. pNET patients, however, were more likelythan GI/Lung NET patients to have undergone surgeryduring the baseline (33.3% vs 25.0%) and any progressionperiods (26.7% vs 23.4%).Table 1 Any time resource utilization by neuroendocrine1tumor type n argeted therapy3ResourcesHospitalizationsUltrasoundsCT scansHelical scansOther imaging tests4Bio marker5Other lab tests6Physician visitAll NET(n 110)GI/lung NET(n 70)pNET(n 40)50 (45.45)42 (38.18)6 (5.45)86 (78.18)7 (6.36)30 (42.86)30 (42.86)6 (8.57)54 (77.14)5 (7.14)20 (50.00)12 (30.00)0 (0.00)32 (80.00)2 (5.00)62 (56.36)42 (38.18)79 (71.82)42 (38.18)64 (58.18)73 (66.36)70 (63.64)109 (99.09)40 (57.14)22 (31.43)53 (75.71)27 (38.57)41 (58.57)47 (67.14)41 (58.57)40 (100.00)22 (55.00)20 (50.00)26 (65.00)15 (37.50)23 (57.50)26 (65.00)29 (72.50)69 (98.57)1A patient was counted (once) if that individual utilized a resourceat any stage of their disease; 2Chemotherapy includes 5-fluorouracil,actinomycin-D, capecitabine, carboplatin, cisplatin, cyclophosphamide,dacarbazine, doxorubicin, etoposide, gemcitabine, irinotecan, mitotane,oxaliplatin, streptozocin, temozolomide and vincristine; 3Targeted therapyincludes everolimus, sunitinib, imatinib, and bevacizumab; the data collection form captured these therapies under the heading “other treatments”;4Other imaging includes positron emission tomography, stereotacticradiosurgery, metaiobenzylguanidine, magnetic resonance imaging, andchest X-ray; 5Biomarkers include neurotensin, chromogranin A, pancreaticpolypeptide, neurotensin, plasma serotonin, vasoactive intestinal polypeptide, ghrelin, human chorionic gonadotropin, Ki-67, 5-hydroxyndoleaceticacid, plasma substance P, total and free T4; 6Other lab tests include serumglucose, complete blood count, blood urea nitrogen, serum creatinine, andlipid profile were captured. PRRT: Peptide-receptor radionuclide therapy;NET: Neuroendocrine tumor; pNET: Pancreatic NET; GI: Gastrointestinaltract; CT: Computed tomography.tumor histology, while 47 (42.7%) patients had moderately differentiated tumors. Furthermore, 63 (57.3%)patients were found to have symptoms and 47 (42.7%)showed no symptoms. ECOG Performance varied asfollows: 44 (40.0%) patients showed a score of 0-1, 24showed a score of 2, 12 showed a score of 3, 5 showed ascore of 4, and 25 patients had no recorded score.Resource utilization and practice patternsResource utilization at any time and across all NET subtypes shows SSAs to be the treatment used in the highestproportion of patients (78.2%), followed by surgery andchemotherapy (used in 45.5% and 38.2% of patients,respectively). Any time resource utilization also indicateshigh proportions of patients undergoing hospitalization(56.4%) as well as diagnostics such as CT scans (71.8%),biomarkers (66.4%) and other lab tests (63.6%). pNETpatients were proportionately less likely than GI/LungNET patients to receive chemotherapy (30.0% vs 42.9%),CT scans (65.0% vs 75.7%), and PRRT (0.0% vs 8.6%).pNET patients were more likely to have received ultrasound (50.0% vs 31.4%) and other laboratory tests(72.5% vs 58.6%), and to have undergone surgery (50.0%vs 42.9%), when compared to GI/Lung NET patients.Utilization of other resources were found to be similarWJG www.wjgnet.comPost-hoc statistical results across tumor progressionstagesPatients in first progression were observed to be over 3times more likely to receive chemotherapy when comparedto baseline (odds ratio: 3.31; 95%CI: 1.46-7.48; Table 3).Patients in first progression were also more likely to havea study physician visit [relative risk (RR): 1.54; 95%CI:1.10-2.17], as well as an increased frequency of other physician visits (RR: 1.84; 95%CI: 1.10-3.10; Table 4).DISCUSSIONThe aim of this study was to assess the resource utilization and treatment patterns of NET by tumor progression stage and by tumor site. The results suggest thatthere is significant resource utilization associated with2351April 21, 2013 Volume 19 Issue 15
Strosberg J et al . United States resource utilization in advanced NETTable 2 Resource utilization by progression state n (%)BaselineTreatmentsChemotherapy1Targeted therapies2PRRTSomatostatin T scans (conventional)CT scans (helical or spiral)Other imaging3Biomarkers4Lab tests5Study physician visitOther physician visitAny progressionAll NETGI/LungpNETAll NETGI/LungpNET17 (16.4)3 (2.9)3 (2.9)66 (63.5)29 (27.9)17 (25.0)2 (2.9)3 (4.4)43 (63.2)17 (25.0)0 (0.0)1 (2.8)0 (0.0)23 (63.9)12 (33.3)46 (26.9)6 (3.5)39 (6.1)83 (48.5)42 (24.6)30 (27.0)5 (4.5)5 (4.5)52 (46.9)26 (23.4)16 (26.7)1 (1.7)0 (0.0)31 (51.7)16 (26.7)34 (32.7)38 (36.5)62 (59.6)23 (22.1)51 (49.0)66 (63.4)61 (58.7)102 (98.08)77 (74.04)23 (33.8)20 (29.4)43 (63.2)15 (22.1)31 (45.6)44 (64.7)36 (52.9)66 (97.06)50 (73.53)11 (30.6)72 (42.1)44 (39.6)18 (50.0)34 (19.9)22 (19.8)19 (52.8)109 (63.7)72 (64.9)8 (22.2)51 (29.8)33 (29.7)20 (55.6)52 (30.5)33 (29.7)22 (61.1)84 (49.1)55 (49.6)25 (69.4)84 (49.1)50 (45.1)36 (100.00) 165 (96.49) 107 (96.40)27 (75.00) 143 (83.62) 92 (82.88)28 (46.7)12 (20.0)37 (61.8)18 (30.0)19 (31.7)29 (48.3)34 (56.7)58 (96.67)51 (85.00)1Chemotherapy includes 5-fluorouracil, actinomycin-D, capecitabine, carboplatin, cisplatin, cyclophosphamide, dacarbazine, doxorubicin, etoposide, gemcitabine, irinotecan, mitotane, oxaliplatin, streptozocin, temozolomide and vincristine; 2Targeted Therapy includes everolimus, sunitinib, imatinib, andbevacizumab; the data collection form captured these therapies under the heading “other treatments”;3Other imaging includes positron emission tomography, stereotactic radiosurgery, metaiobenzylguanidine, magnetic resonance imaging, and chest X-ray; 4Biomarkers include neurotensin, chromograninA, pancreatic polypeptide, neurotensin, plasma serotonin, vasoactive intestinal polypeptide, ghrelin,human chorionic gonadotropin, Ki-67, 5-hydroxyndoleacetic acid, plasma substance P, total and free T4;5Other lab tests include serum glucose, complete blood count, blood urea nitrogen, serum creatinine, andlipid profile were captured. PRRT: Peptide-receptor radionuclide therapy; NET: Neuroendocrine tumor;pNET: Pancreatic NET; GI: Gastrointestinal tract; CT: Computed tomography.Table 3 Multivariate analysis for resource use prevalence1among patients at first progression vs tinanalogsSurgeryHospitalizationOther physicianvisitOddsTable 4 Multivariate analysis for patient hospitalization andphysician visit frequency at first progression vs .72210.21880.35990.0790Betaestimateratio Lower bound Upper bound valueStudy physicianvisit1Hospitalizations2Study physicianvisits2Other physicianvisits20.4346RateP95%CIratio Lower bound Upper bound value1.54441.10142.16560.0117-0.0617 0.94020.1321 09613.09990.02111.84331Generalized estimating equations model (assuming binomial distribution and unstructured covariance structure) while controlling for primaryneuroendocrine tumor location, age, Eastern Cooperative Oncology Groupstatus, tumor histology, physician specialty and follow-up time; 2Valuedenotes statistical significance.Generalized estimating equations model (assuming binomial distribution and unstructured covariance structure) while controlling for primaryneuroendocrine tumor location, age, Eastern Cooperative Oncology Groupstatus, tumor histology, physician specialty and follow-up time; 2Valuedenotes statistical significance.United States NET patients regardless of tumor site,particularly with respect to hospitalizations, surgeries, imaging and lab tests, chemotherapy, and SSA (Table 1). Asmay be expected, disease progression is associated witha decrease in utilization rates for certain diagnostics including ultrasound, biomarker, laboratory tests and otherimaging. However, disease progression is associated withan increase in other resources, such as other (non-study)physician visits, hospitalizations, chemotherapy, and CTscans (Table 2). In keeping with these results, the multivariate analysis demonstrates that NET patients are morelikely to receive chemotherapy and visit physicians whendisease progresses.While overall resource utilization increases with disease progression irrespective of tumor site, there werevariations in practice patterns depending on whetherpatients had GI/Lung or pNET. For instance, pNET patients were found to be less likely than GI/Lung patientsto be administered targeted, chemo-, or peptide-receptorradionuclide therapies, and more likely to have undergone surgical procedures than the GI/Lung patients.Although the heterogeneous nature of NET makesinferences about whether physicians treated patients according to current guidelines difficult, some comparisonsWJG www.wjgnet.com12352April 21, 2013 Volume 19 Issue 15
Strosberg J et al . United States resource utilization in advanced NETcan be made with caution[5,6]. The high utilization ofsurgical procedures and SSA observed here is consistentwith NCCN guidelines[5]. It is possible that utilization oftargeted therapies (everolimus and sunitinib) in pNETwas low because of their novelty, limited availability, andrestricted reimbursement by managed care organizationsduring the patient data collection time period (December2010-January 2011). Furthermore, recent clinical trial datasupporting the use of these therapies were not availablewhen the study was conducted[9,10]. Inferences regardingthe observed differences in utilization of targeted andPRRT therapies between pNET and GI/Lung types areinconclusive.The low use of targeted therapies overall should beconsidered more closely. Recent clinical trial data suggest sunitinib and everolimus improve progressionfree survival by 6-7 mo compared to placebo plus bestsupportive care[9-11]. While more research is necessaryto elucidate differences in adverse event reporting (andquality of life more generally) between patients receivingchemotherapy versus targeted agents, these trials suggestthat targeted therapies are associated with relatively lowrates of adverse events, and may be more tolerable thanchemotherapy[9,11].Rates of chemotherapy use are higher than onemight expect (42.86% in GI/Lung NET and 30.00% inpNET); especially given that chemotherapy is approvedonly in well- to moderately-differentiated pNET. Whilethe reasons for these relatively high rates cannot beknown for certain, it is possible that physicians are usingchemotherapy regimens off-label, as a result of havingfew alternative treatments available for the advanced GI/Lung and pancreatic NET populations.Interestingly, we found similar baseline durations forGI/Lung and pNET types; with marginally shorter firstprogression duration in pNET (secondary progressionduration could not be ascertained). As pNET has been reported to have a more aggressive disease course[1], cautionshould be taken in interpreting these results. It is plausiblethat the operational definition of disease progression inthe current study is not sensitive to changes in the tumorpathology which lead to the mean differences in survivaland progression, generally observed elsewhere[1].In comparison to results from a global analysis[7],this United States-specific sub-analysis shows severaldifferences in resource utilization and practice patterns.Specifically, cross-sectional resource utilization is lower inthe United States for certain categories including chemotherapy, PRRT, and notably hospitalizations. Multivariateanalyses are in line with those from the global analysis,showing an increase in chemotherapy and physician visitsassociated with progression. However, while the globalanalysis also showed an increase in SSA use with progression, the United States sub-analysis data do not.of participating physicians may differ from the generalpopulation of physicians in ways that may differentiallyaffect the study results. Some patients are missing baseline data (n 6), and for those patients with initial progression data but not secondary progression data, hypothetical resource use projections were made by the studyphysicians. Because of the cross-sectional nature of thestudy, recall bias may have affected the observe
treatment patterns and resource utilization by tumor progression stage and tumor site in the United States. METHODS: United States Physicians meeting eligibil-ity criteria were provided with online data extraction forms to collect patient chart data on recent NET pa-tients. Resource utilization and treatment pattern data