Transcription
January REPORT27, 2020RESEARCHSolidas a Rock?January 27,2020Stock RatingPrice TargetCurrent PriceThe Blackstone GroupSolid as a Rock?The private equity industry has faced a lot of concerns recentlyregarding its ability to continue to raise funds. Blackstone has stoodout as a winner in the industry over the past year – primarily due toits ability to continuously raise funds and increase dry powder andtotal assets under management (“AUM”). At the end of 2018,Blackstone had over 470 billion in AUM. Blackstone has significantlyoutperformed the S&P 100 in the past few months. The FIG teamwanted to explore Blackstone to determine whether the name is stillattractive.SELLCAD 55.84CAD 62.21BearCasePriceTargetBullCase 46.79 55.84 67.11TickerMarket Cap (MM)19.3xROE 201926.8%52 Week PerformanceThesis I: Superior Capital PositionThesis II: Sustainable Earning PowerFIGLinna Lilli@quiconline.comHenry Yuhyu@quiconline.comMax Bernardimbernardi@quiconline.comThe information in this document is for EDUCATIONAL and NON-COMMERCIAL use only and is not intended toconstitute specific legal, accounting, financial or tax advice for any individual. In no event will QUIC, its members ordirectors, or Queen’s University be liable to you or anyone else for any loss or damages whatsoever (includingdirect, indirect, special, incidental, consequential, exemplary or punitive damages) resulting from the use of thisdocument, or reliance on the information or content found within this document. The information may not bereproduced or republished in any part without the prior written consent of QUIC and Queen’s University.QUIC is not in the business of advising or holding themselves out as being in the business of advising. Manyfactors may affect the applicability of any statement or comment that appear in our documents to an individual'sparticular circumstances. Queen’s University 2019 41,018P/E 2020ETo guide the analyses, the FIG team has two major theses:Finally, the valuation was considered in two ways. First, a sum ofparts valuation was employed, which was primarily driven bymanagement fee earnings, performance fee earnings, asset value,and the dividend yield. Then, a standard comparables companyanalysis was used to evaluate its standing relative to peers. Thisresulted in a blended target share price of 55.90, which is below thecurrent share price. The FIG team likes Blackstone’s business modelas it holds superior capital raising abilities without comprisingreturns. As well, the management team is focused on growingmanagement fee earnings, which are more recurring in nature.However, under the current valuation, the FIG team believes thatBlackstone is overvalued.BXKaran Goyalkgoyal@quiconline.comRuchira Guptargupta@quiconline.com
January 27, 2020Solid as a Rock?Table of ContentsIndustry Overview3Company Overview5Recent Company Developments7Investment Thesis I: Superior Capital Position8Investment Thesis II: Sustainable Earning Power10Valuation and Conclusion12References152
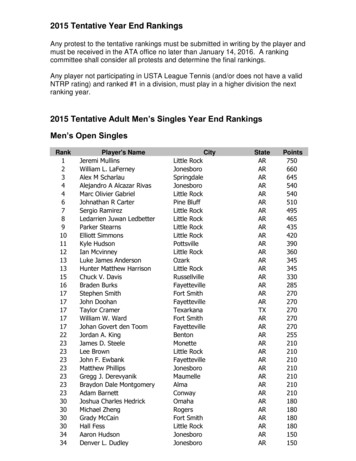
January 27, 2020Solid as a Rock?Private Equity Industry OverviewWhat Is Private Equity?How Do Private Equity Firms Earn Money?A private equity (“PE”) firm is a type of alternative assetmanager that invests in equity stakes in privatecompanies. In general, these are larger stakes of 50%to 100% of a company’s outstanding equity. It istypical to see an investment period of four to eightyears in private equity investments. In addition, PEfirms will employ large amounts of leverage toimprove its returns.Like other types of asset managers, PE firms earnrevenues based on fees. There is typically a generalmanagement fee of 2%, and an additional fee basedon outperformance called distributions. Thesedistributions are best thought of as a series of bucketsflowing into one another. When each bucket fills up,the excess funds flow into the next bucket. Earlierbuckets favor the LPs, and later buckets favor the GPs.Typically, the distribution structure of a PE fund willreturn initially invested capital plus a percentage ofprofits ( 10%) to LPs. Beyond this initial hurdle, GPsclaim 20% of excess profits, while the other 80%falls to the LPs. Because these outperformance fees aremost of a PE firm’s revenue, firms must deliver superiorreturns to continue running.In each PE investment, there are two main parties: thegeneral partner (GP) and the limited partner (LP). ThePE firm is referred to as the GP, while the investorsinvested in the fund are the LPs. LPs will provide themajority of capital for the equity portion ofinvestments. However, GPs will often invest alongsideits LPs, allowing for aligned interests and upside ininvestments. Examples of GPs include those such asBlackstone, The Carlyle Group, KKR, and Bain Capital.On the other hand, LPs are typically governmentsystems such as the California Public Employees’Retirement System, and wealthy individuals.EXHIBIT IVChallenges in the IndustryAs has been the topic of conversation for many years,historically high returns have attracted substantialcapital in the industry. While this makes fundraisingeasy, it also attracts high levels of competition. AprivateEXHIBIT VTypical PE StructureGlobal PE Capital Raised ( B)General Partner(Private EquityFirm)Limited Partner(Investors) 1,000 750Manages theFundOwns the FundPrivate Equity Fund 500 695 855 794 697 714 661 574 446 392 324 320 250 0HoldingHoldingHoldingSource(s): Bain & Company Global PE Report 20193
January 27, 2020Solid as a Rock?Private Equity Industry OverviewAs in any market, when demand is greater than supply,prices increase. Average private equity buyoutmultiples are now in fact higher than the multiples ofpublic companies.As funding increases and high prices decrease therelative amount of attractive assets, undeployedcapital called dry powder continues to pile up. 2018set a record for global dry powder of 2.0T. Theselevels of excess capital are putting pressure on fundmanagers to make investments, even if it meanssacrificing returns.This combination of inflated prices, illiquidity, highdegrees of leverage, and pressure to makeinvestments is a risk that the FIG team must becautious of as investors in the asset manager space.EXHIBIT VIAverage EBITDA Purchase Multiple for U.S. LBOs12x10x10x 10x9x9x9x9x9x11x 11x10x 10x 11x8x6xacquisitions allow the firm to decrease its average costof acquisition while taking advantages of synergies.In theory, the buy-and-build strategy is a powerfulsolution to the elevated multiples in the market.However, this strategy is much harder to execute, asseveral characteristics are necessary. First, the sectormust be a stable environment that fosters steadyacquisitions, meaning cash flows are consistent andthe risk of disruption is low. Most importantly, it mustbe a sector in which multiple arbitrage exists andconsolidation creates value, as consolidation does notalways translate to higher revenue.In addition, either the GP or the management teamneeds to have the experience to identify accretiveacquisitions. Management must fully understand whatits strengths are and why it holds those strengths, sothat it does not stray outside of its circle ofcompetence. This is not an easy task. One example isAurora Foods, which bought a series of food brands todrive up scale. However, management failed to realizethat premium foods on shelves and budget foods infreezers are not synergistic, and the company filed forbankruptcy in 2003. Thus, while the Buy-and-Buystrategy can be a value-creating lever, it can destroyreturns when not used prudently.EXHIBIT VIISource(s): Bain & Company Global PE Report 2019Strategies That Are Being UtilizedAverage PE EBITDA Purchase Multiple by Deal Size20xIn this more challenging environment, PE firms areemploying less traditional strategies to improvereturns. The often seen, “buy-and-build” strategy willbe further examined in this report.15xThe buy-and-build strategy involves purchasing astrong platform company (one that facilitates bolt-onacquisitions), and then merging at least four additionalacquisitions. This strategy is quite popular as it allowsGPs to take advantage of multiple arbitrage. Ingeneral, big companies have higher multiples thansmaller ones. Thus, the lower multiple of these bolt-on0x14x 14x 15x12x11x16x19x17x12x11x10x5x2017Greater than 2.5B 500M- 1B 25M- 100M2018 1B- 2.5B 100M- 500MSource(s): Bain & Company Global PE Report 20194
January 27, 2020Solid as a Rock?Company OverviewThe Blackstone Group (“BX”) is a multinational privateequity, alternative asset management, and financialservices firm. It was founded in 1985 as a mergers andacquisitions boutique by Peter Peterson and StephenSchwarzman. It is one of the largest investors inlevered buyouts. BX operates through four mainbusiness segments: Real Estate, Private Equity, HedgeFund Solutions, and Credit.Business SegmentsReal EstateFounded in 1991, BX’s Real Estate group is one of thelargest real estate investment managers in the world.With geographically diversified investments in NorthAmerica, Europe, Asia, and Latin America, BX has 136.2B AUM within the Real Estate segment. Types ofreal estate investments include hotels, office buildings,shopping centres, residential areas, and industrialassets. BX looks to acquire real estate that is highquality, well-located, and undermanaged. BX createsvalue by addressing any business strategy or propertyissues and then selling the property once the businessplan has been accomplished.In addition to the Real Estate group, BX also has a realestate debt platform. The Blackstone Real Estate DebtStrategies (BREDS), launched in 2008, targets debtinvestment opportunities collateralized by commercialreal estate. BREDS invests mostly in the U.S. andEuropean markets by providing multiple types oflending options for investors, such as mezzanine loans,senior loans, and liquid loans.In 2013, BX also launched the Core Real Estatebusiness, which is a global portfolio of high quality andstabilized investments in prime markets across the U.S.,Europe, and Asia. Core targets industrial, multi-family,office, and retail assets. Returns are generated throughasset value appreciation and rental income. In 2017,Blackstone Real Estate Investment Trust (BREIT) waslaunched to focus on investing in stabilized incomeoriented commercial real estate in U.S.Private EquityEstablished in 1987, the Private Equity segment is aglobal business with 130.7B AUM. BX has managedseven general private equity funds, three sectorfocused funds, and one geography-focused fund. Theprivate equity segment includes Blackstone TacticalOpportunities that looks at opportunistic investmentsacross platforms and geographies. It also includesStrategic Partners Fund Solutions that looks at thesecondary funds of fund businesses. Lastly, it includesBlackstone Total Alternatives Solutions, which is forhigh net worth investors offering exposure to illiquidassets. Blackstone Capital Markets is for the capitalmarkets services business. The investment strategiesare in response to, or in anticipation of, changes inlocal markets, capital flows, the global economy, andgeopolitical trends. BX strives to create goodwill orfranchise value through strategies conducted postacquisition. Creating goodwill and franchise valueallows for the products or services to be sold at highervalues.EXHIBIT IRevenue Breakdown by Business Segment (FY2018)24%33%8%10%25%Real EstatePrivate EquityCreditHedge Fund SolutionsOtherSource(s): Company Filings5
January 27, 2020Solid as a Rock?Company Overview (Cont’d)Hedge Fund SolutionsThe Hedge Fund Solutions segment manages 77.8BAUM. Blackstone Alternative Asset Management(“BAAM”) is the largest group of BX’s Hedge FundSolutions segment and is within the world’s largesthedge fund with discretionary capital allocation. Inaddition, the Hedge Fund Solutions segment includesseeding new hedge fund businesses, buying minorityownership in more established hedge funds, andinvesting in special situation opportunities.CreditThe Credit segment has 127.5B AUM and mainlyconsists of GSO Capital Partners, a large creditalternative asset manager. Investment portfoliosinclude loans and securities of non-investment gradecompanies. These can take many capital structures,including senior debt, subordinated debt, preferredstock, and common equity. GSO’s three overarchingstrategies are performing credit, distressed, and longonly.Fee StructureBX receives an annual management fee based on apercentage of invested capital or net asset value. Feesare typically paid quarterly by investors in the amountoutlined in the contract over the lifetime of the fund.Negative performance does not impact the fee ratebut may reduce the total management fees paid.Additionally, if a fund achieves a minimum return level,a high water mark, or a hurdle provision during a setperiod, depending on the terms of the fund’sagreement, it may be eligible for incentive fees. Forexample, if the special limited partner of BREITaccomplishes 12.5% of its total return, it is subject to a5% hurdle amount and high water mark with a catchup. A high water mark is in place to ensure managersget compensated with a bonus when the mark isreached and the catch-up clause is to ensure thecompensation is a percentage of the whole fund, notjust the return. There are also advisory and transactionfees where some investment advisors receivecustomary fees on an acquisition or transaction.Co-InvestmentsBX and its personnel invest directly in the funds itsponsors and manages. With most funds, seniormanaging directors are required to fund a portion ofthe general partner capital commitments to the fund.In other cases, parts of the fund are offered to seniormanaging directors or other employees. Additionally,BX personnel and BX itself can co-invest, referred to asa side-by-side investment. These are investments inportfolio companies or other assets on the same termsas those acquired by the fund. The high number of coinvestment opportunities at various levels of BXindicates a high willingness of the company to alignitself with investor interests.EXHIBIT IIFee Revenue Breakdown (FY2018)1%10%3%44%42%Management FeesInvestment IncomeInterest & Div. IncomeIncentive FeesOtherSource(s): Company Filings6
January 27, 2020Solid as a Rock?Recent Company DevelopmentsIn April 2019, BX announced that it would switch froma partnership structure to a corporation structure,effective July 1, 2019. In the previous partnershipstructure, not all investors were able to invest in BX’sstock, due to certain restrictions on institutionalinvestors. Under the corporation structure, BX payscorporate taxes on its revenue in exchange forinvestors like index trackers and mutual funds to buythe stock. Investors such as mutual funds arebecoming more important because it manages moremoney. Since the U.S. corporate tax rate lowered in2018, the additional tax burden does not seem to havehad a substantial impact. Post-announcement, BXshares rose 10% due to the growth of BX’s investorpool, which is expected to drive greater companygrowth.On September 15, 2019, BX also announced itsacquisition of Dream Global for 6.2B. This all-cashtransaction allows BX to expand its office and logisticsassets in large markets. This is an important acquisitionbecause it enables BX to have a more diversifiedportfolio and grow its European portfolio significantly.Other major acquisitions are cited in Exhibit III.EXHIBIT IIIBlackstone’s Strategic AcquisitionsExpected Q1 2020To acquire Las Vegas Real Estate Assets for 4.6B in joint venture.Nov 18, 2019Acquired Bellagio Real Estate in Sale-Leaseback transaction for 4.3B in jointventure.Announced Oct 2, 2019To acquire Great Wolf Resorts for 2.9B in joint venture.Sept 26, 2019Acquired U.S. Logistics Assets for 5.9B.Source(s): Company Press Releases7
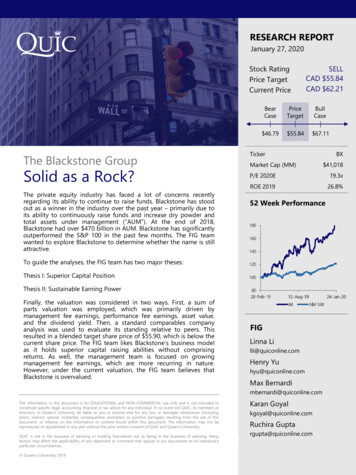
January 27, 2020Solid as a Rock?Investment Thesis I: Superior Capital PositionBX receives its capital from a variety of sources. BX isfunded by pension funds, sovereign wealth funds,central banks, and institutional investors. Aside fromoutside investments, BX generates liquidity fromannual cashflows, accumulated earnings in itsbusinesses, and the issuance of senior notes. As ofDecember 31, 2018, BX had 2.2B in cash andequivalents, 2.5B invested in corporate treasuries and 1.9B invested in BX Funds. BX had borrowed 3.5Bfrom bond issuances with an additional 1.6B ofundrawn capacity in its revolver. BX uses this capital togrow its current businesses, expand into new,complementary businesses, pay operating expenses,and fund capital expenditures of its businesses.Recently, BX has set records for capital raising. In 2019,BX has raised over 20.5B for its BREP IX Real EstateFund. This fund set records, as it is the largest realestate fund ever. BX also set a record for its BlackstoneCapital Partners VIII fund, raising 26.0B, the largestprivate equity fund ever. BX cites its scale as acompetitive advantage to be able to raise capital andpursue transactions. As of Q3, 2019, BX reported AUMof 554B with the goal of reaching 1T in AUM by2025. The FIG team views the 72.6B of perpetualcapital as a strength for BX, considering it has lockedin investors capital for an indefinite amount of time,allowing the company to pursue long-term growthstrategies without the risk of investors pulling out.BX has seen impressive returns compared to majorindices across all of its investment arms. Real Estatehas returned 16% since inception, Private Equity hasreturned 15%, Credit has returned 15% and HedgeFund Solutions has returned 6%. It is positive to notethat BX has invested the greatest amount of its capitalwhere it has generated the most returns historically.BX has identified that should industrial real estateprices increase in the North American market, wherethe company primarily invests, it could soften returnsin the long-run. BX is somewhat shielded from thehigh valuations in the private markets because thecompany is able to invest on a scale that other firmsare unable to match. As well, BX has acquired manypublicly traded REITs, given the higher capitalizationrates compared to private REITs.EXHIBIT VIIIBlackstone AUM by Sector ( B) 160 136 120 131 115 102 128 138 106 100 93 78 75 71 80 40 0Real EstateSource(s): Company Reports, S&P Capital IQPrivate Equity2018Hedge Fund Solutions2017Credit20168
January 27, 2020Solid as a Rock?Investment Thesis I: Superior Capital Position (Cont’d)BX has also been very active in returning capital toshareholders via share buybacks and dividends.Currently, BX has a 1B authorization to pursue sharebuybacks for the company. In 2019, the companyrepurchased approximately 500M of shares.The FIG team wanted to investigate the relationshipbetween capital and returns to determine whether theabundance of capital is hurting returns. To test thishypothesis, AUM was plotted against ROE to see ifreturns were decreasing as AUM increased. The FIGteam concluded that AUM growth was not an inhibitorof ROE as it had stayed relatively constant going backto 2013. The dip in 2015 was caused by globaluncertainty with Greece defaulting on its debt. At thesame time, BX was in the process of spinning off itsFinancial Advisory arm, which also had adverse affectson returns. As will be discussed later in the report,management has said that it plans on increasing thepercentage of fee-related earnings, which will have apositive impact on ROE.BX’s ability to raise capital is unparalleled in the assetmanagement industry. It is important that BX has theability to continue to make value-creating investmentsagainst a global backdrop that has been facingheadwinds. Current investment trends that BX sees asvaluable include global logistics. BX acquired 18.7B ofassets from GLP. The assets include 179M square feetof urban, infill logistics properties. Ken Caplan, CoHead of BX Real-Estate said in a press-release,“logistics is our highest-conviction global investmenttheme today, and we look forward to building on ourexisting portfolio to meet the growing e-commercedemand.” Another theme that BX views as positiverelates to the live entertainment industry. Asentertainment has gone increasingly digital, BX seesthis as an opportunity to invest in businesses that arerelatively cheap and will still be popular in the future.An example of a recent acquisitions is the saleleaseback of the Bellagio hotel in Las Vegas.Overall, BX’s size relative to its peers is what sets itapart and allows the firm to engage in largeracquisitions, where there are fewer firms who cancompete. Coupled with average capital investments of12 years and growing perpetual capital, BX seems wellpositioned to pursue attractive acquisitions for thelong-term.EXHIBIT IXROE Stays Consistent as AUM ( B) Grows 50030.0%25.0% 40020.0% 30015.0% 20010.0% 1005.0%201320142015Assets Under Management (LHS)201620172018Return on Equity (RHS)Source(s): Company Reports, S&P Capital IQ9
January 27, 2020Solid as a Rock?Investment Thesis II: Sustainable Earning PowerBX is often viewed as a “best-in-class” asset managerdue to its scale and diversified products. Furthermore,BX’s business has shifted significantly in the past fewyears, switching from a partnership structure to acorporation as well as shifting its revenue mix. Goingforward, there are two key questions related toBlackstone’s profitability: how sustainable areBlackstone’s earnings and is the company effectivelyimproving its operating efficiency?How Sustainable are Blackstone’s Earnings?The sustainability of BX’s earnings is important for twomain reasons. First, it is an indication of BX’s ability toconsistently return value to shareholders. Second, itcan be considered an indicator for BX’s continuedfundraising success and ability to return value to LPs.Each of BX’s revenue streams represents a differentapproach to achieving returns for investors andshareholders. This means that the company’s overallrevenue mix is also an indication of management’sstrategy for the company. Since its IPO in 2007, thecompany has been communicating that its strategy tocreating higher quality earnings is through building arecurring revenue model and increasing its fee-basedrevenue. The related revenues to fee-earning AUMrepresent more stable and predictable cash flows.Management’s plan is to grow fee-related earnings tonearly 70% of total income in the next five years from50% in 2018. Furthermore, BX’s average contractualcommitment has increased from eight years in 2013 totwelve years in 2018. This means that the company isbecoming more recession proof as the length of itscapital commitments from investors are more likely tosustain recessionary periods. This strategy ofincreasing earnings quality can be seen on BX’sincome statement as the proportion of fee-relatedearnings increases relative to other incentive-relatedearnings. This also increasingly ties BX’s earnings to itsAUM and ability to raise capital, both of which aredemonstrated strengths of the company. FIG believesthat the recession-proof nature of BX’s earnings andthe company’s strategy of tying its earnings to factorswithin its control are both indications of sustainableearning power. Management’s focus on fee-relatedearnings will stabilize the revenue model and createshareholder value.EXHIBIT XEXHIBIT XIRevenue Breakdown by Fee TypeTotal Fee-Earning AUM ( B)100%8%80%60%59%6%9%39%43%11%51%10%41% 300 20040%20% 40033%55%48%38%49% 1000%20142015Management FeesSource(s): Company Filings201620172018Performance FeesOther 0Source(s): Company Filings10
January 27, 2020Solid as a Rock?Investment Thesis II: Sustainable Earning Power (Cont’d)Is Blackstone Improving its Operating Efficiency?Risk ManagementOperating efficiency is an important measure of BX’searning sustainability for several reasons. First, itincreases the company’s ability to offer competitivefees. Second, greater operating efficiency implies morecapital available for investment activities, which impliesa greater return for shareholders and investors. Both ofthese effects of operational efficiency also affect BX’sability to raise capital.Aside from scale, BX’s returns also come from its abilityto manage external, economic-driven risk. Historically,the company’s value was based on multiple expansion,however increasingly, management is guiding thecompany towards earnings expansion due to inflatedvaluations. As a result, BX has been engaging invarious types of diversification across asset classes,geographies, and revenue types. Many of the newfunds raised in the past few years have a targetedstrategy of diversifying BX’s AUM to increase exposureto growth industries while also increasing its basemanagement revenue. FIG believes that this strategyfor growing earnings will create a sustainablecompetitive advantage for BX as its earnings becomeless volatile and more dependent on the firm’sinvestment capabilities. The nature of asset managerslike BX is that strong past performance leads tosuccessful fundraising. A higher level of fee-earningAUM means opportunity to improve earnings quality.As a result, BX is able to build a sustainablecompetitive moat.Since 2013, BX’s base management fee rate has stayedrelatively flat at 0.92%. This provides investors withpricing stability and makes consecutive capital raiseseasier as BX raised seven new funds between 2014 and2019. Because of pricing pressure from BX’scompetitors, its fee rate is not likely to change ascompetitors maintain similar rates. Furthermore, BX’sfee-related earnings margin has increase from 33% in2008 to 46% in 2018. Overall, BX has demonstrated itsability to improve operating efficiency.EXHIBIT XIIEXHIBIT XIIIFee-Related Earnings MarginsYoY Revenue Growth and AUM Growth50%40%32% 33%37%40% 40% 40%42%45% 46%30%40%30%20%10%20%0%10%(10%)20130%2010 2011 2012 2013 2014 2015 2016 2017 2018Source(s): Company Filings20142015Revenue Growth201620172018AUM GrowthSource(s): Company Filings11
January 27, 2020Solid as a Rock?Valuation and ConclusionBX’s earnings break down into several segments thatmust be considered differently. Therefore, the FIGteam decided to approach valuation using a sum ofparts model and a comparables company analysis. Themain parts in the model include management feeearnings, performance fee earnings and balance sheetvalue – each deserves a different terminal multiplebased on its characteristics. Management fee earningsrepresents the 0.92% fee that BX charges on its feeearning AUM. This segment is tied to AUM growth, butit is fairly predictable and stable, thus it received a 20xmultiple. Performance fee earnings are tied to BX’sability to generate superior returns, as the companyreceives 20% of any returns over 8%. As the companyscales, it could become harder to generate superiorreturns, thus this segment only received a 10x multiple.BX’s asset valuation represents 7.39 per share and theFIG team decided to value it at a safe 1x multiple.Combining this valuation work with the 2019 dividendyield of 3.4%, gives an implied upside of 6.9%.EXHIBIT XIVSum of Parts Valuation Output ( M)Share Price CalculationItemManagement Fee EarningsIncentive EarningsPerformance Fee EarningsTotal Other RevenuesTotal Other ExpensesPV of ProjectionsSum of ItemsShares OutstandingImplied Share Price2023E FigureImplied MultipleValue 1,912 60 1,779 516( 714)20.0x10.0x10.0x9.0x9.0x 38,233 595 17,790 4,646( 6,427) 13,448 68,2861,199 56.95EXHIBIT XVEXHIBIT XVIBalance Sheet ValuationSum of Parts SummarySum of Parts ValuationAssets:Investments 20,377Value of Earnings 56.95Balance Sheet Value 7.39Liabilities:Debt 11,514Implied Share Price 64.34Total 8,863Current Share Price 62.21Shares Outstanding1,199Dividend Yield3.4%Value Per Share 7.39Implied Upside6.9%12
January 27, 2020Solid as a Rock?Valuation and ConclusionA sensitivity analysis on the two main drivers of thesum of parts model was conducted. Management feeearnings and performance fee earnings made up 56%and 26% of the implied share price, respectively. Giventhis, it is reasonable to explore different scenarios.The second sensitivity analysis includes performancefee earnings and the implied multiple on that figure –everything else was held constant. There was a verylow variation in implied upside, ranging from (0.1%) to14.8%.The first sensitivity analysis includes management feeearnings and the implied multiple on that figure –everything else was held constant. There was areasonably low variation in implied upside, rangingfrom (7.7%) to 23.6%.Overall, the sensitivity analysis gives the FIG teamconfidence in the model based on the limited variationin returns. However, the return from the model is stillrelatively low and displays limited upside left in BX.EXHIBIT XVIISensitivity Analysis Against the Implied Multiple on Management Fee Earnings and Performance Fee nsitivitiesAfter-Tax Management Fee Earnings 2023E 1,712 1,812 1,912 2,012 2,112 55.30 56.63 57.96 59.30 60.63 58.15 59.65 61.15 62.65 64.16 61.01 62.68 64.34 66.01 67.68 63.86 65.70 67.53 69.37 71.20 66.72 68.72 70.72 72.72 vitiesAfter-Tax Performance Fee Earnings 2023E 1,579 1,679 1,779 1,879 1,979 60.04 60.70 61.37 62.04 62.70 61.35 62.10 62.85 63.60 64.35 62.67 63.50 64.34 65.17 66.01 63.99 64.90 65.82 66.74 67.66 65.30 66.30 67.30 68.31 ed UpsideAfter-Tax Management Fee Earnings 2023E 1,712 1,812 1,912 2,012 iple11.0x12.0xImplied UpsideAfter-Tax Performance Fee Earnings 2023E 1,579 1,679 1,779 1,879 .6%13.2%14.8%13
January 27, 2020Solid as a Rock?Valuation and ConclusionEXHIBIT XVIIIComparables C
total assets under management ("AUM"). At the end of 2018, Blackstone had over 470 billion in AUM. Blackstone has significantly outperformed the S&P 100 in the past few months. The FIG team . degrees of leverage, and pressure to make investments is a risk that the FIG team must be cautious of as investors in the asset manager space.