Transcription
DOI 10.1515/labmed-2013-0016Molekulargenetische und zytogenetische Diagnostik/ Molecular-Genetic and Cytogenetic DiagnosticsJ Lab Med 2013; 37(6): 305–315Redaktion: H.-G. KleinIna Vogla,*, Anna Benet-Pagèsa, Sebastian H. Ecka, Marius Kuhn, Sebastian Vosberg, PhilippA. Greif, Klaus H. Metzeler, Saskia Biskup, Clemens Müller-Reible and Hanns-Georg KleinApplications and data analysis of next-generationsequencingApplikationen und Datenanalyse von Next Generation SequencingAbstract: Over the past 6 years, next-generation sequencing (NGS) has been established as a valuable highthroughput method for research in molecular geneticsand has successfully been employed in the identification of rare and common genetic variations. Althoughthe high expectations regarding the discovery of newdiagnostic targets and an overall reduction of cost havebeen achieved, technological challenges in instrumenthandling, robustness of the chemistry, and data analysisneed to be overcome. Each workflow and sequencing platform have their particular problems and caveats, whichneed to be addressed. Regarding NGS, there is a varietyof different enrichment methods, sequencing devices, ortechnologies as well as a multitude of analyzing softwareproducts available. In this manuscript, the authors focuson challenges in data analysis when employing differenttarget enrichment methods and the best applications foreach of them.Keywords: bioinformatics; data analysis; moleculargenetic diagnostics; next-generation sequencing (NGS).Zusammenfassung: In den vergangenen 6 Jahren hatsich “next generation sequencing” (NGS) als wichtigeHochdurchsatz-Methode für die molekulargenetischeForschung etabliert und wurde erfolgreich zur Identifikation seltener und häufiger genetischer Varianteneingesetzt. Während die hohen Erwartungen hinsichtlich der Entdeckung neuer diagnostischer Zielstrukturen und einer Senkung der Kosten erreicht wurden,müssen etliche technologische Herausforderungenhinsichtlich Bedienung der Geräte, Robustheit der Chemie und Handhabung der Datenanalyse noch gemeistert werden. Jedes Anreicherungsverfahren und jedeSequenzierplattform haben ihre spezifischen Problemeund Herausforderungen, die man in Betracht ziehenmuss. In Bezug auf „next generation sequencing“ gibtes neben einer Anzahl verschiedener Anreicherungsmethoden, Sequenziergeräten und –techniken aucheine Vielzahl von unterschiedlicher Auswertesoftware.In diesem Artikel richten die Autoren ihr Augenmerk vorallem auf die Schwierigkeiten in der Datenanalyse derverschiedenen Anreichungsverfahren und deren bestmögliche Verwendung.Schlüsselwörter: Bioinformatik; Datenanalyse; molekulargenetische Diagnostik; next generation sequencing(NGS).Ina Vogl, Anna Benet-Pagès and Sebastian Eck contributed equallyto this study.*Correspondence: Dr. Ina Vogl, Center for Human Genetics andLaboratory Medicine Dr. Klein, Dr. Rost and Colleagues, LochamerStr. 29, 82152 Martinsried, Germany, Tel.: 49-89/895578-0,Fax: 49-89/895578-78, E-Mail: ina.vogl@medizinische-genetik.deSebastian H. Eck and Hanns-Georg Klein: Center for HumanGenetics and Laboratory Diagnostics Dr. Klein, Dr. Rost andColleagues, Martinsried, GermanyAnna Benet-Pagès: MGZ München, Medizinisch GenetischesZentrum München, Munich, GermanyMarius Kuhn: Genetikum, Ulm, GermanySebastian Vosberg: Clinical Cooperative Group ‘Leukemia’,Helmholtz Zentrum München, German Research Center forEnvironmental Health, Munich, Germany; and Laboratory ofLeukemia Diagnostics, Department of Medicine III, UniversitätMünchen, Munich, GermanyPhilipp A. Greif and Klaus H. Metzeler: Laboratory of LeukemiaDiagnostics, Department of Medicine III, Universität München,Munich, GermanySaskia Biskup: CeGaT GmbH, Tuebingen, GermanyClemens Müller-Reible: Institut für Humangenetik, Würzburg,GermanyaBereitgestellt von Universitaetsbibliothek der LMU MuenchenAngemeldetHeruntergeladen am 11.11.15 08:40
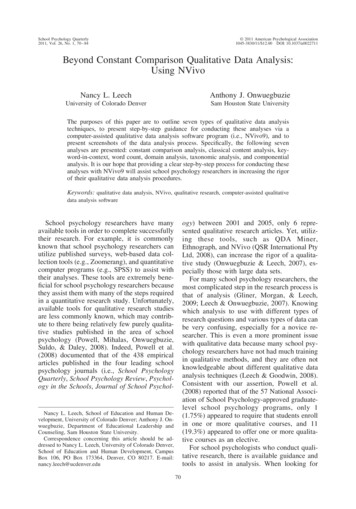
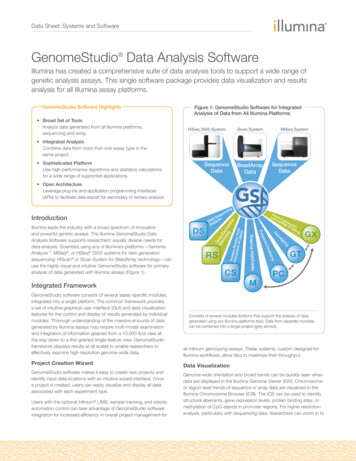
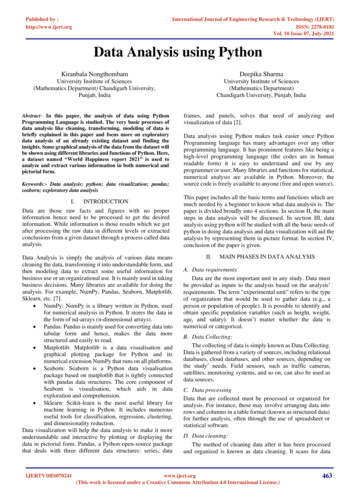
306Vogl et al.: Applications and data analysis of NGSIntroduction – basic data analysiscaveatsWith the emergence of next-generation sequencing (NGS),the analysis of huge amounts of data becomes increasinglyimportant. The quality and the validity of the detectedvariants vary greatly with the conditions of the librarypreparation process and the sequencing run. Additionally, data analysis has to be tailored to the specific workflow (amplicon based, enrichment based, whole exome,or genome) and the employed sequencing instruments.Each workflow and sequencing platforms have their particular problems and caveats, which need to be addressed.Platform-specific differences have been extensively discussed in previous publications of our group and others[1, 2]. In this work, we focus on challenges in data analysiswhen employing different target-enrichment methods.AlignmentThe basic task of sequence alignment is the mapping ofmillions of short read fragment from about 50 bp to 900 bpto reference sequences that may comprise the completehuman genome. Various issues, e.g., variation in basequality, repeat content, or other sequence properties, caninfluence the correct alignment. Consequently, it is important to choose the appropriate settings and the correct reference sequence for each method.Tag sequence and read trimmingNonspecific tag sequences generally have to be removedfrom the read. Particularly at the end of reads, the tagsequence may pose problems due to its variation inlength, possibly leading to false positives in the variantcall (Figure 1). Usually, software provide options forfinding this kind of sequences, which can be used to trimall kinds of adaptor sequences, tag sequences, and primersequences.Furthermore, read trimming after demultiplexing isrecommended due to possible lower base calling qualityin the first few bases and toward the end of the read.Different types of trimming can be performed based onquality scores, stretches of Ns and a specified number ofbases at either the 3′ or 5′ end of the reads.Repeat content and homologous regionsIn general, the exact target region needs to be validated,and homologous sequences like pseudogenes have to beexcluded from further analysis. These regions similar tothe region of interest (ROI) can cause false-positive resultsdue to misalignment of sequence reads. This can beavoided either by assay design or at the alignment level.In the case of amplicon-based target enrichment, similarto Sanger sequencing, target-specific primers need to bedesigned. Discrimination at the alignment level has to bemade for enrichment by oligonucleotide hybridizationand capturing. This requires software that is able to mapall given reads to the entire human genome. Additionally,a local alignment strategy (Smith-Waterman like algorithm [3, 4]) is needed for amplicon-based target enrichment, while a global alignment (Needleman-Wunsch-likealgorithm [5]) is required for enrichment by oligonucleotide hybridization and capturing. Moreover, the penaltysettings for mismatches and gaps of the algorithm area necessary tool to precisely discriminate homologoussequences. Another indication for homologous regionsare reads that can be mapped equally well to differentgenomic locations. We recommend a software that is ableto flag these reads as multiple matches and ignore themduring further analysis.Illumina paired-end sequencing (Illumina, San Diego,CA, USA [6]) offers an additional feature, which can beexploited to distinguish target gene regions from highlysimilar regions. Reads whose corresponding paired readcould not be mapped or was mapped outside the acceptable insert size parameters are marked as broken pair. Thiscan also be caused by large deletions, insertions, or anygenomic rearrangements. These reads should be ignoredduring subsequent analysis in a diagnostic setting andshould not contribute to variant calling (Figure 2).Variant calling454A BC Tag-1Sequenceable ampliconTag-2 BC 454BFigure 1 Schematic overview of a ROCHE454 amplicon structure.The 454A and 454B adaptors are usually already trimmed by the 454software.Variant calling is the next crucial step in the analysisof NGS data. Variants are identified by comparing thealigned short reads to the reference genome. The variantsmay either be causative for disease, or they may simplyrepresent benign genomic variation without a functionalBereitgestellt von Universitaetsbibliothek der LMU MuenchenAngemeldetHeruntergeladen am 11.11.15 08:40
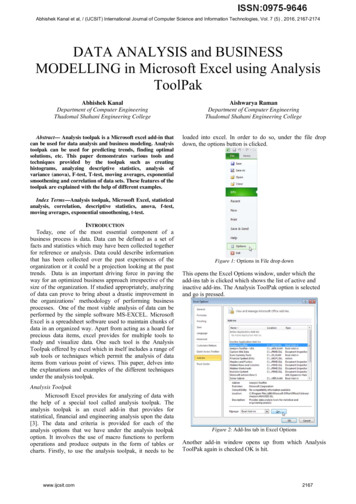
Vogl et al.: Applications and data analysis of NGS307Figure 2 Screenshots of the CLCbio Genomics Workbench.Reads mapped in pairs are indicated by blue, reads with unmapped paired-end read are indicated by red and green (broken pairs).(A) A false-positive variant call with the variant allele primarily present in broken reads is highlighted in green between the black lanes.(B) A validated variant call, with the variant allele primarily present in paired-end reads is highlighted in green.effect. The standard format for storing and exchangingsequence variation (including SNVs, indels, and largerstructural variations) is the so-called variant call format(VCF). The main challenge of variant call is to distinguishtrue genomic variants from sequencing errors and artifacts. The capability to accurately identify genomic variation is a crucial step in the detection of disease-associatedmutations. There are several factors that can interferewith variant detection. First, the presence of short insertions and deletions may lead to false-positive SNV identification, especially if the chosen alignment algorithmis unable to perform a gapped alignment. Second, PCRartifacts introduced during the library preparation maybe falsely called as variants. Last, sequencing qualitygradually degrades over the read. In consequence, thismeans that lower-quality bases tend to accumulate towardthe end of the read, which may lead to erroneous variantcalls [7].Forward reverse read balanceAs a true-positive variant would be expected to be readfrom both directions, the forward and reverse read balanceis a measure of the validity of a certain variant call. Ifthe variant is observed in just one type of the reads, thismight be an indication for a sequencing error or an artifact. Paired-end amplicon sequencing is a clear exceptionBereitgestellt von Universitaetsbibliothek der LMU MuenchenAngemeldetHeruntergeladen am 11.11.15 08:40
308Vogl et al.: Applications and data analysis of NGSto this, as reads may not overlap and are only sequencedfrom one direction.Insertions, deletions, and indelsThe detection of insertion, deletions, and indels, wherea deletion and an insertion occur at the same position,is more challenging than calling point mutations. Thedetectable length of these variations strongly depends onthe mapping algorithm used because the penalty scoresfor mismatches, insertions, and deletions vary betweenthem. Some software even made these parameters variable, so the user can influence the mapping. Small eventsof up to about 25 bp are able to be called on a sequencedependent manner; larger variants need more complexapproaches based on split read alignment or insert sizeanalysis [8]. In a diagnostic setting, we recommend morestandardized methods like multiplex ligation-dependentprobe amplification (MLPA) or array-comparative genomichybridization (aCGH) for detecting these larger variants.Data analysisRegarding NGS, there is a variety of different enrichmentmethods, sequencing devices, or technologies as well as amultitude of analyzing software products available. Mostapplications are compatible with each other, and it is upto the operator to choose them reasonably.Amplicon-based sequencing (TSCA)First, a multiplexing approach with the TruSeq CustomAmplicon (TSCA) Kit (Illumina, San Diego, CA, USA) wasused to sequence a gene panel of 17 genes known to causeearly infantile epileptic encephalopathy (EIEE), combinedwith sequencing on the Illumina MiSeq.The “TruSeq Amplicon” approach uses two independent left and right flanking oligonucleotides, which arehybridized to a genomic DNA template enabling polymerase extension and ligation. The flanking oligonucleotidescontain universal sequences for step-out PCR and incorporation of universal barcoded Illumina adapters [9]. Atotal of 370 oligonucleotide pairs for 188 coding exonsand bordering intronic regions, totaling approximately50 kb of cumulative sequence, was easily designed withthe Design Studio Web-based tool (Illumina, San Diego,CA, USA). Amplicons of 250 bp length were amplified ina single reaction, and library preparation was finishedwithin 2 days. Five of the 188 total exons failed the probedesign (2.6%). Redesign of the failed exons by slightlymodifying the chromosomal region did not improve theresults. The capture is very scalable, as all steps can beperformed in a 96-well PCR plate and can be semiautomated by liquid handling.A panel of samples with known point mutations, smalldeletions, and duplications were sequenced in a MiSeqrun that produced 5.5 Gb of sequence. Quality control(QC) of sequence data obtained from NGS technologies isextremely important for meaningful downstream analysis. The FASTQC Toolkit [10] was used for quality checkand filtering of high-quality data. The mean sequencingquality score (Q-score) was over 30 in 88.2% of the data.The Q-score is a prediction of the probability of an incorrect base call. A higher quality score implies that a basecall is more reliable and less likely to be incorrect [11]. Forbase calls with a Q-score of 30, one base call in 1000 ispredicted to be incorrect. We observed a marked drop-offquality (Q 20) in the last 50 to 80 bases of the read in someamplicons within each dataset. Another common artifactof the TruSeq Amplicon technology is the miscalling of thefirst two bases of the read, thus, increasing the numberof false positives. Different end trimming of the reads wasapplied on each data set. In a diagnostic setting, trimming of low-quality bases at both ends of the reads (meanQ 20) should be performed to achieve analysis of highquality data. Our analysis confirmed the variant in all butfour indels that could not be detected with the standardparameters.Mapping with the BWA software [12] showed veryequal distribution of mapped reads between samplesets. Mean coverage was 500-fold. Overall, 95% of thetarget sequence was covered at more than 40 . Sevenof 188 exons (3.7%) had a coverage between 20 to 40 ,and five exons (2.6%) failed amplification in most of thecases. These were very reproducible between samples.The minimal coverage for diagnostic criteria was 40 andQ 20. All fragments which did not achieve these criteriawere inspected manually, and an individual decision wastaken for subsequent analysis with Sanger sequencing. Asbase Q-score is often correlated with the complexity of theDNA sequence, manual inspection of the alignment witha visualization tool helps to estimate whether a calledvariant is a true- or a false- positive call. We observed ahigh rate of false-positive variants in the range of Q20to Q30. The major source of false-positive variants arisesthrough either miss-incorporation of bases during PCRamplification. When using a PCR-amplicon approach, allreads align with the same start location based on primerBereitgestellt von Universitaetsbibliothek der LMU MuenchenAngemeldetHeruntergeladen am 11.11.15 08:40
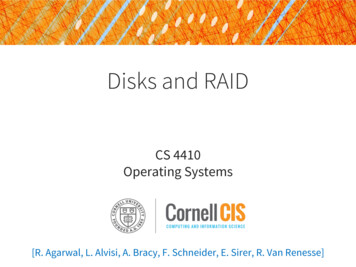
Vogl et al.: Applications and data analysis of NGSdesign and, therefore, extraction of PCR duplicate readscannot be performed. Designing overlapping PCR amplicons and accepting only consensus variant calls betweenamplified intervals may help to reduce this problem.Variant calls are first annotated with snpEff [9] andintersected with dbSNP [13], Exome Sequencing Project(ESP) [14], COSMIC data [15], and our in-house mutationdatabase. In addition, we use features from the AlamutHT software (Interactive Biosoftware, Rouen, France) tohelp with data interpretation and predict the mutationeffects on splice sites and protein function.Probe ligation-based DNA fragmentenrichment (HaloPlex )The HaloPlex Target Enrichment Kit provided by AgilentTechnologies (Agilent Technologies, CA, USA) was combined with sequencing on the Illumina MiSeq and dataanalysis with SeqNext of JSI medical systems (JSI medicalsystems, Kippenheim, Germany).The HaloPlex Target Enrichment System is based onprobe hybridization and circularization of enzymaticallydigested DNA. In contrast to other hybridization-basedmethods, each probe is an oligonucleotide designed tohybridize to both ends of a targeted DNA restriction fragment, so that the fragments are able to form circular DNAmolecules. A PCR step enables the enrichment of perfectlyligated and barcoded fragments plus an incorporation ofstandard Illumina paired-end sequencing motifs. The complete workflow to capture a target region from 1 to 500 kbtakes about 1 day and capturing a target region from 500 kbto 5 Mb about 1.5 days. This procedure results in millions offragments that are all constructed in the following order:Illumina sequencing motif – barcode sequence – universal primer sequence – region of interest – universal primersequence – Illumina sequencing motif [16].With this setup, it is achievable to produce about4 Gb of sequencing data with a 2 150 paired end run onthe MiSeq. On average, there are 80% of the data above aquality value of Q30, which demonstrates a good qualitycompared to competing devices. With the MiSeq Reporter,it is possible to generate demultiplexed raw data files(fastq format), which can be loaded directly into theSeqNext software. Alternatively, the data can be alignedto the human genome and, afterwards, imported into theSeqNext Software.Before the data is loaded into the program, the operator is able to make some preliminary settings. For example,poor quality data can be excluded from the analysis byspecifying a quality score threshold. This depends on the309quality score graph of each MiSeq run. The adapters canbe trimmed by entering the universal primer sequencein the corresponding field; bases between the universalprimer sequences are retained for further analysis. Additional bases at the fragment ends that do not match thereference can also be removed automatically by a userinput.Main preferences, which affect mutation calling andthe sorting of variants to distinct or not distinct (“other”)variations, can be done at the beginning of the settingtab. The user may enter an absolute coverage value ifthis coverage level has to be reached in both sequencingdirections together or separately. Positions with an absolute coverage below the entered value are not called. Furthermore, it is possible to specify a ratio read direction.Afterwards, the user has to select a minimal coverage line.Positions with coverage below the entered value will get awarning for this region. Variations that pass the main filtersettings will be classified into distinct or not distinct variations depending on variant frequency and user-definedthresholds. This enables the user to exclude mosaicism.Finally, the user can specify in which cases a variation ina homopolymeric region should be listed, in the distincttab or in the homopolymer tab.In this setting, we used an absolute coverage of five,a minimum coverage line of 20, and a minimal variantfrequency of 15%. The minimum base quality thresholdwas set at 20, yet an average base quality of the individual variant could not be displayed because this optionwas not available in the software. The SeqNext softwareannotates the detected variants with HGVS Nomenclature,even historical nomenclature, dbSNP rs-identifiers, and acustom-made database (editable and correlated with inhouse Sanger data).The resulting variants were filtered and screenedagainst previously detected variants, dbSNP, 1000Genomes [17], and HGMD professional (Biobase, Wolfenbuettel, Germany).Enrichment by oligonucleotide-basedsequencing (TSCE)For the (TSCE) library preparation, one standard workflowwas established and validated. Data analysis is performedwith the CLC Genomics Workbench (CLCbio, Aarhus,Denmark) and custom-developed Perl scripts (Figure 3).Using the Illumina Design Studio tool, a total of 5860probes were designed for a total of 5365 target regions.Success rate of the probes was estimated at 95%. Thelibrary preparation followed the Nextera EnrichmentBereitgestellt von Universitaetsbibliothek der LMU MuenchenAngemeldetHeruntergeladen am 11.11.15 08:40
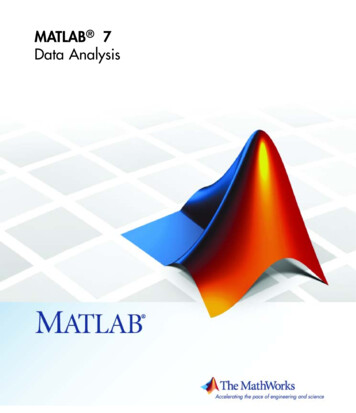
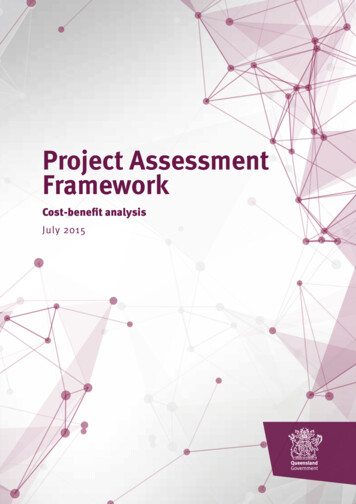
310Vogl et al.: Applications and data analysis of NGSMiSeqsequencingMappingVariant callingTarget regionstatisticsSelect targetregionsLow coverageexonsVariant filterSangersequencingCoverage 20VariantannotationInterpretationConfirmationwith Sanger SeqFigure 3 Analysis pipeline, schematic overview.Analysis steps are performed with the CLC Genomics Workbenchand custom developed Perl scripts. Exons with one or more lowcoverage bases ( 20) are reanalyzed by Sanger sequencing.Sample Preparation Guide and was finished within 2.5days. All steps are performed in a 96-well plate.The mapping was performed with the global alignment algorithm. Two to three percent of the readscould not be mapped to the human genomic referenceassembly (hg19), while 6–11% of the mapped reads wereso-called broken reads and, thus, ignored for variantcalling. The coverage was 20 in 93.52–96.73% of theregions. Of the exons, 105 of 4018 (2.6%) failed over allsamples. The probes fishing these regions need to beredesigned. We defined all bases with a coverage level of20 or more suitable for variant calling. In conclusion,we determined that an average coverage level of 80–120 is optimal for variant calling. While an increase in coverage to 200 does not yield significant improvementsin the number of bases covered at 20 or more, a dropin average coverage to 40 results in significantly lessbases covered at 20 .Validation experiments with a set of samples withknown mutations were used to adjust the final mappingparameters.For variant detection, the probabilistic variant callerimplemented in the CLCbio Genomics Workbench is used.The caller works with a Bayesian model and a maximumlikelihood algorithm to calculate the probabilities ofcandidate variants. All potential mutations and variants of unknown significance are confirmed by Sangersequencing. All variants above a Q-Value of 27 have beenconfirmed by Sanger sequencing, while no variant witha Q-Value below 24 could be confirmed. Variants with aQ-Value between 25 and 27 are in a twilight zone. In thesecases, the quality of the reference base and the surrounding bases and the region characteristics (e.g., homopolymer region) are decisive to estimate whether it is a truevariant or a false-positive call (Figure 4). The variant callis annotated with GTF-Files for exon numbering, codingregion change, and gene information. The Genome Trax module of Biobase can be used in the CLCbio software forannotating all variants with additional information likeHGMD , COSMIC database [15], dbNSFP [18], PGX, GWASdata, Online Mendelian Inheritance in Man (OMIM , Baltimore, MD, USA) information, and experimentally verifiedtranscription factor-binding sites (TFBS). On the last step,the information from dbSNP common flagged and theentire dbSNP is added. This allows a very specific filteringfor any individual indication. For instance, in the case ofdominant disorders, the dbSNP common will be filteredaway, while for recessive disorders, the filtering of theknown SNPs has to be adjusted to the incidence rate ofthe analyzed disease. This list of variants will be inspectedfor the interpretation of the result. The procedure is asfollows: if a variant is found, which is already reported inliterature and even in the HGMD database or any otherdisease-related database (e.g., Leiden Open VariationDatabase (LOVD [19]), then, the variant is confirmed withSanger sequencing. If a variant with unknown significance is found, in silico prediction tools like Pholyphen2[20], MutationTaster [21], SIFT [22], etc., will be used toestimate the pathogenicity, and all putative disease-causing mutations are confirmed by Sanger sequencing. If noFigure 4 True insertion of a Cytosin in a homopolymer region.Bereitgestellt von Universitaetsbibliothek der LMU MuenchenAngemeldetHeruntergeladen am 11.11.15 08:40
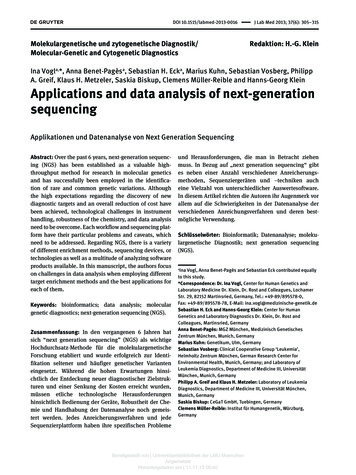
Vogl et al.: Applications and data analysis of NGScausative variant is found, all regions, which are below20 coverage, need to be sequenced by Sanger.Whole-exome-based sequencing (WES)For whole-exome sequencing data analysis, severalmapping, variant calling, and annotation workflows areapplied. The filtering strategy mainly consists of two stages,a variant-based and a gene annotation-based filtering. Thefirst filtering step includes a genotype and a populationfrequency filter. The genotype filter removes all variantsthat are not in accordance with the clinical history and thepedigree information. The population frequency filter thenremoves all frequent variants based on the global allelefrequency (GAF) score from the 1000 Genomes Projectand an in-house allele frequency database. In this secondfiltering step, all remaining variants are linked to expertcurated and literature data mining-based disease annotations (Figure 5). With this strategy and MESH diseaseontologies, it is possible to link causative variants to theclinical diagnoses. Finally, the data has to be visualized tobe interpreted, validated, and reported to the requestingphysician. Important parameters to follow-up on a variantare covered over this particular variant, genotype quality(GQ), protein effect, the gene and exon(s) affected, or thepublications supporting the gene-disease link and segregation analysis within the family.Taken together, pedigree analyses in combination with clinical information, background populationFiltering of the variantsAllGene body (1.7)Deleterious (23.6)GT (23.5)MAF (4.5)Disease (70)W1W1W3Figure 5 Filtering of variants in three different datasets (log scale).For each filtering step the number of remaining variants and thefilter factor is given. The filters are (i) gene body (variants thatoverlap with a transcript), (ii) deleterious (variants that alter theprotein sequence or hit a canonical splice-site), (iii) GT (genotypefilter derived from the medical report), (iv) MAF (1000 genomesbackground filter), and (v) disease (filter for the primary disease andMESH parents from the medical report).311frequencies, and disease annotations provide a powerfulinformation basis to find the needle in the haystack.ApplicationsThe use of NGS technologies has been mainly limited toresearch facilities, but new sequencing devices with alower throughput and a high quality of sequencing dataenables now the application of these technologies ingenetic diagnostics. By using NGS, it is possible to sequenceseveral genes simultaneously, in a cost-effective and timesaving manner. Especially multigene panel diagnostic isa very powerful tool to identify the causative mutationfor heritable diseases that are genetically heterogeneousand can only be assigned to a group of diseases becauseof their clinical variability, for example, muscular disorders or neuropathies. A variety of enrichment methodsis available on the market to design custom gene panels.Each laboratory should decide depending not only on thedisease/gene panel characteristics but also on the laboratory facilities, which is the best approach. In this section,we will discuss the experiences with the amplicon-basedTruSeq and HaloPlex systems, the custom enrichmentbased approach for larger gene panels (TruSeq customenrichment, TSCE), and whole-exome sequencing.Amplicon based/HaloPlex TruSeq Amplicon and HaloPlex products have severaladvantages in sample preparation compared to otherenrichment methods. Both methods combine the speedof PCR with the sensitivity of hybridization providinga robust solution for targeting smaller capture regionsin 2 days. Another positive aspect is that standard laboratory devices and no additional laboratory equipmentare needed. Furthermore, the operator is able to followalways the same laboratory protocol, so it is possible tocombine different gene panels in one enrichment step.Robotics is not necessary to complete the sample preparation, but protocols can be easily automated. Our experiences showed that automation of the protocols notonly increases reproducibility between samples but alsoenables higher throughput, and it is less time-consumingand avoids sample mix-up [2].We recommend using these approaches for smallgene panels. Our design for the TSCA kit contains 50 kbof cumulative sequence, but new versions of the TSCA kitcan cover up to 650 kb with 1536 amplicons per reaction.Bereitgestellt von Universitaetsbibliothek der LMU MuenchenAngemeldetHeruntergeladen am 11.11.15 08:40
312Vogl et al.: Applications and data analysis of NGSHowever, this is a multiplex approach, and raising thenumber of oligonucleotid primer pairs might decrease theoverall efficiency of PCR amplification. The HaloPlex has two different protocols for 1 to 500 kb and 500 kb to5 Mb. So far, we tested different panel sizes with 170-, 217-,and 615-kb target region.Both kits, TruSeq Amplicon and HaloPlex , supportmultiplexing of up to 96 different samples. In combinationwith a MiSeq sequencer, we can parallel sequence severalpatients in a 2 150-bp run in a single standard flow cell(28 tiles). Recently, Illumina has launched the Nano(eight tiles) and Micro (two tiles) flow cells, which differin output and number of tiles imaged. This offers the usermore flexibility when planning the number of samples tobe sequenced in a run. The number of sequencing cycleswhen using an amplicon approach will depend on theamplicon length. In contrast to shot-gut library sequencing, which accepts different sequencing read lengths, thenumber of cycles when sequencing amplicon productshas to be maintained for the same gene panel unless thelength of the amplicon is changed in
First, a multiplexing approach with the TruSeq Custom Amplicon (TSCA) Kit (Illumina, San Diego, CA, USA) was used to sequence a gene panel of 17 genes known to cause early infantile epileptic encephalopathy (EIEE), combined with sequencing on the Illumina MiSeq. The "TruSeq Amplicon" approach uses two independ - ent left and right flanking oligonucleotides, which are hybridized to a .