Transcription
Communitiesand Diamonds2015 Annual Report of the Government of the Northwest Territoriesunder the Ekati, Diavik and Snap Lake Socio-Economic AgreementsPREPARED BYIndustry, Tourism and InvestmentEducation, Culture and EmploymentFinanceHealth and Social ServicesJusticeNWT Bureau of StatisticsNWT Housing Corporation
To request this complete document in French please call theDepartment of Industry, Tourism and Investment at 867-767-9204.Si vous souhaitez obtenir le présent document en français dans sonintégralité, communiquez avec le ministère de l’Industrie, du Tourismeet de l’Investissement en composant le 867-767-9204.
2015Communities & Diamonds5Executive SummaryThe Communities and Diamonds Annual Report is produced partly in fulfillment of commitments made by theGovernment of the Northwest Territories (GNWT) in Socio-Economic Agreements (SEAs) with the mining companiesoperating in the Northwest Territories (NWT). There are currently two operating mines, one mine under construction,and one mine under care and maintainance. The operating mines are the Dominion Diamond Corporation Ekati Mineand the Diavik Diamond Mine. Gahcho Kue is currently under construction and the De Beers Snap Lake Mine went intocare and maintainance in December 2015.The purpose of the Communities and Diamonds Report is to determine if mine activity may be affecting residents ofYellowknife and seven Small Local Communities (SLCs) in the NWT by examining socio-economic indicators for changessince 1996, when the first mine, Ekati, began construction. The seven SLCs are Behchokò , Detah, Gamètì, Łutselk’e, Ndilo ,Wekweètì, and Whatì. The report examines the data based on the GNWT Sustainable Development Policy five-pointframework:1. community, family and individual well-being;2. cultural well-being and traditional economy;3. non-traditional economy;4. net effect on government; and5. sustainable development.Overall, the 2015 Communities and Diamonds Report highlights that the mining industry has provided employment andeconomic opportunities for businesses and residents across the NWT. Since the start of construction of Ekati, employmenthas increased, residents have less reliance on income assistance, education levels are improving, and businesses are seeingsignificant benefits. While challenges still exist, the report provides an outline of areas where improvements can be madeto benefit NWT communities. Areas of community, family and individual well-being that have seen positive change inboth Yellowknife and the seven SLCs included a lower birth rate for teens, fewer injuries and poisonings, and a decreasein the number of tuberculosis cases. Yellowknife also saw an increase to the number of households owned, while SLCs sawimprovements to households in core needs, and fewer households with six or more people. Negative impacts observedfor Yellowknife and SLCs were increases in the number of sexually transmitted infections, as well as increases in multiplecrime indicators. SLCs saw increases to the potential years of life lost, and increases in both violent and federal statutecrimes that were not seen in Yellowknife.Cultural well-being and traditional economy indicators did not change in Yellowknife, while SLCs saw an increase in thenumber of people hunting and fishing, but a decrease in the number of people speaking Aboriginal languages.Non-traditional economy saw increases to average income and education metrics in both Yellowknife and the SLCs.Yellowknife showed decreases to both employment and participation, while the SLCs showed increases in these samecategories. As well, SLCs showed less use of income assistance and lower levels of unemployment.The net effect on government has been an increase in demands for government programs and services. Examples ofthese include the addition and maintenance of infrastructure (e.g. roads), the need to address social stresses caused bydevelopment and income growth, the need to track environmental effects, and the need to invest in areas such as trainingto better equip Northerners to acquire jobs and fill business demand around them. To address these impacts, the GNWTmakes strategic investments to realize the greatest benefit from development and mitigate adverse impacts. Resourcedevelopment also brings money to the GNWT through property, fuel and corporate income taxes paid by the mines. In2015, the GNWT shared 50 percent of resource royalties from the diamond mines with Aboriginal governments.
5Executive Summary8IntroductionBackground information Purpose of the report CommunitiesChoice of indicators Data sources12 Possible Effects of Mine ActivityCultural Well-Being &14 Traditional EconomyFur sales Trappers Aboriginal language18 WagesIncome assistance Employment Unemployment24Health & FamiliesPotential years of life lost Suicide rate Teen births Single-parentfamilies Injuries Sexually transmitted infections TuberculosisChildren receiving services Family violence36 Crime40 HousingCore need Ownership CrowdingTable of Contents19 Education
Table of ContentsBusiness 44NWT gross domestic product Mineral development strategyEconomic opportunities strategyNet Effect on Government 48Glossary 50Words to knowAppendix A 52Company predictions on mine activityAppendix B 58Industrial, social and political eventsAppendix CData tables See attached disk on back cover of the reportCover Photo Credit: Rashaad Bhamjee
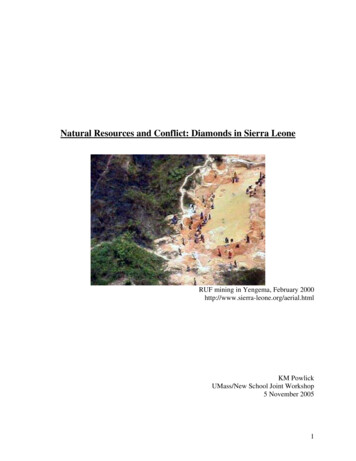
82015Communities & DiamondsBackground InformationThis report is prepared in fulfillment of a commitment made by the Government of the Northwest Territories(GNWT) in the Socio-Economic Agreements (SEAs) that it has with mining companies in the NorthwestTerritories (NWT). These include: Dominion Diamond Corporation, Ekati Mine (Ekati); Diavik DiamondMine (Diavik); De Beers Snap Lake Mine (Snap Lake); and Gahcho Kué.SEAs are follow-up programs to environmental assessments. In an environmental assessment, a developermust predict what effect the proposed mine may have on the people and communities of the NWT. Underthe SEA, the GNWT monitors the effects of the mines and works to ensure SEA commitments are met andin line with the original predictions.Credit: Diavik Diamond Mines
2015Communities & Diamonds9Purpose of the ReportThis report examines a number of socio-economic variables to see if, and how much, each has changed since diamondmining began in 1996. The relative changes in indicators are presented on page 13.CommunitiesThis report provides data for the city of Yellowknife and seven smaller NWT communities. The seven smaller communitiesare Behchokò , Detah, Gamèti, Łutselk’e, Ndilo , Wekweèti, and Whatì. The map below displays these small local communities(SLCs) with green flags. The charts in the report always represent the SLCs with the same shade of green, Yellowknife withyellow, other NWT communities with dark grey, and the NWT as a whole with blue.
10Communities & Diamonds2015Choice of IndicatorsAn indicator is a measure that shows the state of something. After public consultation a set of indicators was developedwhich relate to the possible effects we may see from mining. These indicators were negotiated into the SEA. There havebeen some changes over time but the basic list of indicators applies broadly to all mine development.The GNWT promotes and supports responsible development of natural resources for the social and economic benefit ofall NWT residents. Using the GNWT Sustainable Development Policy 53.02 the GNWT looks at sustainable economicdevelopment through the lens of a five-point framework. The five groups are:1. community, family and individual well-being;2. cultural well-being and traditional economy;3. non-traditional economy;4. net effect on government; and5. sustainable development.Data SourcesThe data used for the indicators in this report has come from various sources including: GNWT, Royal Canadian MountedPolice, NWT Bureau of Statistics, Statistics Canada and other sources. Due to the dates surveys are conducted and thetime before survey data is released, not all data is current at time of publication.Both N’dilo and the North Slave Métis Alliance are communities under the SEA. However, data is not always available forthese groups. Appendix C includes any data that is available for those communities. The data source for each indicator isshown below each graph in the report and below each table in Appendix C. Appendix C includes all data that was used inthis report, community-level data, where available, as well as some other indicators not presented in the report.Credit: Rashaad Bhamjee
2015Communities & Diamonds11Indicators Identified in the SEAsThe table below lists the indicators required under each mine’s SEA, grouped under the five-point framework.EkatiDiavikSnap LakePageCommunity, Family and Individual Wellnessnumber of potential years of life lostnumber of injuries24age standardized injuriesage standardized injuriesnumber of suicidesnumber of communicable diseases2925communicable diseases (sexuallytransmitted infections, tuberculosis)communicable diseases (sexuallytransmitted infections, tuberculosis)number of teen births3026single-parent families/lone-parentfamilieslone-parent familiesnumber of children receivingserviceschildren in carechildren in carenumber of complaints of familyviolencenumber of women and childrenreferred to sheltersnumber of women and childrenreferred to sheltersnumber of alcohol and drug-relatedcrimespolice-reported crimes: violent,property, drug-related, otherpolice-reported crimes: violent,property, drug-related, other27323536number of property crimeshousing indicators40Cultural Well-Being and Traditional Economyratio of home language use tomother tongue, by major age groupratio of home language use tomother tongue, by major age grouppercentage of workforce-aged group percentage of workforce-aged groupengaged in traditional activitiesengaged in traditional activities1615Non-Traditional Economyaverage income of residentsaverage incomeproportion of high-income earnersnumber of social assistance casessocial assistance casesincome support cases18employment participation rate23employment levels and participation employmenthigh school completionApp. Cnumber of people 15 with less than number of people 15 with a highGrade 9school diploma20registered businesses, bankruptciesand start-upsN/Aregistered businesses, bankruptciesand start-upsSustainable Developmentsecondary industry data andinitiativesN/Anet effects on government of theproject48Net Effect on Government
122015Communities & DiamondsPossible Effects of Mine ActivityThe mining industry has provided employment and economic opportunities for businesses and residentsacross the NWT. Since the first diamond mine began production in 1998, employment has increased, residentsare less reliant on income assistance, education levels have improved, and businesses have seen significantbenefits. In 2014, the three operating diamond mines contributed over 3,200 person-years of employmentand contributed over 653 million to Northern businesses, of which, about 33% were to Northern Aboriginalbusinesses.The table to the right shows the indicators in this report and how they have changed since 1996 when the firstdiamond mine began construction. These changes may result from the mines alone, or from a combinationof mines and other factors.Credit: Rashaad Bhamjee
2015Communities & DiamondsRed arrows () indicate changes viewed as negative. Green arrows (significant change ocurred then (/) was used.13) indicate changes viewed as positive. If noIndicatorsDirection of ChangeSmall Local CommunitiesYellowknifeN/AN/ACultural Well-Being and Traditional EconomyFigures 1-3 : Fur salesFigure 4: Aboriginal Language Use (Age 15-24)/Figure 5: Aboriginal Language Use (Age 15 )/Non-Traditional EconomyFigure 6: Income Assistance/Figure 7: Less than Grade 9 EducationFigure 8: Greater than High School EducationFigure 9: Employment RateFigure 10: Unemployment Rate/Figure 11: Participation RateCommunity, Family and Individual Well-BeingFigure 12: Potential Years of Life LostFigure 13: Suicides///N/AN/AN/AN/A//Figure 22: Women and Children in SheltersN/AN/AFigure 23: Shelter Bed DaysN/AN/AFigure 14: Birth Rate for Teen FemalesFigure 15: Single-Parent FamiliesFigure 16: Physician Diagnosed Injuries & PoisoningsFigure 17: Nurse Diagnosed Injuries & PoisoningsFigure 18: Sexually Transmitted InfectionsFigure 19: Tuberculosis CasesFigure 20: Children Receiving ServicesFigure 21: Spousal AssaultFigure 24: Total CrimesFigure 25: Violent Crimes/Figure 26: ‘Other’ Criminal Code CrimesFigure 27: Property CrimesFigure 28: Federal Statute Crimes/Figure 29: Household in Core NeedFigure 30: Households Owned/Figure 31: Household Crowding/BusinessFigure 32: NWT GDP SectorsN/AN/AFigure 33: Trend in NWT GDP SectorsN/AN/AFigure 34: Revenue DistributionN/AN/A*Changes to reported indicators from the 2014 report are due to discontinued data and requests for new indicators from communities
142015Communities & DiamondsTraditional EconomyGenuine Mackenzie Valley Fur ProgramThe Genuine Mackenzie Valley Fur (GMVF) Program provides NWT Trappers with “one window” access to theinternational fur auction market for fur harvested in the NWT. In addition, the Program actively markets and promotesfur at international venues through partnerships with other harvesting jurisdictions and the private sector.Figure 1: NWT fur sale summary - 2014-2015Fur Sale 246,499Inuvik 180,860 236,430 36,490 9,450 30,730 10,570 139,560 36,818 214,318 22,635 176,977South Slave 13,320 34,030 166,968Dehcho 52,947 54,724 243,758SahtuNorth SlaveFur Bonus Grubstake 307,932 334,936
2015Communities & Diamonds15195144South SlaveNorth Slave112104DehchoSahtuInuvik99Figure 2: Number of trappers - 2014-2015Figure 3: Annual fur sales 2.5 M 2.0 M 1.5 M 1.0 2007/082006/072005/062004/052003/042002/032001/02 0.5 M
162015Communities & DiamondsAboriginal LanguagesAboriginal mine employees are immersed in English while they work and live on-site which may affect the use and healthof Aboriginal languages in communities. Generally, use of Aboriginal languages has been declining in the NWT sincebefore the diamond mines started up.Figure 4 describes the percent of Aboriginal persons aged 15 to 24 that are able to speak an Aboriginal language. Informationabout this group is a good indicator as to whether the languages are being passed along.Figure 4: Percent of Aboriginal Persons Age 15-24 who can speak an Aboriginal YellowknifeOther 7200920112013Sources: 1989, 1994 and 1999 NWT Labour Force Survey; 2004, 2009 and 2014 NWT Community Survey; 2006 StatisticsCanada Census; 2011 Statistics Canada National Household Survey.
2015Communities & Diamonds17Figure 5: Percent of Aboriginal Persons 15 & Older who can speak an Aboriginal Language, 1989 - 2014100%90%SLCs80%70%60%50%40%NWTOther 001200320052007200920112013Sources: 1989, 1994 and 1999 NWT Labour Force Survey; 2004, 2009 and 2014 NWT Community Survey; 2006 StatisticsCanada Census; 2011 Statistics Canada National Household Survey.The information in Figure 5 suggests a decline in the use of Aboriginal languages in the SLCs but a slight increase in otherNWT communities and Yellowknife. Many factors affect the use of language, therefore there can be no clear evidencethat the mines have caused a decline in Aboriginal language use because it was declining in the SLCs and other NWTcommunities before the start-up of the mines.Credit: Rashaad Bhamjee
182015Communities & DiamondsWagesIncome AssistanceThe GNWT’s Income Assistance (IA) Program helps people when they do not have enough money each month to payfor basic needs like food, shelter and utilities. The IA program also provides enhanced benefits for longer-term supports,such as clothing or disability allowance. The amount of support available to individuals is based on overall needs, whereone lives, the size of the family, and the ability to provide his/her own financial resources. The program encourages peopleto make productive choices, allowing them to achieve self-reliance. A number of improvements have been made to IAwith the intent to create stronger programs, with clear policies that benefit Northerners. Food and incidental benefitshave increased to allow for the purchase of healthy foods in all Northwest Territories communities. Providing assistancefor paying the actual cost of fuel and utilities for eligible IA clients helps ensure clients stay current with the cost of living.Figure 6 illustrates that there has been an upward trend in the number of average monthly IA cases in SLCs, Yellowknifeand the other NWT communities. IA cases dropped significantly around the time the mines started and while the averagenumber of cases has increased in recent years, pre-mine levels have not been reached.Figure 6: Average Monthly Income Assistance Rate per 1,000 Persons, 1996 - 201414012010080SLCs60Other *2010*2012*2014*Sources: Education, Culture & Employment; NWT Bureau of Statistics.* Due to Income assistance program changes in 2007, caution should be used when comparing with pre 2007 dataNotes: Rates before 1996 are not calculated since annual population is not available.
2015Communities & Diamonds19Education“High school completion” means people who have a high school or grade 12 diploma or a General Education Diploma(GED). “Greater than high school” refers to people who have a trade certificate, college diploma, or university degree.When considering “Population with less than Grade 9 , those who are aged 15 and older with less than Grade 9 arecounted along with the people who are still in Grade 9.Overall the NWT population with less than Grade 9 education has declined significantly since 1989. It is unlikely thatthis change is due completely to the operating diamond mines as there were some changes in the delivery of educationprograms throughout the NWT. For example, grade extensions were offered in the smaller communities starting in thelate 1990s. This led to an increase in the number of people completing Grade 9 and moving on to high school which hasresulted in more high school graduates.In the SLCs, Yellowknife, and the other NWT communities, the percent of the population with a less than Grade 9education declined sharply between 1989 and 1994. This coincided with the addition of high school programs in a numberof small community schools. The downward trend has continued.Figure 7: Percent of Population with less than Grade 9 Education, 1989 - 201470%60%50%40%30%20%SLCsOther 200320052007200920112013
202015Communities & DiamondsFigure 8: Percent of Population with High School or Greater, 1989 - 2014100%90%YellowknifeCanada80%NWT70%Other 92001200320052007200920112013There has been a consistent effort on the part of the GNWT and its partners, including the mining industry and the MineTraining Society, to help people become aware of the value of education. The mining industry in particular has done a greatdeal to highlight economic opportunities and link education to employment. Companies have offered Northern studentsincentives to stay in school and pursue education through scholarships, training programs and summer employment.Strong partnerships between government, industry and training providers continue to help raise education levels in theNWT.Figure 8 describes the population with high school or greater. In the SLCs there was a drop in high school completion ratesin 2009, which rebounded in 2011 and continued to rise through 2014. In Yellowknife and the other NWT communities thepercent of the population with a high school or higher education has continued to rise since 1991 with minor fluctuations.The NWT population with high school or higher education has increased since start-up of the diamond mines.
2015Communities & Diamonds21EmploymentTo describe the job situation in the NWT three rates are used:1. Employment rate – the percentage of people age 15 and older who have jobs;2. Unemployment rate – the percentage of the labour force who are looking for work but not working; and3. Participation rate – the percentage of people age 15 and over who are working or looking for work.Employment at the mines is a contributing factor to the employment, participation, and the unemployment rates acrossthe NWT. Job data comes from NWT surveys and from the Statistics Canada census. This information is collected atdifferent times of the year which explains some of the change from one data point to the next.As illustrated in Figure 9, employment trends in the SLCs show that employment is higher than it was before the diamondmine start-ups whereas the other NWT communities trend has been relatively stable. In Yellowknife employment wasdecreasing in the before-mine phase and although it has remained relatively stable since 1996, there has been a slightdecline in employment since 2011.The employment rate depends on a variety of factors which are determined by the economy as well as the local employmentsituation.Figure 9: Employment Rate, 1989 - 201490%80%Yellowknife70%NWTCanadaOther 92001200320052007200920112013Sources: 1989, 1994 and 1999 NWT Labour Force Survey; 1996, 2001 & 2006 Statistics Canada Census; 2004, 2009 and2014 NWT Community Survey: 2011 Statistics Canada National Household Survey.Notes: Comparisons between the labour force survey (LFS) completed by the Bureau of Statistics and the Censusshould be done with caution. The LFS and NWT Community Survey were completed during the January-March period.The Census was done in May and June. Census indicators are often higher due to seasonal employment activities.
222015Communities & DiamondsUnemploymentFigure 10 shows, that overall, the unemployment rate has been decreasing since 1989. While there has been some variabilityover the years, the unemployment rate is lower than before mine start-ups.In the SLCs, despite yearly fluctuations, the unemployment rate has decreased significantly since mine start-ups. Thistrend is consistent with the other NWT communities experiencing a decrease in the unemployment rate with minorchanges over the years. In Yellowknife, with the exception of a peak in 1999, the unemployment rate remained relativelyunchanged since mine start-ups.It is likely that the presence of the mines, as well as the increase in education levels, were contributing factors to thechanges in the unemployment rate.Figure 10: Unemployment Rate, 1989 - 201450%45%40%35%SLCs30%25%20%15%Other 19992001200320052007200920112013Source: 1989, 1994 and 1999 NWT Labour Force Survey; 1996, 2001 and 2006 Statistics CanadaCensus; 2004, 2009 and 2014 NWT Community Survey: 2011 Statistics Canada National Household.Notes: Comparisons between the labour force survey (LFS) completed by the Bureau of Statistics and the Censusshould be done with caution. The LFS and NWT Community Survey were completed during the January-March period.The Census was done in May and June. Census indicators are often higher due to seasonal employment activities.
2015Communities & Diamonds23Participation RateFigure 11: Participation Rate, 1989 - 2014100%90%80%YellowknifeNWTOther 95199719992001200320052007200920112013Sources: 1989, 1994 and 1999 NWT Labour Force Survey; 1996, 2001 & 2006 Statistics Canada Census; 2004, 2009 and2014 NWT Community Survey: 2011 Statistics Canada National Household Survey.Notes: Comparisons between the labour force survey (LFS) completed by the Bureau of Statistics and the Censusshould be done with caution. The LFS and NWT Community Survey were completed during the January-March period.The Census was done in May and June. Census indicators are often higher due to seasonal employment activities.As shown in Figure 11, in the SLCs the participation rate has increased from below 50% to above 60%, which means thatmore people are working or looking for work. There has been minimal variability in the participation rate since minestart-ups. In both the Yellowknife and the other NWT communities the participation rate has been decreasing since minestart-ups.
242015Communities & DiamondsHealth and WellnessPotential Years of Life LostPotential Years of Life Lost (PYLL) shows early deaths1. PYLL helps demonstrate the health, well-being, and lifestylechoices that people are making.There can be large changes in PYLL rates from one year to the next. To highlight trends more clearly, PYLL is shown as athree-year average.Prior to the mines the PYLL rate in the SLCs was going down sharply, and has continued to remain within historicalboundaries. At this time mining does not seem to have an effect on the PYLL rate in the SLCs. The trend of PYLL in theSLCs is likely due to a natural cycle that cannot be directly attributed to mining. PYLL has remained lower in SLCs thanin other NWT communities since mining activity began.Since 1996, the PYLL rate in Yellowknife has been both higher and lower than in the pre-mine period. It seems to followa natural cycle that may be unrelated to mining activity.1The PYLL for a population is the total of all the years of life lost by those who died before reaching the age of 75, the average age of life expectancy.Figure 12: Potential Years of Life Lost ( 75 Years), Rate Per 1,000 Persons, Three-Year Average120100SLCsOther 2/042004/062006/082008/10
2015Communities & Diamonds25Suicide RateWhile there is no singular cause, suicide is often linked to both social issues and mental health problems includingdepression, divorce or separation, and drug abuse. The table below shows suicide deaths.Three-year averages are used to smooth out the year-to-year changes seen with small numbers; readers should still viewthe trend lines with caution, however, as some areas may only have two or three suicides in a given three-year phase. Thismakes it hard to judge the data and any trends it may show.The suicide rate had been going down in small local communities during the pre-mine period. The overall trend since1995/1997 has been an increase, and in 2004/2006, the suicide rate in small local communities became higher than it hadbeen in the pre-mine phase. Since 2003/2005, it has been higher than the suicide rate in Yellowknife.For much of the time since 1996, the suicide rate in Yellowknife has been no higher or lower than it was in the before-minephase. However, it had been going down until 1996/1998 and has gone up since then.In the other NWT communities the rate has been going down since 1999/2001. The rate of suicides in Canada has alsobeen going down. The rate in the NWT has remained similar before and after the mining phase. There is too little data tosay if there is a link between mining and suicide rates in small local communities and Yellowknife.Figure 13: Suicides, Rate per 10,000 Persons, Three-Year Average6543SLCs2Other /042004/062006/082008/10
262015Communities & DiamondsTeen BirthsSome teen mothers may be mature enough to raise a child, while others may not be. Stress and lack of maturity may affectthe well-being of both the child and parents. Teen mothers are also more likely to be single, which makes it more difficultfor them to support their children and increases stress.In small local communities, the rate of teenage births was steady in the before-mine phase. However, the rate of teenagebirths was still quite a bit higher than in other NWT communities, including Yellowknife. In the active-mine phase, therate dropped quickly until 2002/2004, and continued to go down more quickly than in the rest of the NWT or Canada.However, since 2004/2006, it has been going up faster than in Canada, the rest of the NWT and Yellowknife.In Yellowknife, the rate of teenage births has also been going down since the active-mine phase. Except for a peak in1998/1999, the drop in the Yellowknife rate has mirrored the drop in the Canadian rate. The data does not indicate themines have influenced the rate of teen births in Yellowknife.Figure 14: Birth Rate For Teen Females Aged 15-19 (# Per 1,000), Three Year Average140120100SLCs806040Other /0808/10
2015Communities & Diamonds27Single Parent FamiliesSingle-parent families typically have lower incomes which can make providing basic needs more difficult. Single-parentfamilies also face additional challenges such as finding daycare.In SLCs the rate of single-parent families had been steady before the mines, but went up quickly after the mines beganoperations. The rate in other small and regional communities has also gone up, but not as quickly as in small localcommunities. The data suggests there may be a link between the rate of single-parent families in small local communitiesand mining activity.In Yellowknife, the trend for single-parent families has also been going up, but not as much as in small local communities.These changes are similar to those seen across Canada; therefore it may be assumed the mines have not influenced theYellowknife rate.Figure 15: Percent Single Parent Families35%30%SLCs25%Other 0120062011
282015Communities & DiamondsInjuriesPhysician and nurse diagnosed injury indicators measure the number of people whom a doctor or nurse have said to havebeen injured. Injuries include broken bones, severe burns, cuts or
care and maintainance in December 2015. The purpose of the Communities and Diamonds Report is to determine if mine activity may be affecting residents of Yellowknife and seven Small Local Communities (SLCs) in the NWT by examining socio-economic indicators for changes since 1996, when the first mine, Ekati, began construction.