Transcription
Undergrounddevelopmentcontinues apace atCullinanFY 2015 Preliminary Results (12 Months to 30 June 2015)18 September 2015
Important Notice These Presentation Materials are being supplied to you by Petra Diamonds Limited (the “Company”) solely for your information and use at thispresentation. These Presentation Materials may contain information that is confidential, legally privileged or otherwise protected by law. ThesePresentation Materials may not be reproduced in any form, redistributed or passed on, directly or indirectly, to any person or published, in wholeor in part, by any medium or for any purpose. Failure to comply with this restriction may constitute a violation of applicable securities law. These Presentation Materials are are exclusively for the purposes of raising awareness about the Company. These Presentation Materials are notintended to solicit the dealing in securities or securities financing nor do they form part of any invitation, offer for sale or subscription or anysolicitation for any offer to buy or subscribe for any securities in the Company (“Company Securities”) nor shall they or any part of them form thebasis of, or be relied upon in connection therewith or act as any inducement to enter into, any contract or commitment with respect to CompanySecurities. These Presentation Materials must not be used or relied upon for the purpose of making any investment decision or engaging in an investmentactivity. Accordingly, neither the Company nor any of its subsidiary undertakings (as defined in the Bermuda Companies Act 2006) (together, the“Group”), nor any of their respective directors, employees, agents or advisors makes any representation or warranty in respect of the contents ofthe Presentation Materials or otherwise in relation to the Group or any of its businesses. The information contained in the Presentation Materials is subject to amendment, revision and updating, and such information may changematerially. No person is under any obligation to update, or keep current, the information contained in these Presentation Materials, and anyopinions expressed in relation thereto are subject to change without notice. The Presentation Materials contain forward-looking statements whichinvolve risk and uncertainties and actual results and developments may differ materially from those expressed or implied by these statementsdepending on a variety of factors. The Presentation Materials have not been independently verified and no representation or warranty, express orimplied, is made as to the fairness, accuracy or completeness of the information or opinions contained herein. The forward-looking informationcontained in these Presentation Materials is expressly qualified by this cautionary statement. The delivery of these Presentation Materials shall not at any time or in any circumstance create any implication that there has been no adversechange, or any event reasonably likely to involve any adverse change, in the condition (financial or otherwise) of the Company or any othermember of the Group since the date of these Presentation Materials. Any securities mentioned herein have not been and will not be registered under the United States Securities Act of 1933, as amended (the“Securities Act”) or under the securities laws of any state or other jurisdiction of the United States and may not be offered, sold, resold ordelivered, directly or indirectly, in or into the United States absent registration except pursuant to an exemption from, or in a transaction notsubject to, the registration requirements of the Securities Act and applicable states securities laws. The distribution of these PresentationMaterials in other jurisdictions may also be restricted by law, and persons into whose possession these materials come should inform themselvesabout, and observe, any such restrictions. No public offering of securities is being made in the United States or any other jurisdiction. By attending this presentation or by accepting a copy of the Presentation Materials, you agree to be bound by the foregoing limitations andconditions.2
FY 2015 – Shaping our FutureContinued production growth Development programmes on trackRecord levels of 3.2 Mcts and 17.1 Mt in FY 2015Expansion programmes on track Solid start to FY 2016 – grades in line at Finsch and Cullinan First significant input of undiluted ore expected from H2 FY 2016 Petra remains on target for ca. 5 Mcts by FY 2019Focus on efficiencies FinschTight control of operating costs and overhead led to cashoperating margin of 36% despite operational and marketchallengesRobust balance sheet 421.7m in cash and undrawn debt facilities as at 30 June 2015 Ongoing weakness in the Rand has a favourable impactMaiden dividend declaration Dividend of 3.0 cents per share to be paid on 7 December 2015Cullinan3
FY 2015 – Key Performance IndicatorsProductionSafetyRevenueMcts3.5LTIFR1.2US .0FY2012FY2013FY2014FY2015Increases at Finsch,Kimberley Underground,Williamson Partially offset by reductionsat Cullinan, Koffiefonteinand Helam0.80.60.40.20FY2012 2% to 3.2 Mcts 1FY2013FY2014FY2015FY2012-10% to 425m Pricing achieved by Petradown ca. 10% during theYear ROM grade and productmix volatility at Cullinan Included 38.7m from saleof exceptional diamondsFY2013FY2014FY2015LTIFR -9% to 0.29 Good achievement,particularly given extra1.7m shifts worked due tocapital projects Striving to achieve zeroharm4
FY 2015 – Key Performance IndicatorsProfit from Mining Activities¹US M250US 13FY2014FY2015Operating margin of 36%US M200180160140120100806040200FY2012-23% to 154.5m Operating Cashflow³EBITDA²FY2013FY2014FY2015FY2012-26% to 139.3m Strong cost controlFY2013FY2014FY2015-22% to 141.3m Assisted by weaker ZARagainst the USD1. Profit from mining activities is revenue less adjusted mining and processing costs plus other direct income2. EBITDA is Adjusted EBITDA, stated before depreciation, share-based expense, net finance expense, tax expense, impairment charges, netunrealised foreign exchange gains and losses and loss on discontinued operations3. Operating cashflow is Adjusted operating cashflow, adjusted for the cash effect of the movement in diamond debtors between each financial yearend, excluding unrealised foreign exchange translation movements5
Robust Financial PositionCashUS m180160140120100806040200166.634.030/06/14Bank facilities undrawnNet debt30/06/15 390% to 166.6US m200180160140120100806040200US m300250200171.7150255.1100124.950030/06/1430/06/15 37% to 171.7m37.530/06/1430/06/15 580% to 255.1m 421.7m in cash and undrawn debt facilities as at 30 June 2015 FY 2015: Refinancing of 98m Finsch/Cullinan BEE loans; 300m Notes Issue; increase in debt facilitiesby ca. 77.2 million 33.5m diamond inventories and 57.6m diamond debtors as at 30 June 2015 Capex fully funded from treasury, bank facilities and cashflows Ability to defer up to ca. 40 – 50% of Capex if absolutely necessary6
FY 2015 – Operations ResultsRevenue by mineProduction by mineProduction Split - CaratsTailings/ tSalesRevenueDiamonds soldProductionTotal tonnes treatedROM diamondsTailings & other² diamondsTotal diamondsOpexOn-mine cash costCapexExpansionSustainingBorrowing Costs CapitalisedTotal1.2.FY 2015FY 2014VarianceUS MCarats425.03,168,650471.83,131,830-10% 073,186,47515,731,0752,173,697935,9883,109,685 9% 5%-3% 2%US M253.4248.9 2%US MUS MUS MUS M212.047.414.7274.1The table above includes results from the Helam mine which was placed on care and maintenance in H2 FY 2015‘Other’ includes mining of the Ebenhaezar satellite kimberlite pipe at Koffiefontein and alluvial diamond mining at Williamson155.046.59.7211.2 37% 2% 52% 30%7
Operating CostsPetra’s focus on cost control and the weaker ZAR helped to mitigate inflationary pressuresFY2015 Group On-mine Cash Cost BreakdownGroup On-mine Cash Cost: FY 2014 vs FY 2015-150-170-1907%-2-6-27044% 30Electricity-21036%Labour13%Labour Services, Consumables and StoresPowerOtherCPI30-Jun-14-290Certain cost categories in South Africa increased in excess of SA CPI (ca. 5% as at 30 June 2015)Energy: Energy costs in South Africa rose 13% in FY 2015 and further increase of 10-13% expected for FY 2016 Risk of rising electricity costs managed through efficient design of new infrastructure Back up power generation being put in place at Cullinan, Finsch and Koffiefontein to negate Eskom stage1 and 2 load reduction requestsLabour: 3yr wage agreement with NUM ( ca.10% pa); lower increases for management & higher skilled labourequates to ca.8% pa for Group8
FY 2015 – Summary of ResultsFY 2015(US m)FY 2014(US m)Revenue¹Adjusted mining and processing costs¹Other direct income425.0(272.7)2.2471.8(277.4)6.7Profit from mining activities1Exploration expenseCorporate overheadAdjusted EBITDA1DepreciationShare-based expenseNet finance expenseTax expenseAdjusted net profit after tax1Impairment charges¹Net unrealised foreign exchange (losses) / gainsLoss on discontinued operations, net of tax¹Net profit after tax – .0)93.7(13.9)3.6(15.9)67.5Basic EPS from continuing and discontinued operations – US cents9.469.69Basic EPS from continuing operations – US cents9.4612.80Adjusted basic EPS from continuing operations – US cents¹10.0914.821. Refer to preliminary results announcement dated 18 September 2015 for detailed notes explaining non IFRS adjusted disclosures9
HSSE HighlightsHealth & Safety Continued improvement in LTIFR Mines recorded 3 months LTI free – 1st time in Petra history Fatality post Year end at Tailings Treatment Plant at Cullinan –investigation and findings have been shared with Group; Petra willcontinue to strive daily for zero harmStable labour relations 3 year wage agreement signed in Sep 2014 with NUM First annual distributions from Itumeleng Petra DiamondsEmployee Trust (IPDET) to beneficiaries in Dec 2014A group of apprentices at FinschTraining & Development 6.7m spent on training & development programmes in FY 2015 Focus on education initiatives in local communitiesEnvironment 14% improvement in carbon emissions since 2013 baseline Continual focus on efficiencies: improvement in energy, water andcarbon emitted per tonneEducation initiatives in local schools10
Diamond Market – OverviewDemandSupply Supply constraints: Global rough diamond productiondecreased 4% to 125 Mcts worth 14.5bn in 2014(average 116/ct) US recovery: economy continues to improve; very strongdiamond buying culture (ca. 40% of world demand); retaildemand currently performing well No new finds: success rate in diamond explorationestimated to be 1% - no significant finds this century,plus exploration expenditure cut worldwide “Late cycle” commodity: growth in developed and emergingmarkets to continue further to rising wealth and growingmiddle classes worldwide Overall declining trend: 2005 expected to have beenworld peak diamond production New mines coming on stream in next few years not largeenough to counter declines from world’s major producersBridal underpin: The bridal sector provides a certain level ofimmunity to fluctuating economic conditions; desire fordiamond bridal jewellery increasingly taking hold in emergingmarkets Mass luxury: China / India starting to follow US model ofaffordable diamond jewellery (US 200 to US 2,000) World supply expected to decline slowly after 2020Global Diamond Supply: Historical & Forecast Rough yle U/GEkatiGahcho KueAngola a60VenetiaGribRenardCatocaMisery40Finsch20Sources: Kimberley Process Statistics / RBC Capital 8a1965a1940a011
Rough Diamond PricingFY 2015 Market:Petra Sales – Pricing and Timing Market experienced challenging conditions in FY 2015,due to liquidity / profitability issues in the midstream ofthe pipeline, the impact of the strong USD and aslowdown in demand from China FY 2016 Outlook: FY 2016 Tender CycleJuly 2015: Petra guided for flat diamond pricing in FY2016 (compared to H2) but expects higher weightedaverage prices due to more ROM carats vs. tailings;continued volatility and uncertain market conditionsmay result in deviations to guidance Petra sells via method of competitive tender – pricingsubject to pure market movements; experienceddecrease of ca. 10% in FY 2015Pricing movements experienced by diamond producerscan vary based on differing sales modelsPetra – Rough Diamond Prices (US /ct)Diamond retail results remain stable in US and bridalsegment still performing in mainland ChinaGuidanceWeightedAverageUS /ctFY 2016ActualWeightedAverageUS /ctFY 2015ActualWeightedAverageUS /ctFY 42Kimberley Underground327302303Williamson303298307Rough Diamond Index (Jan 2004 to Jun 2015)Total Increase: 110%CAGR: 630/1/0530/1/0401.2.3.Excludes guidance for exceptional diamonds (stones above 5 million in value)Excluding exceptional stones, the average was 119 per caratExcluding exceptional stones, the average was 146 per carat12
Impact Of Strong US Dollar Strong USD puts pressure on pricing of USD denominated commodities Substantial weakness in ZAR significantly increases ZAR cashflows in South Africa Major portion of Petra operating costs incurred in South Africa Chart below shows rough diamond prices (PLPHROAI Index) in ZAR termsRough Diamond Index – ZAR terms (Jan 2004 to Jun 2015)Total Increase: 296%CAGR: 13
Moving into Undiluted Ore Caving is a safe and proven mechanisedmining method; provides access to highervolumes of ore than other methods Current underground mining taking place indiluted, mature caves nearing end of lives Expansion programmes to take next ‘cut’ bydeepening and establishing new block/sublevel caves in undiluted kimberlite Grades expected to rise significantly,increasing margin per tonne mined: 1.Finsch 35%: ca. 43 cpht to ca. 58 cpht¹Cullinan 129%: ca. 24 cpht to 55 cpht¹Will reduce wear and tear on processingsystems (waste rock is harder and moreabrasive than kimberlite)Management expectations14
Growth & Margin ExpansionOperating margins expected to rise from ca. 36% to 50% by FY 2019 Group tonnage throughput to remain flat, but increase in ROM grades to lead to ca. 60% growth in production Lower value tailings to reduce from 29% in FY 2015 to 4% of carat production by FY 29%27%23%24%2%8.010%22%4.011%22%Million caratsMillion tonnesSplit of Petra’s production profile from different ore %LH columns:split of tonnesminedUndiluted U/G tonnesWilliamson ROM tonnesDiluted U/G tonnesTailings tonnesRH columns:split of caratsproduced20192018201720166%20150.00.0Tailings caratsROM carats15
Finsch – Development ProgrammeExpansion PlanFY 2015 Development : 4,217 metres; Raiseboring: 376 metres; Kimberlite: 1,038 metres Expansion plan to take productionto c. 2.0 Mctpa (ROM) by FY 2018 Sub level cave – development of 3 outof 4 levels complete New Block 5 Block Cave to be installedat 900mKey Future Milestones Production from SLC from – end H1FY 2016 Dedicated conveyor ore-handlinginfrastructure (to transfer SLC ore toexisting infrastructure at 650m) – endFY 2016 Mining of South West Precursor from630m to 780m – from H2 FY 2016 Further bulk sampling at overburdendumps – FY 2016 Decommissioning of Block 4automated ore-handling system – FY2017 Steady state ROM production – FY2018 Pre 79 Tailings treated – until FY 2017 Block 5 Block Cave at 900m – FY202416
Finsch Development SnapshotSLC ore handling installation infrastructure in progressSimba M4C in operationInstallation of the Apron Feeder BulkheadThe new bulk sample plant17
Cullinan – Development ProgrammeExpansion PlanFY 2015: Development: 4,282 metres; Raiseboring: 614 metres; Kimberlite: 2,285 metres Expansion plan to takeproduction to c. 2.4 Mcts by FY2019 (2.2 ROM & 0.2 tailings) C-Cut Phase 1: new block cavebeing established on the westernside of the orebody Development work transitioningfrom waste tunnelling in host rockto kimberlite First rings in the undercut blasted –June 2015Key Future Milestones New production levels to beestablished at 839m and shaft to930m to be commissioned – FY2016 880m ore-handling system,allowing for future ramp-ups toutilise full C-Cut footprint – FY 2016 Initial production from new C-Cutcave – H2 FY 2016 Ore shaft completed andcommissioned – H1 FY 2017 New Cullinan plant operational –end FY 2017 Steady state ROM production(4Mtpa) – FY 201918
Cullinan Development SnapshotDrillingUndercut holing – Tunnel 21‘Blue’ development – rock sealing‘Blue’ development – secondary supportUndercut secondary supportConveyor Level South19
Cullinan Development SnapshotCrusher South 1 – chamberCrusher South 1 – pre-assemblyCrusher South 1 - constructionProduction Tip South 1Shaft 3 raiseboreShaft 3 lining20
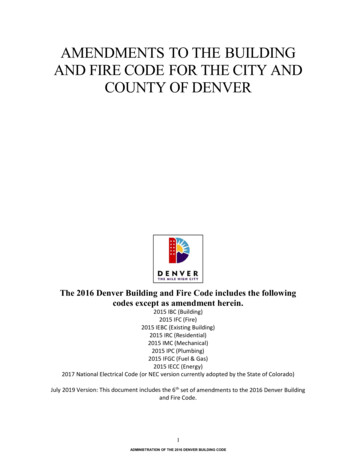
New Cullinan PlantExpected benefits of the CDM Plant Footprint decreases from ca. 26 to ca. 5 hectares Expected reduction in number of conveyorbelts from 151 (ca. 15km) to 22 (ca. 3km)Increase of ca. 6 – 8% in revenue per tonne Ca. 10% increase in grade due to increasedliberation across the full diamond spectrum Improved recoveries of large, higher valuestones (new plant will utilise gentlerprocessing methods (comminution viaattrition) instead of extensive crushing)Production of Large Diamonds at CullinanSaving of ca. ZAR20 – 25/t in processing costs Existing Cullinan PlantOperating cost savings due to increasedenergy efficiency, improved waterconsumption, reduced circulation andreduction in maintenance requirementsStrong standalone economics Payback of ca. 3 years IRR of 25%Acquisition by Petra July 200821
Optimising Recoveries at Cullinan – The Prize Cullinan is a world-class orebody, renowned for theregular production of large, top quality diamonds Source of the 3,106ct Cullinan diamond (cut toform the centrepiece stones of the British CrownJewels) and many of the world’s most famous andspectacular diamonds Sep 2015: Chow Tai Fook unveils a new Cullinanmasterpiece: ‘A Heritage in Bloom’, set with a104ct DIF Triple-X brilliant round diamond cut fromthe Cullinan HeritageThe 507ct Cullinan Heritage – sold for record 35.3m in 2010Chow Tai Fook’s magnificent ‘A Heritage in Bloom’22
Growth and Margin Expansion Petra to maintain a flat tonnage profile from FY 2016 onwards, but the replacement ofpoor quality tonnes with better quality tonnes will grow production and increase theaverage value per caratFY 2019production target ofca. 5.0 Mcts;revenue of ca.US 1.0bn63052535002Significantdecline in Capexfrom FY 2018CapexAdj. operating cashflowRevenueProduction 0Tonnes treated (Mt)4Carat production (million carats)FY 2015production of3.2 Mcts;revenue ofUS 425mFY 2012productionof 2.2 Mcts;revenue ofUS 317m2012AUS m1000Tonnes treatedNote: All forecasts for Capex, revenue and production are management estimates. Capex is in nominal terms; diamond prices are calculated using a 4% real price increase.23
Integrated Approach to SustainabilitySafety Performance1.2Safety ofemployees is toppriority10.8Petra strives 12FY2013FY2014FY2015LTIFR comparesfavourably withinternationalunderground minesPetra’s LTIFR RateHeath and SafetyStriving for zero harmFinsch wins 2 MineSAFE AwardsEducationPetra supports My Maths Buddy One Book One Learner ProjectEnvironmental ManagementBiofiltration trials at CullinanCommunityKimberley UG cleans litter on Mandela Day
The Koffiefontein mine, South AfricaAppendix
Capital StructureShare Price (1 year to 15 Sep 15)vs FTSE 250 & FTSE 350 MiningHigh Quality Share Register% ISC(as at 15 September 2015)T. Rowe Price¹14.3%BlackRock Investment (UK) Limited10.0%Al Rajhi Holdings W.W.L.5.1%Kames Capital²3.1%Directors2.7%1. T. Rowe Price holds 72,900,341 shares with voting rights attached tothem, being 14.1% of Petra voting rights2. Kames Capital holds 20,310,355 shares with voting rights attachedto them, being 3.9% of Petra voting rightsListingAverage daily trading volume (shares) – (last 12 mths)LSE: PDL2.5mShares in issue518.1mFree float97.3%Market cap @ 113p (15 Sep 2015) 582m / 898m26
FY 2015 – Operations ey UGWilliamson(74%¹ Petra; 26% BEE)(74%¹ Petra; 26% BEE)(70%¹ & 2 Petra; 30% BEE)(74%¹ Petra; 26% BEE)(75% Petra; 25%Government of 9Tonnes treated 6661,196,269908,4984,426,0443,810,690Diamonds recovered 71909917431854386542302303298303Revenue (US ine cash cost pertonne 8121.593.126.830.713.910.116.28.9ROM ProductionTonnes treated (t)Grade (cpht)Diamonds recovered (carats)Total ProductionSalesDiamonds sold (carats)Average price per carat (US )Total Capex¹ Other than the percentage interests above, Petra has an interest in Sedibeng Mining, one of its BEE partners – refer document ‘Effective Interest in nalysts/analyst-guidance/² Petra has an interest in Re Teng Diamonds (Pty) Ltd, the BEE partner for the Koffiefontein mine3 Excluding exceptional diamonds, the average value for FY 2015 was US 119 per carat4 Excluding exceptional diamonds, the average value for FY 2014 was US 146 per carat27
Production and Revenue – FY 2015 vs FY 2019Gross ProductionGross RevenueFY 2015 actual: 3.2 million caratsFY 2015 actual: US 425.0 5%KoffiefonteinKimberleyUndergroundFY 2019: c.5 million carats110%4%FY 2019: c.US 1.0 billion130%41%40%47%7%11%3%2%12%7%281.FY 2019 figures are management estimates; revenue calculated using a 4% annual real price increase
Focus on Africa Five producing mines (four in South Africa and one in Tanzania), plus exploration in Botswana Diversified portfolio is key to managing production risk across the GroupAfrica is source of ca. 60% ofworld’s diamonds by value29
An Exceptional Growth Path Petra acquired five diamond mines from De Beers (four in South Africa, one in Tanzania)July 2007July 2008February 2009May 2010September 2011KoffiefonteinCullinanWilliamsonKimberley UGFinsch70% Petra¹; 30% BEE74%¹ Petra; 26% BEE75% Petra¹; 25%74% Petra¹; 26% BEE74% Petra¹; 26% BEEBlock CaveMine Plan to 2026 13yr Potential LifeSub-level / Block CaveMine Plan to 2030 25yr Potential LifeGovernment of TanzaniaSub-level / Block CaveMine Plan to 2025 20yr Potential LifeBlock CaveMine Plan to 2030 50yr Potential LifeOpen PitMine Plan to 2033 50yr Potential LifePetra’s approach to mine management and project development: Flat management structures Utilise in-house expertise / knowledge Focus on efficiencies / cost control Phase approach to development (lower capital intensity) Focus on value as opposed to volume production Make decisions, get going1.30See ‘Effective Interest in Mines’ document on nalyst-guidance for further disclosures re. Petra’s effective interest in its mines
2015 Resource Statement (30 June 2015) World-class Resource base of 308.7 million carats¹ worth ca. US 54.3 billion²Gross Resources ey Underground2.61.9KoffiefonteinKimberley Underground-CullinanFinschWilliamsonGross In Situ Value (US bn)²11.44.434.0-CullinanWilliamsonFinsch1. The total Group Resource includes 4.1 Mcts for the Helam mine in South Africa (now on care and maintenance) and 8.8 Mcts for the KX36 explorationproject in Botswana.2. The estimated Resource value uses FY 2015 average carat values to calculate the in situ values of the Cullinan, Finsch, Williamson, Koffiefontein andKimberley Underground mines; the values for Helam and KX36 have not been included in this estimate value.31
Iconic Diamonds From Iconic MinesThe Greater Star ofAfricaLargest polished yieldfrom the Cullinan at530ct; sits in the RoyalSceptreCullinan, 1905The Williamson Pink55ct rough; 24ct polished;gifted to Princess Elizabethon her engagementWilliamson, 1947The Cullinan Heritage507.5 carats roughCullinan, 2009The Oppenheimer253.7ct roughPerfect yellow diamondDutoitspan Mine,Kimberley U/G, 1964The Golden Jubilee755.5ct rough,545.6ct polishedCullinan, 1986The Cullinan3,106 carats roughLargest gem diamond ever discoveredCullinan, 1905The Star ofJosephine26.6ct rough,7.0ct polishedCullinan, 2009The Taylor Burton240.8ct rough,69.4ct polishedCullinan, 1966The Blue Moon29.6ct rough,12.0ct polishedCullinan, 201432
Petra Production Profile The production profile of a kimberlite is highly consistent when the mine is in steady state production; Petraexperienced volatility in product mix in FY 2015 due to the reliance on the heavily diluted old mining areasat its underground operations Ever growing volumes across the full diamond spectrum (from lowest to highest value) Growing trend for mass luxury supported by strong pricing performance in smaller / 2nd to 3rd quality goods33
Exceptional Diamonds Petra classifies ‘exceptional diamonds’ as stones that sell for 5 million each Exceptional diamonds contributed on average 21 million pa from FY 2009 to FY 2015 Average increased to ca. 36 million pa in FY 2014 and FY 2015 Company business model is not reliant on exceptional diamond recoveries122 carat blue diamond valued at 27.6 million in a beneficiationagreement; Petra received 23.5million and retains a 15% share inpolished proceedsThe rough diamondyielded four polishedblue stones ofsignificance: 26.1 carat, radiant cut,intense fancy bluediamond; 11.3 carat, pear cutdiamond, colour tbc); 10.3 carat, radiant cut,fancy blue diamond; and 7.0 carat, cushion cut,fancy blue diamond.232 carat white diamondsold for 15.2 million34
Finsch – Production Plan ROM tonnages to rise ca. 16%, but ROM carat production to rise ca. 56% due to higher grade Positive impact on average value per carat as tailings production winds down705.060504.03.01402.5120 /ct6.0Million caratsCarat production and average diamond values¹cphtMillion tonnesTonnes treated and 1520162017201840100.500.02019ROM tonnesTailings tonnesROM grade (RHS)Tailings grade (RHS)20020132014ROM carats1.20152016Tailings carats201720182019Weighted average price (RHS)Forecasts for average value per carat calculated using a 4% annual real price increase35
Cullinan – Production Plan ROM tonnages to rise 48%, but ROM carat production expected to rise 180% Steady state grade projection increased from ca. 50 cpht to ca. 55 cpht due to new Cullinan plant6.0505.0403.02001802.5 /ct607.0Million caratsCarat production and average diamond valuescphtMillion tonnesTonnes treated and .040200.002013201420152016201720180.02019ROM tonnesTailings tonnesROM grade (RHS)Tailings grade (RHS)020132014Tailings caratsROM carats1.20152016201720182019Average price per carat (excl 5m stones)Average price per carat (incl 5m stones)Forecasts for average value per carat calculated using a 4% annual real price increase36
Koffiefontein – Development ProgrammeExpansion Plan – to takeproduction to c. 100,000ctpa by FY 2017Koffiefontein Kimberlite Pipe Schematic SLC to be mined over 3levels from 560 mL to 600mL Production commencedfrom first tunnels of SLC on560 mL – end FY 2015 ROM productionsupplemented by ore fromEbenhaezer open pit ( 5ha)– FY 2016 52L western Fissure comesinto production tosupplement ore from SLCPhase 1 on 56L – FY 2016 Ramp up ROM productionto 1.1 Mt by FY 201737
Kimberley Underground – Development ProgrammeExpansion Plan – plannedproduction of ca. 170,000ctpa by FY 2016Kimberley Underground Kimberlite Pipes Schematic Planned ROM tonnestreated of ca. 1.2 Mtpa –from FY 2015 Planned grade of 13 – 15cpht from FY 2016 Scope refinement ofundergrounddevelopment at the JointShaft extending lives ofBultfontein andDutoitspan to matchWesselton38
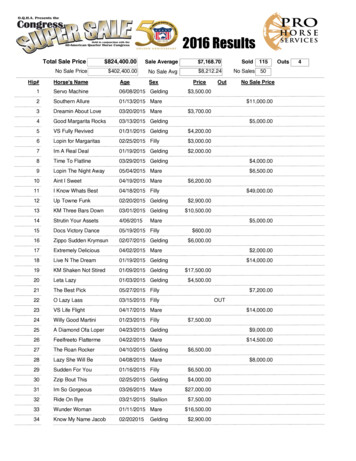
Williamson – Development ProgrammeExpansion Plan – to takeproduction to c. 350,000ctpa by FY 2018Williamson Kimberlite Pipe Schematic1kmN Plant modifications(additional crusher circuit, 2autogenous mills) tocommence – FY 2016 Commissioning of crusher –FY 2016LOM Pit Shell205m Commissioning of 2autogenous mills – H1 FY2017 ROM throughput for FY2016 planned at 3.8 Mt dueto downtime associated withplant modifications Ramp up of ROMproduction to c. 5 Mtpa (atca. 7 cpht) by FY 2018GeologySchematic showing cut-away geologyand planned open pitGranite BrecciaRVKBoumaShale IslandBVKPK39
Loans and Borrowings Movement(US million)200100-100-200-300-400-159 141-9 98-267WC changesBEE re-fiCapex-300 142 26-327-500-60030-Jun-141.OperatingprofitBond notes Repayment ofbank debtOther130-Jun-15‘Other’ inc
3 year wage agreement signed in Sep 2014 with NUM First annual distributions from Itumeleng Petra Diamonds Employee Trust (IPDET) to beneficiaries in Dec 2014 Training & Development 6.7m spent on training & development programmes in FY 2015 Focus on education initiatives in local communities Environment