Transcription
Trends in U.S. Oil and Natural GasUpstream CostsMarch 2016Independent Statistics & Analysiswww.eia.govU.S. Department of EnergyWashington, DC 20585
This report was prepared by the U.S. Energy Information Administration (EIA), the statistical andanalytical agency within the U.S. Department of Energy. By law, EIA’s data, analyses, and forecasts areindependent of approval by any other officer or employee of the United States Government. The viewsin this report therefore should not be construed as representing those of the Department of Energy orother federal agencies.U.S. Energy Information Administration Trends in U.S. Oil and Natural Gas Upstream Costsi
March 2016ContentsSummary . 1Onshore costs . 2Offshore costs . 5Approach. 6Appendix ‐ IHS Oil and Gas Upstream Cost Study (Commission by EIA) . 7I.II.III.IV.V.VI.VII.VIII.IX.Introduction . . . . . IHS‐3Summary of Results and Conclusions – Onshore Basins/Plays . . . IHS‐7Deep Water Gulf of Mexico. . . . . . IHS‐23Methodology and Technical Approach . . . IHS‐29Bakken Play Level Results . . . . . . IHS‐35Eagle Ford Play Level Results . . . . . IHS‐53Marcellus Play Level Results . . . IHS‐69Permian Play Level Results . . . IHS‐85Deepwater Gulf of Mexico IHS‐103FiguresFigure 1. Regional shale development has driven increases in U.S. crude oil and natural gas production . 2Figure 2 Percentage breakdown of cost shares for U.S. onshore oil and natural gas drilling andcompletion . 3Figure 3. Average well drilling and completion costs for the 5 onshore plays studied follow similartrajectories . 4Figure 4. Cost per vertical depth and horizontal length . 5U.S. Energy Information Administration Trends in U.S. Oil and Natural Gas Upstream Costsii
March 2016SummaryThe profitability of oil and natural gas development activity depends on both the prices realized byproducers and the cost and productivity of newly developed wells. Prices, costs, and new wellproductivity have all experienced significant changes over the past decade. Price developments arereadily observable in markets for oil and natural gas, while trends in well productivity are tracked bymany sources, including EIA’s Drilling Productivity Report which focuses on well productivity in keyshale gas and tight oil plays.Regarding well development costs, there is a general understanding that they are sensitive to increasedefficiency in drilling and completion, which tends to lower costs, shifts towards longer wells with morecomplex completions, which tends to increase them, and prices for oil and natural gas, which affectmarkets for drilling and completion services through their effect on drilling activity. However, overalltrends in well development costs are generally less transparent than price and productivity trends.Given the role of present and future cost trends to determining future trajectories of U.S. oil and naturalgas production under a range of possible future price scenarios, it is clearly important to develop adeeper understanding of cost drivers and trends.To increase the availability of such cost information, the U.S. Energy Information Administration (EIA)commissioned IHS Global Inc. (IHS) to perform a study of upstream drilling and production costs. The IHSreport assesses capital and operating costs associated with drilling, completing, and operating wells andfacilities. The report focuses on five onshore regions, including the Bakken, Eagle Ford, and Marcellusplays, two plays (Midland and Delaware) within the Permian basin1, as well as the offshore federal Gulfof Mexico (GOM). The period studied runs from 2006 through 2015, with forecasts to 2018.Among the report’s key findings are that average well drilling and completion costs in five onshoreareas evaluated in 2015 were between 25% and 30% below their level in 2012, when costs per wellwere at their highest point over the past decade.Based on expectations of continuing oversupply of global oil in 2016, the IHS report foresees acontinued downward trajectory in costs as drilling activity declines. For example, the IHS report expectsrig rates to fall by 5% to 10% in 2016 with increases of 5% in 2017 and 2018. The IHS report also expectsadditional efficiencies in drilling rates, lateral lengths, proppant use, multi-well pads, and number ofstages that will further drive down costs measured in terms of dollars per barrel of oil-equivalent( /boe) by 7% to 22% over this period.EIA is already using the observations developed in the IHS report as a guide to potential changes in nearterm costs as exploration and production companies deal with a challenging price environment.1The Bakken is primarily located in North Dakota, while the Marcellus is primarily located in Pennsylvania. The Eagle Ford andthe two Permian plays (Midland and Delaware) are located in Texas.U.S. Energy Information Administration Trends in U.S. Oil and Natural Gas Upstream Costs1
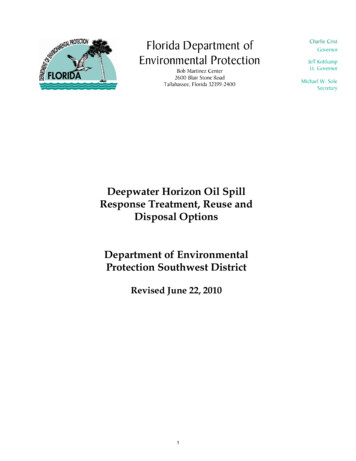
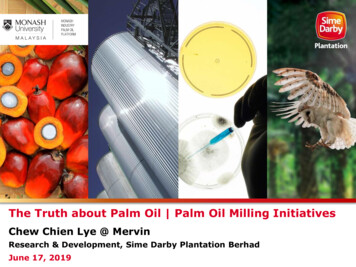
March 2016Onshore costsCosts in domestic shale gas and tight oil plays were a key focus of EIA’s interest given that developmentof those resources drove the major surge in crude oil and natural gas production in the United Statesover the past decade, as shown in Figure 1. The IHS report documents the upstream costs associatedwith this growth, including increases associated with the demand for higher drilling activity duringexpansion and decreases during the recent contraction of drilling activity.Figure 1. Regional shale development has driven increases in U.S. crude oil and natural gas productionCrude oil productionmillion barrels per day9010864Marketed natural gas productionbillion cubic feet per dayRest of U.S.Federal Gulf of MexicoPermian regionEagle Ford regionBakken region807060Rest of U.S.Rest of U.S shaleMarcellus region50403022010--Source: U.S. Energy Information Administration Drilling Productivity Report regions, Petroleum Supply Monthly, Natural GasMonthlyNote: Shale gas estimates are derived from state administrative data collected by DrillingInfo Inc. and represent the U.S. EnergyInformation Administration’s shale gas estimates, but are not survey data.The IHS report considers the costs of onshore oil and natural gas wells using the following costcategories: land acquisition; capitalized drilling, completion, and facilities costs; lease operatingexpenses; and gathering processing and transport costs. Total capital costs per well in the onshoreregions considered in the study from 4.9 million to 8.3 million, including average completion coststhat generally fell in the range of 2.9 million to 5.6 million per well. However, there is considerablecost variability between individual wells.Figure 2 focuses on five key cost categories that together account for more than three quarters of thetotal costs for drilling and completing typical U.S. onshore wells.2 Rig and drilling fluids costs make up15% of total costs, and include expenses incurred in overall drilling activity, driven by larger marketconditions and the time required to drill the total well depth. Casing and cement costs total 11% of total2Typical U.S. onshore wells are multi-stage, hydraulically fractured, and drilled horizontally. The costs identified relate, in part,to the application of those technologies.U.S. Energy Information Administration Trends in U.S. Oil and Natural Gas Upstream Costs2
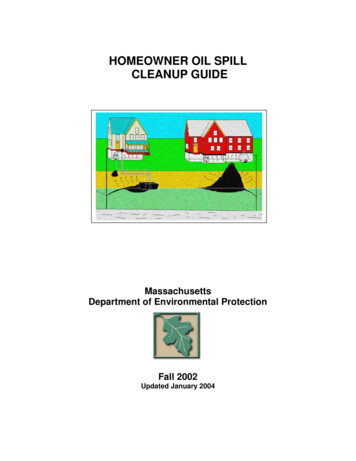
March 2016costs, and relate to casing design required by local well conditions and the cost of materials. FracPumps, Equipment costs make up 24% of total costs, including the costs of equipment and horsepowerrequired for the specific treatment. Proppant costs make up an average of 14% of total costs andinclude the amount and rates for the particular type of material introduced as proppant in the well.Completion fluids, flow back costs make up 12% of total costs, and include sourcing and disposal of thewater and other materials used in hydraulic fracturing and other treatments that are dependent ongeology and play location as well as available sources.Figure 2 Percentage breakdown of cost shares for U.S. onshore oil and natural gas drilling andcompletionRig and drilling fluid15%23%Casing and cement11%Frac Pumps, EquipmentProppant12%Completion fluids, flow back24%Other14%Source: IHS Oil and Gas Upstream Cost Study commissioned by EIAOver time, these costs have changed. For example, drilling and completion cost indices shown in Figure3 during the period when drilling and drilling services industries were ramping up capacity from 2006 to2012 demonstrate the effect of rapid growth in drilling activity. Since then, reduced activity as well asimproved drilling efficiency and tools used have reduced overall well costs. Changes in cost rates andwell parameters have affected plays differently in 2015, with recent savings ranging from 7% to 22%relative to 2014 costs.U.S. Energy Information Administration Trends in U.S. Oil and Natural Gas Upstream Costs3
March 2016Figure 3. Average well drilling and completion costs for the 5 onshore plays studied follow similartrajectoriesCost by year for 2014 well parameters million per well 12 10 8 6 4 2 2006 2007 2008 2009 2010 2011 2012 2013 2014 2015Eagle FordBakkenMarcellusMidlandDelawareNote: Midland and Delaware are two plays within the Permian basin, located in Texas and New MexicoSource: IHS Oil and Gas Upstream Cost Study commissioned by EIAThe onshore oil and natural gas industry continues to evolve, developing best practices and improvingwell designs. This evolution resulted in reduced drilling and completion times, lower total well costs, andincreased well performance. Drilling technology improvements include longer laterals, improved geosteering, increased drilling rates, minimal casing and liner, multi-pad drilling, and improved efficiency insurface operations. Completion technology improvements include increased proppant volumes, numberand position of fracturing stages, shift to hybrid fluid systems, faster fracturing operations, less premiumproppant, and optimization of spacing and stacking. Although well costs are trending higher, collectively,these improvements have lowered the unit cost of production in /boe.The cost variations across the studied areas arise primarily from differences in geology, well depth, andwater disposal options. For example, Bakken wells are the most costly because of long well lengths anduse of higher-cost manufactured and resin coated proppants. In contrast, Marcellus wells are the leastcostly because the wells are shallower and use less expensive natural sand proppant. Figure 4 shows, byregion, how costs for well vertical and horizontal depths have dropped over time, driving some of theefficiency improvements characteristic of U.S. domestic production over the past decade.The Bakken play has consistently had the lowest average drilling and completion costs of the basins andplays reviewed in the IHS report. Improvement in drilling rig efficiency and completion crew capacityhelped drive down drilling costs per total depth and completion costs per lateral foot, since 2012.Recent declines are partly a result of an oversupply of rigs and service providers. Standardization ofdrilling and completion techniques will continue to push costs down.U.S. Energy Information Administration Trends in U.S. Oil and Natural Gas Upstream Costs4
March 2016Figure 4. Cost per vertical depth and horizontal lengthDrilling Cost per Total Depth per footCompletion Cost per Lateral Foot per foot 250 1,000 200 800 150 600 100 400 50 200 - 201020122014Eagle 2014Eagle FordBakkenMidlandDelaware20162018MarcellusNote: Midland and Delaware are two plays within the Permian basin, located in Texas and New MexicoSource: IHS Oil and Gas Upstream Cost Study commissioned by EIAOffshore costsThere are fewer than 100 deepwater wells in the Gulf of Mexico. Unlike onshore shale and tight wellsthat tend to be similar in the same play or basin, each offshore project has a unique design and costprofile. Deepwater development generally occurs in the form of expensive, high-risk, long-durationprojects that are less sensitive to short-term fluctuations in oil prices than onshore development ofshale gas and tight oil resources. Nevertheless, recent low commodity prices do appear to have reducedsome Gulf of Mexico offshore drilling.Key cost drivers for offshore drilling include water depth, well depth, reservoir pressure andtemperature, field size, and distance from shore. Drilling itself is a much larger share of total well costsin offshore development than in onshore development, where tangible and intangible drilling coststypically represent only about 30% to 40% of total well costs.According to the IHS report’s modeling of current deepwater Gulf of Mexico projects, full cycleeconomics result in breakeven prices that are typically higher than 60/b. Low oil prices forcecompanies to control costs, increase efficiencies, and access improved technologies to improve theeconomics in the larger plays. Efforts are underway to renegotiate contract rates and leverage existingproduction infrastructure to develop resources with subsea tiebacks. Consequently, the IHS reportforecasts a 15% reduction in deepwater costs in 2015, with a 3% per annum cost growth from 2016 to2020. The large cost reduction in 2015 is most notable in rig rates because of overbuilding.U.S. Energy Information Administration Trends in U.S. Oil and Natural Gas Upstream Costs5
March 2016ApproachThe IHS report includes the following analyses and results: Assessment of current costs and major cost componentsIdentification of key cost drivers and their effects on ranges of costsReview of historical cost trends and evolution of key cost drivers as well designs and drillingprograms evolvedAnalysis of these data to assess likely future trends, particularly for key cost drivers, especially inlight of recent commodity price decreases and related cost reductionsData and analyses to determine the correlations between activities related to drilling andcompletion and total well costU.S. Energy Information Administration Trends in U.S. Oil and Natural Gas Upstream Costs6
March 2016Appendix - IHS Oil and Gas Upstream Cost Study (Commission by EIA)The text and data tables from the IHS Oil and Gas Upstream Cost Study are attached.U.S. Energy Information Administration Trends in U.S. Oil and Natural Gas Upstream Costs7
EIA – UPSTREAM COST STUDYFINAL REPORTOil and Gas UpstreamCost StudyDT007965, CO Task AssignmentDefinitization Letter FY2015 #4Prepared For:Energy Information Administration(EIA)October 8, 2015Submitted by:IHS Global Inc.5333 Westheimer DriveHouston, Texas 770561
EIA – UPSTREAM COST STUDYTable of ContentsIHS Points of Contact:Richard F. FullenbaumVice-President Economic ConsultingIHS Economics and Country Risk1150 Connecticut Ave NW, Suite 401Washington DC 20036Tel 1-202-481-9212Email: Richard.Fullenbaum@ihs.comCurtis SmithDirector – Upstream ConsultingIHS Global, Inc.5333 Westheimer RdHouston, TX 77056Tel 1 713-369-0209Email: Curtis.Smith@ihs.comProject Team MembersRichard Fullenbaum (project executive)Curtis Smith (project manager)Min RaoJing XiaoStephen AdamsRuss Fontaine2
EIA – UPSTREAM COST STUDYI.IntroductionThe Energy Information Administration, (EIA) commissioned IHS Global Inc. (IHS) to perform a study ofupstream costs associated with key basins and plays located in the United State, namely the Bakken,Eagle Ford, Marcellus, Permian Basin and deep water Gulf of Mexico (GOM). As explained by EIA, one ofthe primary purposes of this study is to help EIA analysts with cost analyses and projections that theorganization is required to provide. Consequently, the study focused on the most active areas, and theresults include the following: Determining current costs and major cost components,Identifying key cost drivers and their impact on range of cost,Reviewing historical cost trends and evolution of the key cost drivers as well designs and drillingprograms have evolved,Analyzing the relevant data to determine future trends, particularly for key cost drivers in lightof recent commodity price decreases and related cost reductions, andProviding data and analyses to determine the correlations between activities related to drillingand completion and total well costIHS based this study on 2014 costs. However, the collapse of oil prices in late 2014 has forced reductionof many upstream costs, thus modifying the cost structure. Consequently, this report addresses futurecost indices, including cost reductions for 2015, and how key cost drivers will continue to play a role inchanging costs.This report begins with a discussion of summary results for the selected onshore basins and deep waterGulf of Mexico, and then addresses methodologies and assumptions. The body of the report iscomprised of detailed discussions of costs for each basin, including the deep water Gulf of Mexico. Alarge data set is also available in conjunction with this report, which includes many additional graphsand charts not included herein. These are listed in the Appendix.A.Background to the StudyAs a result of low oil prices, US onshore oil field development had nearly come to a standstill by the year2000. However, relatively stronger natural gas prices encouraged the drilling of vertical wells inconventional natural gas plays and some development of coalbed methane. The shale boom began withthe Barnett Shale taking off in 2004, employing modern unconventional drilling and completiontechniques such as horizontal drilling and complex hydraulic fracturing (fracking). These techniquesevolved as they spread to other plays such as the Haynesville in Northern Louisiana, the Fayetteville inNorthern Arkansas and the Marcellus Shale in Pennsylvania and West Virginia. Increasing natural gasprices from 2001 through 2008 also fueled this evolution.While natural gas prices collapsed in 2008, oil prices, which had begun an upward trajectory early in thedecade, dropped as well. However, unlike natural gas, oil prices quickly rebounded, driving operators toexplore new opportunities in search of oil plays and liquid-rich gas plays containing associatedcondensate and natural gas liquids (NGLs). New plays such as the Eagle Ford and Bakken becameprofitable by drilling and fracking horizontal wells, tapping into the shale source rocks of earlierproductive plays.3
EIA – UPSTREAM COST STUDYAt the same time, deep water and deep formation areas offshore, once prohibitively expensive toexplore or develop had new technology and strong oil prices to encourage more difficult operations.Moving into deeper water was accompanied by technical and commercial challenges, as was drilling intodeep formations with high temperature and high pressure (HTHP). However, with large deep waterdiscoveries, such as Jack in 2004, deep water exploration and development in the Gulf of Mexicospurred ahead.Since the advent of unconventional plays, drilling and completion of wells have continued to evolve withtheir associated costs increasing commensurately. For example, short lateral lengths of just 1000 to2000 feet have increased substantially to as much as 10,000 feet in some plays. Proppant use andintensity of hydraulic fracturing have also increased, resulting in huge increases in well performance.This evolution has led to significantly higher well cost (on average greater than 6 million dollars(MM )/well). However the associated productivity gains have offset these costs, resulting in lower unitcosts per barrel of oil equivalent (Boe) and providing better returns on investment. Operators continueseeking the optimal return through two means: 1) persistently driving down actual costs by increasingefficiency, and 2) trying to optimize unit costs ( /Boe) by finding the right balance between high-costcompletion design and enhanced performance.In 2011, as commodity prices stabilized, we saw a large uptick in drilling, resulting in shortages of supplyand increased costs. To combat this trend, some operators became more vertically integrated into fieldservices and supplies. For example, some companies purchased or developed sand mines, watertreatment facilities, gas processing plants, pipeline infrastructure, or even drilling rigs to have primaryaccess to services that could ensure lower costs.By 2014, as plays became delineated and the better performing areas were identified, the Bakken, EagleFord, Permian Basin and Marcellus plays emerged as the most significant contributors to theunconventional oil and natural gas supply and capital expenditure within the U.S. The oil price collapseof 2014 forced changes upon the market, including capital cost reductions, downsized budgets and morefocused concentration on better prospects within these plays. Some offshore capital costs (such as rigrates) were also being reduced, but unlike unconventional plays where capital expenditures can beturned on and off relatively quickly, offshore development and budgeting is a longer term proposition.Therefore, we may not see substantial changes in offshore activity levels unless low prices persist forseveral years.This study focuses on areas of intense current and forecasted activity that will have a material effect onfuture production and capital expenditure; these include four onshore plays or basins, namely theBakken, Eagle Ford, Marcellus and Permian Basin, as well as the deep water Gulf of Mexico. No attemptis being made to provide an apples-to-apples comparison between the onshore and offshore basins, asthe mode of capital operating expenditure is vastly different. Since this comparison is not practical,onshore and offshore basins are discussed separately throughout the report.B.Scope and ApproachUpstream costs analyzed within this study include capital and operating costs associated with drilling,completing and operating wells and facilities. Some pipeline costs are included in the offshore analysis.The analysis uses cost modeling that incorporates the following taxonomy.4
EIA – UPSTREAM COST STUDYOnshore1. Drilling – Within onshore basins drilling comprises about 30-40% of total well costs. These costsare comprised of activities associated with utilizing a rig to drill the well to total depth andinclude:a. Tangible Costs such as well casing and liner, which have to be capitalized anddepreciated over time, andb. Intangible Costs, which can be expensed and include drill bits, rig hire fees, logging andother services, cement, mud and drilling fluids, and fuel costs.2. Completion – Within onshore basins completion comprises 55-70% of total well costs. Thesecosts include well perforations, fracking, water supply and disposal. Typically this work isperformed using specialized frack crews and a workover rig or coiled tubing and include:a. Tangible Costs such as liners, tubing, Christmas trees and packers, andb. Intangible Costs include frack-proppants of various types and grades, frack fluids whichmay contain chemicals and gels along with large amounts of water, fees pertaining touse of several large frack pumping units and frack crews, perforating crews andequipment and water disposal.3. Facilities – Within onshore basins facilities construction comprises 7-8% of total well cost. Thesecosts include:a. Road construction and site preparation,b. Surface equipment, such as storage tanks, separators, dehydrators and hook –up togathering systems, andc. Artificial lift installations.4. Operation – These comprise primarily the lease operating expenses. Costs can be highlyvariable, depending on product, location, well size and well productivity. Typically these costsinclude:a. Fixed lease costs including artificial lift, well maintenance and minor workover activities.These accrue over time, but are generally reported on a /boe basis.b. Variable operating costs to deliver oil and natural gas products to a purchase point orpricing hub. Because the facilities for these services are owned by third partymidstream companies, the upstream producer generally pays a fee based on the volumeof oil or natural gas. These costs are measured by /Mcf or MMbtu or /bbl and includegathering, processing, transport, and gas compression.Offshore DeepwaterThe rig and related costs account for 90-95% of total well costs, for both drilling and completion andprimarily includes the day rate of utilizing drilling ship or a semi-submersible drilling rig for drilling,completing the well, and all other rig related costs, such as drilling crew, fuel, consumables, supportvessels, helicopters, logging, cementing, shore base supplies, etc.5
EIA – UPSTREAM COST STUDY1. Drilling – The drilling activity itself comprises about 60% of total offshore well D&C cost. Thesecosts are comprised of activities associated with drilling the well to total depth and include righire fees, drilling bits, logging, casings, liners and other services, cement, mud and drilling fluids,fuel costs, offshore support services and other services.2. Completion – Within offshore basins, this comprises less than 40% of total well costs. Thesecosts are comprised of completion rig hiring, well perforations and testing, completion fluid,transportation/logistics, well stimulation and sand control, and well head equipment.3. Injection Wells – For a typical field, additional wells are drilled to reinject produced waterand/or gas in order to maintain reservoir pressure.4. Facilities – Production facilities are another major expense and may include one or more of thefollowing:a. Floating facilities, such as tension leg platforms (TLP), Spars or Semisubmersibleplatforms. These facilities may include topsides, production equipment, such ascompressors, separators and processing units, and capabilities to drill additional wells.b. Sub-sea tiebacks to production facilities with customized sea floor assembly and riserconnecting platforms.5. Operation – Operation costs are primarily comprised of the lease operating expenses, which canbe highly variable depending on product mix, water depth, distance from the shore, facility sizeand configuration. These costs are typically accrued and estimated on a monthly basis. Costsinclude:a. Variable operating costs, which may consist of costs associated with delivery of oil andgas products to a purchase point or pricing hub when products leave the operator-builtpipeline and enter a transportation system controlled by a third party. Since theupstream producer pays a fee based on the volume of oil or gas, costs are measured by /Mcf or MMbtu or /bbl.6. Transport - For new field development, a pipeline will be required to tie into existinginfrastructure from the production facilities. Such capital expenditures are borne by theproducer.Cost ModelingIn the cost modeling, a rate was applied to determine the total cost of an item by determining a wellor facility configuration and the amount of material or labor required for each major item. The costfor each item was summed up to obtainthe total well or facility cost.All costs and calculations are based onincorporating the inflation rate and aredetermined using nominal dollars. Webelieve that eliminating inflationprovides a better method fordetermining costs going forward,especially for offshore facilities whereconstruction and implementation cantake many years. While no adjustmentsFigure1-1: Historical and forecasted inflation6
EIA – UPSTREAM COST STUDYto costs were made for inflation, we have included historical and forecasted inflation rates in theevent the reader desires to back-calculate costs by removing inflation (see Figure 1-1).II.Summary Results and Conclusions – Onshore Basins/PlaysA.Basic Well Design and Cost for 2014Total well capital costs within the four onshore basin/plays (plays) are grouped by drilling, completionand facilities (see Figure 2-1) and range from 4.9 MM to 8.3 MM. An additional 1.0 MM to 3.5 MMin lease operating expenses may be incurred over a 20-year well life cycle and a similar amount may beincurred for gathering, processing and transport (GPT) costs over the life of the well. Play location, welldimension, completion, (hydraulic fracture) intensity and design determine the ultimate cost per well.Well type (oil/gas), location, performance or amount of production and longevity determine totaloperating expense.Figure 2-1: Allocation of drilling and completionDrilling costs include rig rental, tubularssuch as casing and liner, drilling fluids,diesel fuel and cement. Total well cost canvary greatly from play to play and within aplay depending on such factors as depthand well design. Average horizontal welldrilling costs range from 1.8 MM to 2.6MM and account for 27% to 38% of a well’stotal cost. Before the expansion of
Independent Statistics & Analysis www.eia.gov U.S. Department of Energy Washington, DC 20585 . . Cost per vertical depth and horizontal length . 5. March 2016 U.S. Energy Information Administration Trends in U.S. Oil and Natural Gas Upstream Costs 1 Summary The profitability of oil and natural gas development activity depends on both .