Transcription
Reforming States Group – October 15, 2015Reducing Avoidable EmergencyDepartment Utilization
First things first Conflicts or disclosures: None Thanks and acknowledgements A brief follow-up from RSG 2014
Case 1 – Medication mix-up
Case 2 – Swedish light bulbs
Is avoidable ED use a major problem?The scope of theproblem
Background About 10-15% of all ED visits are for non-urgent orprimary care treatable issues Medicaid beneficiaries are more likely to use the ED
Increasing ED Use EDs are now the main source of hospital admissions– About 70% of non-elective admissions are throughthe ED Non-elective admissions from clinics dropped by 25%between 2003 and 2009
A snapshot of ED use in the VAUsage category(visits/year)# of patients (%)# of visits (%)1493,391 (53)493,391 (24.5)2-4356,258 (38.3)910,195 (45.3)5-1070,741 (7.6)447,875 (22.3)11-259,705 (1.0)137,152 (6.8) 25617 (0.07)21,669 (1.1)Raven, et al. (2013). Annals of Emergency Medicine. 62(2):151-159
Measuring avoidable ED use Identifying avoidable ED visits is challenging– ED discharge diagnoses that are “non-emergent” or“primary care treatable”– Various algorithms are promoted– Poor correlation between the patient’s complaint and theseriousness of the issue or ultimate need for admission A patient with chest pain could have acid reflux or could behaving a heart attackRaven, et al. (2013). JAMA. 309(11):1145-1153.
Area of interest and innovation CMS Diversion Grant Program, 2008-2012– 50 million to support 29 projects in 20 states Increased primary care capacity ED to primary care linkages Programs targeting superutilizers– 12 states (16 programs) submitted brief results– Effect and sustainability of the programs was mixed
Why do people go to the ED anyway?Causes of avoidableED utilization
AccessGindi, et al. (2014). NCHS Data Brief. No. 160
AccessGindi, et al. (2014). NCHS Data Brief. No. 160
Patient factorsCharacteristicsOdds ratio for 11-25 visitsOdds ratio for 25 oid prescription5.065.08Substance abuse2.852.97Raven, et al. (2013). Annals of Emergency Medicine. 62(2):151-159
Patient factorsPatient SubgroupNumber% of all superutilizersTerminal cancerpatients110.7%Emergency dialysispatients301.8%Orthopedic surgerypatients603.6%Trauma patients19511.6%Patients with seriousmental healthdiagnosis68540.7%Patients with multiplechronic conditions70141.6%Johnson, et al. (2015). Health Affairs. 34(8):1312-1319.
Practice culture and patterns Changing relationships between PCPs, EDs, andhospitalists Productivity demands for PCPs make it hard toaccommodate acutely ill patients– These patients are often referred to the ED– Fewer direct admissions from outpatient clinics– Ease of complex diagnostic work-upsMorganti, et al. (2013). RAND Research Report.
Does overuse of the ED matter?Impacts of avoidableED utilization
Overcrowding ED use grew at twice the rate of population growth from2001 to 2008 198,000 fewer hospital beds during the same period This has led to overcrowding and boarding– Associated with poorer patient outcomes
Lost opportunity for care coordination Poor coordination with PCPs and erratic follow-up Preventive care falls through the cracks Medication errors
Perspectives on ED “cost”DiagnosisMean total ED billMean total PC office billOtitis media 410 157Acute pharyngitis 562 152Urinary tract infection 776 189Mehrotra, et al. (2009). Annals of Internal Medicine. 151(5): 321-328.
Perspectives on ED “cost”Caldwell, et al. (2013). PloS One. 8(2): e55491.
Perspectives on ED “cost”Home escriptions20%Medical Expenditure Panel Survey, 2009Inpatient29%Office-basedprovider24%
Perspectives on ED “cost”Alhassani, et al. (2012). New England Journal of Medicine. 366(4): 289-291.
Perspectives on ED “cost”“Put simply, when an EDis fully staffed to manage2 major traumas, amyocardial infarction anda septic neonate at thesame time, it does nottake many additionalresources to evaluate asprained ankle or aheadache.”Lowe, et al. (2012). Annals of Emergency Medicine. 58(3):235-238.
What is being tried to reduce avoidable ED use?Proposed solutions
CMS Guidance Center for Medicaid and CHIP Services (CMCS) Bulletin onreducing non-urgent use (July 2014)– Three proposed strategies: Expanded primary care access Programs targeting super-utilizers Programs addressing co-morbid mental health and substanceabuse issues– Differential payments and cost-sharing
CMS Guidance CMCS Bulletin on super-utilizer programs– Offers support by way of: Enhanced federal match for MMIS redesign or healthinformation exchanges Assistance with utilization review and data analysis Temporary enhanced match for Medicaid health homes Shared savings methodologies for integrated care and casemanagement– Super-utilizer program case studies OR, NC, MN, ME, MI, VT
Studied interventions Patient education programsIncreased primary care capacityPre-hospital diversionManaged care: Capitation and gatekeepingPatient financial incentives
Studied Interventions Intensive case management programs– Care coordination by social workers– Crisis intervention– Supportive therapy– Assistance with benefits applications– Substance abuse treatment– Supportive housing– “Assertive community outreach”
Discussion1. Is this issue seriousenough to warrantattention frompolicymakers?2. What kind ofevidence would youwant that theseprograms work beforemoving forward?
What does the evidence say about these programs?Systematic reviews ofthe evidence
Systematic Review – Morgan 2012 Non-ED interventions to reduce ED visits5 RCTs, 34 observational studiesMostly very low quality because of designMix of public and private insuranceSome studies outside the U.S.
Systematic Review – Morgan 2012 How many studies?What outcomes were measured/reported?Did the studies reach similar conclusions?Was the estimate of the effect narrow or wide?What’s your overall assessment of the evidence?
Systematic Review – Patient Education Patient education interventions (5 studies)– 2 studies showed 20-80% decrease in ED use– 3 studies with non-significant decreases
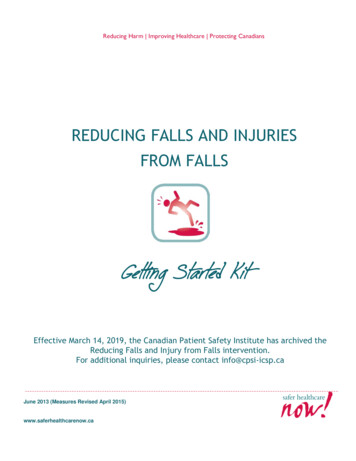
Systematic Review – Expanded access Expanded non-ED capacity interventions (10 studies)– Mix of new community clinics and increased access atexisting clinics– 4 studies showed decreased ED use (9% to 54%)– 5 studies found no difference– 1 study found a 21% increase in ED use– Most found significant increase in non-ED care– 2 reported on total cost with mixed results (-16% to 20%)
Systematic Review – Pre-hospital diversion Pre-hospital diversion interventions (2 studies)– 1 study (U.S.-based) offered 1,000 low acuitypatients care at home or in the PC office– 7% decrease in ED use compared with matchedhistorical controls
Systematic Review – Managed care Managed care interventions (12 studies)– 6 studies on effects of capitation, 5 studies on PCgatekeeping, 1 hybrid study– 9 studies found decreases in ED use of 1% to 46%– 3 studies found no difference in ED use– 2 reported total cost decreases with capitation– Better designed trials showed more modest effects
Systematic Review – Financial incentives Financial incentive interventions (10 studies)– Mix of co-payments, co-insurance, or highdeductibles– 9 studies found decreases in ED use of 3% to 50%– 1 study found increased ED use of 34%– 3 reported mixed cost outcomes
Systematic Review – Althaus 2011 Programs targeting super-utilizers3 RCTs, 8 before-and-after studiesLow-to-moderate quality evidenceAbout half conducted in the U.S.Mostly case management of varying intensityRelatively short follow-up periods (5 to 24 months)
Systematic Review – Althaus 2011 7 programs showed decreases in ED use3 programs showed no difference1 program showed an increase in ED useEffect on total cost (from perspective of the hospital) was mixed in 3studies– 1 RCT reporting on cost found better social and clinicaloutcomes at the same cost as “usual care”Other benefits: decreased substance abuse and homelessness,increased primary care engagement
Discussion1. Is this evidenceadequate to supportwider adoption of theseprograms?2. What concerns doyou have about theevidence, and whatother outcomes wouldbe of interest?
Risk of bias in study design Higher quality studies less likely to show effects Outcomes are often preliminary (6 or 12 month effects) Publication bias
Risk of before-and-after studies Observed differences in a group after the interventioncould be due to:– Other changes occurring simultaneously– Natural history of the problemJohnson, et al. (2015). Health Affairs. 34(8):1312-1319.
Risk of before-and-after studies The natural history of ED use may also vary byenrollment time
Indirectness Caution with multicomponent interventions Broader use of highly targeted interventions Lack of head-to-head comparisons (choosing amongmultiple policy options)
Imprecision Wide estimates of the effects in the studies “Discounting” for effects in the real world
Unintended outcomes Co-pays in Oregon Medicaid (OHP vs OHP Plus)Service typeProbability ofservice useExpenditureper userExpenditureper personED-8% 8%-2%Inpatient 27%-6% 20Overall 2%Wallace, et al. (2008). Health Services Research. 43(2):1312-1319.
The evidence isn’t clear – how do we move forward?Dealing withinsufficient evidence
An opportunity When the evidence is lacking, policy innovation can beeven more important– Must be done with careful plans for evaluation– Focus on outcomes that matter to you aspolicymakers– Academic and agency collaborations
Washington ER is for Emergencies Collaboration with hospitals and providers Seven best practices:– Health information exchange– Patient education– Identification of frequent users– Care plans and primary care follow-up– Strict narcotic guidelines– Participation in prescription drug monitoring– Feedback to hospitals on performance
Washington ER is for Emergencies 10% reduction in ED use with a 23% reduction for themost frequent users Overall cost savings of 10 million in fee-for-service and 23 million in managed care
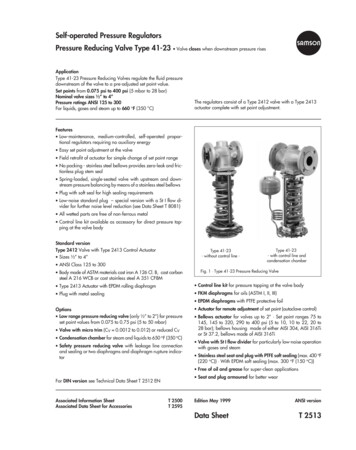
Hennepin County Ambulatory ICU Coordinated care model for 300 highest-utilizers– Primary care, nurses, pharmacists, social worker,community health workers, behaviorists, substanceuse treatment– Major focus on establishing stable housing
Hennepin County Ambulatory ICU
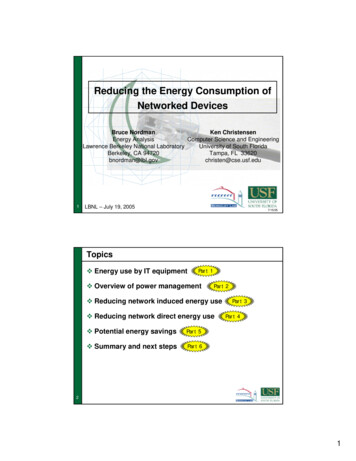
Hennepin County Ambulatory ICU200%150%100%50%0%-50%Outpatient EMS services ED servicesservicesInpatient Totoal cost ofadmissionscare
What’s on the horizon?Emerging data andideas
Effect of primary care medical homes Medicare beneficiaries in PCMHs had lower rates of EDuse than those in non-PCMHs A pilot PCMH and shared saving program in PA reducedED (and inpatient) utilization and improved quality A multipayer PCMH pilot in CO reduced ED use by 810%Pines, et al. (2015). Annals of Emergency Medicine. 65(6):652-660Friedberg, et al. (2015). JAMA Internal Medicine. 175(8):1362-1368Rosenthal, et al. (2015). Journal of General Internal Medicine. Pre-pub [Oct 8, 2015]
Cold-spotting? Seeks to understand and address community factorsthat lead to avoidable healthcare useWestfall, J.M. (2013). Journal of the American Board of Family Medicine. 26(3):228-230
Contact: obley@ohsu.eduQuestions and Discussion
Four studies showed significant decreases in ED-use ranging from 對9% to 54%, five studies found no significant effects, and one found an increase in ED use of 21%. As expected, most of these st\൵dies found substantial increases in the use of non-ED care. The effect of these interventions on total cost were reported in tw對o studies with conflicting results ranging from increased costs of .