Transcription
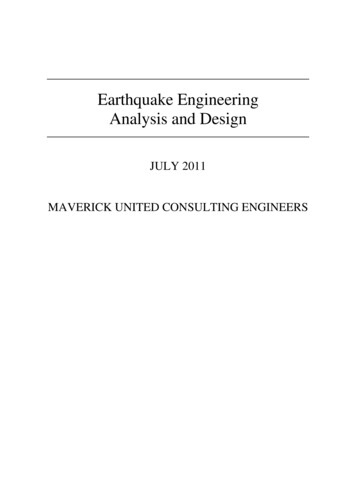
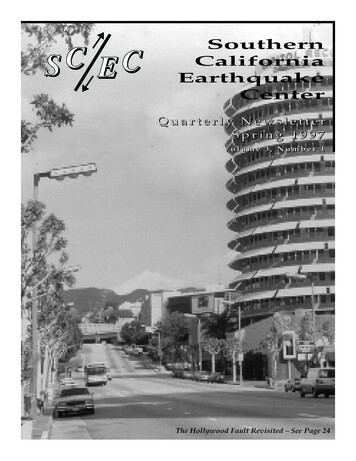
Scientist:Earthquake StationDirections:1. Refer to the data table and use the difference in arrival times to determine the distance to theearthquake epicenter for Station 2.2. Analyze the seismogram below and fill out the missing information for Station 3 in the data table.3. Use a compass to draw circles on the map around Stations 2 and 3 according to the distance data.4. Place an “X” at the position of the earthquake epicenter on the map.NStation 3SeismographStationArrival TimesP waveS wave211:35:50 a.m.11:37:55 a.m.3Difference inArrival Times2 minminMr. Rizzo55 secsecwww.regents-earthscience.comDistance to Epicenter(km)
NMr. Rizzowww.regents-earthscience.com
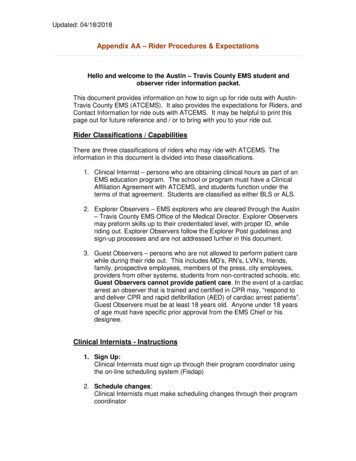
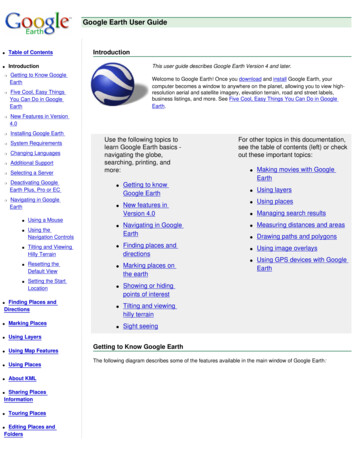
N5500 km1700 kmSeismographStationP waveArrival TimesS wave211:35:50 a.m.11:37:55 a.m.2 min55 sec1700 km311:41:00 a.m.11:48:10 a.m.7 min10 sec5500 kmMr. RizzoDifference inArrival Timeswww.regents-earthscience.comDistance to Epicenter(km)
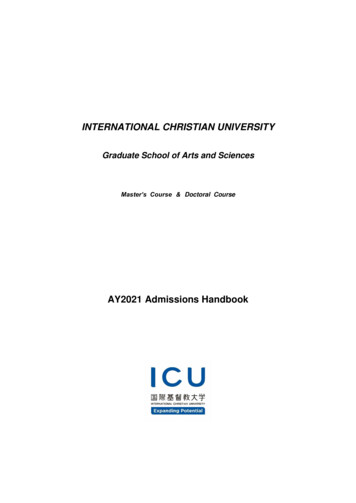
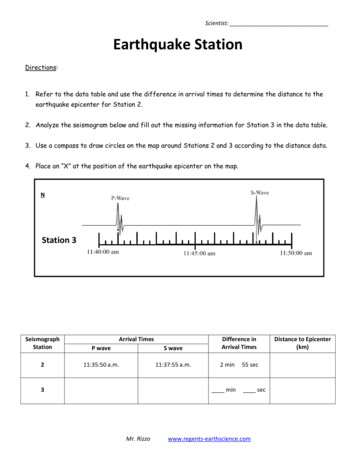
Scientist:Earthquake StationDirections:1. Refer to the data table and use the difference in arrival times to determine the distance to theearthquake epicenter for Station 2.2. Analyze the seismogram below and fill out the missing information for Station 3 in the data table.3. Use a compass to draw circles on the map around Stations 2 and 3 according to the distance data.4. Place an “X” at the position of the earthquake epicenter on the map.OStation 3SeismographStationArrival TimesP waveS wave203:21:00 a.m.03:25:10 a.m.3Difference inArrival Times4 minminMr. Rizzowww.regents-earthscience.com10 secsecDistance to Epicenter(km)
OMr. Rizzowww.regents-earthscience.com
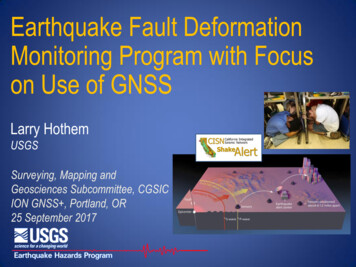
O2700 km3300 kmSeismographStationP waveArrival TimesS wave203:21:00 a.m.03:25:10 a.m.4 min10 sec2700 km303:22:00 a.m.03:26:50 a.m.4 min50 sec3300 kmMr. RizzoDifference inArrival Timeswww.regents-earthscience.comDistance to Epicenter(km)
Scientist:Earthquake StationDirections:1. Refer to the data table and use the difference in arrival times to determine the distance to theearthquake epicenter for Station 2.2. Analyze the seismogram below and fill out the missing information for Station 3 in the data table.3. Use a compass to draw circles on the map around Stations 2 and 3 according to the distance data.4. Place an “X” at the position of the earthquake epicenter on the map.PStation 3SeismographStationArrival TimesP waveS wave208:15:35 p.m.08:20:05 p.m.3Difference inArrival Times4 minminMr. Rizzowww.regents-earthscience.com30 secsecDistance to Epicenter(km)
PMr. Rizzowww.regents-earthscience.com
PSeismographStationP waveArrival TimesS wave208:15:35 p.m.08:20:05 p.m.4 min30 sec3000 km308:14:00 p.m.08:17:30 p.m.3 min30 sec2200 kmMr. RizzoDifference inArrival Timeswww.regents-earthscience.comDistance to Epicenter(km)
Scientist:Earthquake StationDirections:1. Refer to the data table and use the difference in arrival times to determine the distance to theearthquake epicenter for Station 2.2. Analyze the seismogram below and fill out the missing information for Station 3 in the data table.3. Use a compass to draw circles on the map around Stations 2 and 3 according to the distance data.4. Place an “X” at the position of the earthquake epicenter on the map.QStation 3SeismographStationArrival TimesP waveS wave204:54:30 p.m.04:59:30 p.m.Difference inArrival Times5 min3Mr. Rizzowww.regents-earthscience.com00 secDistance to Epicenter(km)
QMr. Rizzowww.regents-earthscience.com
QSeismographStationArrival TimesP waveS wave204:54:30 p.m.04:59:30 p.m.5 min00 sec3400 km304:53:00 p.m.04:56:50 p.m.3 min50 sec2400 kmMr. RizzoDifference inArrival Timeswww.regents-earthscience.comDistance to Epicenter(km)
Scientist:Earthquake StationDirections:1. Refer to the data table and use the difference in arrival times to determine the distance to theearthquake epicenter for Station 2.2. Analyze the seismogram below and fill out the missing information for Station 3 in the data table.3. Use a compass to draw circles on the map around Stations 2 and 3 according to the distance data.4. Place an “X” at the position of the earthquake epicenter on the map.RStation 3SeismographStationArrival TimesP waveS wave202:19:40 p.m.02:24:00 p.m.3Difference inArrival Times4 minminMr. Rizzowww.regents-earthscience.com20 secsecDistance to Epicenter(km)
RMr. Rizzowww.regents-earthscience.com
RSeismographStationArrival TimesP waveS wave202:19:40 p.m.02:24:00 p.m.4 min20 sec2800 km302:22:00 p.m.02:28:10 p.m.6 min10 sec4500 kmMr. RizzoDifference inArrival Timeswww.regents-earthscience.comDistance to Epicenter(km)
Scientist:Earthquake StationDirections:1. Refer to the data table and use the difference in arrival times to determine the distance to theearthquake epicenter for Station 2.2. Analyze the seismogram below and fill out the missing information for Station 3 in the data table.3. Use a compass to draw circles on the map around Stations 2 and 3 according to the distance data.4. Place an “X” at the position of the earthquake epicenter on the map.SStation 3SeismographStationP waveArrival TimesS wave201:32:00 p.m.01:35:50 p.m.3Difference inArrival Times3 minminMr. Rizzowww.regents-earthscience.com50 secsecDistance to Epicenter(km)
SMr. Rizzowww.regents-earthscience.com
SSeismographStationP waveArrival TimesS wave201:32:00 p.m.01:35:50 p.m.3 min50 sec2400 km301:33:00 p.m.01:37:30 p.m.4 min30 sec3000 kmMr. RizzoDifference inArrival Timeswww.regents-earthscience.comDistance to Epicenter(km)
Refer to the data table and use the difference in arrival times to determine the distance to the earthquake epicenter for Station 2. 2. Analyze the seismogram below and fill out the missing information for Station 3 in the data table. 3. Use a compass to draw circles on the map around Stations 2 and 3 according to the distance data.