Transcription
COLON792ARTICLEDetection of Gluten in Gluten-Free Labeled RestaurantFood: Analysis of Crowd-Sourced DataBenjamin A. Lerner, MD1, Lynn T. Phan Vo, BA2, Shireen Yates, MBA3, Andrew G. Rundle, DrPH2, Peter H.R. Green, MD1 andBenjamin Lebwohl, MD, MS1,2INTRODUCTION: Adherence to a gluten-free (GF) diet is the mainstay of therapy for celiac disease. Until now, thosewishing to avoid gluten in restaurants had to rely on menu labels, word of mouth, intuition, andrestaurant workers’ advice, with a relative dearth of supporting data. We used crowd-sourced data fromusers of a portable gluten detection device to estimate rates of, and identify risk factors for, glutencontamination of supposed GF restaurant foods.METHODS:We analyzed data from a portable gluten detection device (Nima), collected across the United Statesduring an 18-month period by users who opted to share the results of their point-of-care tests. Data weresorted by region, time of day, median household income in the restaurant’s vicinity, restaurant genre,and food items. We used the x2 test for bivariate analysis and multiple logistic regression for multivariateanalysis to identify predictors of gluten detection in restaurant food.RESULTS:There were 5,624 tests, performed by 804 users, in the examined period. Gluten was detected in 32%of GF labeled foods. Rates of gluten detection differed by meal, with 27.2% at breakfast and 34.0% atdinner (P 5 0.0008). GF labeled pizza and pasta were most likely to test positive for gluten, with glutendetected in 53.2% of pizza and 50.8% of pasta samples. On multivariate analysis, GF labeled food wasless likely to test positive for gluten in the West than in the Northeast United States (odds ratio 0.80;95% confidence interval 0.67–0.95).CONCLUSIONS:This study of crowd-sourced data suggests that a substantial fraction of GF labeled restaurant foodscontain detectable gluten. Although the highly sensitive Nima device may detect gluten at levels 20parts per million (ppm), leading to gluten exposure of unknown clinical significance, our findings raisea potential concern. In addition, our findings of higher rates of gluten detection in pizza and pastaprovide practical data when providing dining strategies for patients with celiac disease.Am J Gastroenterol 2019;114:792–797. DUCTIONCeliac disease (CD) is an autoimmune disorder triggered by theconsumption of gluten, a protein found in cereal grains, wheat,rye, and barley. CD currently affects approximately 1% of thepopulation (1,2), and its prevalence is increasing (3). The diseaseprimarily affects the small intestine, and common symptomsinclude iron deficiency, bloating, constipation, chronic fatigue,and abdominal pain (4).Adherence to a gluten-free (GF) diet is the mainstay of therapyfor CD. Despite its effectiveness, as many as 80% of patients withCD report difficulty maintaining this lifestyle (5). Indeed, inadvertent gluten ingestion has been cited as the leading cause ofnonresponsive CD (6,7), and a recent study measuring traces ofgluten in urine and stool suggested that many patients with CDaccidentally consume enough gluten to trigger symptoms andcause intestinal damage (8).To protect patients with CD from unintentionally ingestinggluten, the Food and Drug Administration issued a rule in August2013 that packaged GF labeled foods must contain less than 20ppm of gluten. No similar rule applies to restaurant foodsclaiming to be GF and, consequently, potential gluten exposurewhen dining out is a source of anxiety for many patients with CD.In one study, 83% of patients with CD or non-celiac gluten sensitivity found the GF diet to be a problem in restaurants and 63%avoided restaurants altogether (9). Multiple surveys of patientswith CD found dining out to be the most common lifestyle situation presenting difficulty when following a GF diet, more sothan traveling, socializing, and personal relationships (5,10).1Department of Medicine, Celiac Disease Center, Columbia University Medical Center, New York, NY, USA; 2Department of Epidemiology, Mailman School of PublicHealth, Columbia University Medical Center, New York, NY, USA; 3Nima Labs, San Francisco, California, USA. Correspondence: Benjamin Lebwohl, MD, MS.E-mail: BL114@columbia.edu.Received December 1, 2018; accepted February 13, 2019; published online March 26, 2019The American Journal of GASTROENTEROLOGYVOLUME 114 MAY 2019 www.amjgastro.comCopyright 2019 by The American College of Gastroenterology. Unauthorized reproduction of this article is prohibited.
In the present study, we aimed to quantify rates of glutencontamination of restaurant foods and identify risk factors associated with the presence of gluten. The recent advent of a portable gluten detection device allowed us to use crowd-sourceddata to estimate the prevalence of gluten contamination in restaurants throughout the United States.METHODSGluten sensorWe obtained uploaded data from users of Nima, a commerciallyavailable gluten detection device. Nima consists of a 3-inch-tallsensor and single-use capsules that contain test strips loaded withproprietary antigluten antibodies. To test food for the presence ofgluten, users place a pea-sized sample into the capsule. Screwing onthe lid grinds the sample, which is then mixed with an extractionbuffer. The resulting solution passes onto the test strip, which isthen read by an optical sensor. The output of the sensor is a binaryresult, either gluten detected (displayed as a wheat symbol) orgluten not detected (displayed as a smiley face). The Nima sensorcurrently sells for 229 on Amazon; each test capsule costs 6.Recently published validation data suggest that Nima has highsensitivity for detecting gluten at levels of 20 ppm or more. Thedevice’s specificity is high for purely GF ingredients, but whentesting foods that are intentionally “spiked” with gluten at levels ,20 ppm, the specificity is considerably lower; for a food “spiked” toa level in the 10 ppm range (still considered GF by regulatorystandards), the device’s specificity is closer to 50% (11,12). Users ofNima have the option of pairing the device with their smartphones,enabling them to share test results with Nima and other users.Study designWe examined all shared tests performed in the United States between August 2016 and January 2018. Each test included a date, time,restaurant name, address, food item tested, the presence or absenceof a GF label, and test result. Using these parameters, we calculatedrates of gluten detection by region, meal, median household incomein the restaurant’s vicinity, restaurant genre, and specific foods.For geographic analysis, we used the 4 regions used by theCensus Bureau: Northeast (Connecticut, Maine, Massachusetts,New Hampshire, New Jersey, New York, Pennsylvania, RhodeIsland, Vermont), Midwest (Illinois, Indiana, Iowa, Kansas,Michigan, Minnesota, Missouri, Nebraska, North Dakota, Ohio,South Dakota, Wisconsin), South (Alabama, Arkansas, Delaware,District of Columbia, Florida, Georgia, Kentucky, Louisiana,Maryland, Mississippi, North Carolina, Oklahoma, South Carolina, Tennessee, Texas, West Virginia, Virginia), and West(Alaska, Arizona, California, Colorado, Idaho, Hawaii, Montana,Nevada, New Mexico, Oregon, Utah, Washington). For analysisby meal, we defined breakfast time as 5 AM–10:59 AM, lunchtimeas 11 AM–2:59 PM, and dinner time as 3 PM–11:59 PM. Medianhousehold income in a restaurant’s vicinity was extrapolatedfrom zip codes and the 2016 American Community Survey. Zipcodes were ranked by median household income and then divided into quartiles.Building on previous methods used in the neighborhood foodenvironment literature, we categorized restaurants into quickservice, fast casual, and casual dining (13). We did this by crossreferencing the restaurants in our dataset with a list of nearly 400restaurant chains sorted by restaurant type. We made this list bycombining several annual lists of top chains from Technomics (aconsulting firm for the restaurant industry; Chicago, IL) and Dun 2019 by The American College of Gastroenterology& Bradstreet (a company that tracks commercial data; Short Hills,NJ), with results from Google searches of “CITY NAME and TopFast Food Restaurants.” Although we were able to sort severalrestaurants into additional categories using this methodology(fine dining, sweets, and coffee establishments), these categorieswere not included in the analysis because of a low number of testsperformed in these settings.The names of specific foods were free-texted by users. Given thisheterogeneity, we classified foods manually, first reviewing the datato identify common dishes and then assigning each test to a foodcategory. We excluded tests that included more than one food item,and we restricted our analysis to food types with .100 tests.Statistical analysesAll statistical analyses were performed in SAS University Edition(SAS Institute, Cary, NC). For bivariate analyses, categorical variables were compared using the x2 test. For multivariate analyses, weused multiple logistic regression, adjusting for region, medianhousehold income, and meal time, for calculating odds ratios (ORs)and 95% confidence intervals (CIs). A 2-tailed P value of ,0.05was considered statistically significant. This study was deemed “nothuman subjects research” by the Institutional Review Board ofColumbia University Medical Center because data were deidentified before being provided to the investigators.RESULTSGeneral characteristics of gluten testsDuring the study period, there were 5,624 tests performed by 804users. Eighty-four percent of tested foods carried a GF label(Table 1). Fifty-nine percent of tests were performed duringdinner hours; 27% were during lunch hours; about 11% wereduring breakfast hours; and 3% of tests were done outside ofTable 1. General characteristics of Nima testsGF labelYes4,732 (84.1%)No892 (15.9%)Time of day/mealBreakfast (5 AM–10:59 AM)635 (11.3%)Lunch (11 AM–2:59 PM)1,494 (26.6%)Dinner (3 PM–11:59 PM)3,327 (59.2%)Other (12 AM–4:59 AM)168 (3.0%)RegionNortheast980 (17.4%)South1,378 (24.5%)Midwest690 (12.3%)West2,576 (45.8%)Median household income, zip code quartileFirst (lowest)Second423 (7.7%)622 (11.3%)Third1,027 (18.6%)Fourth (highest)3,449 (62.5%)GF, gluten-free.The American Journal of GASTROENTEROLOGYCopyright 2019 by The American College of Gastroenterology. Unauthorized reproduction of this article is prohibited.793COLONGluten Detection in Restaurant Food
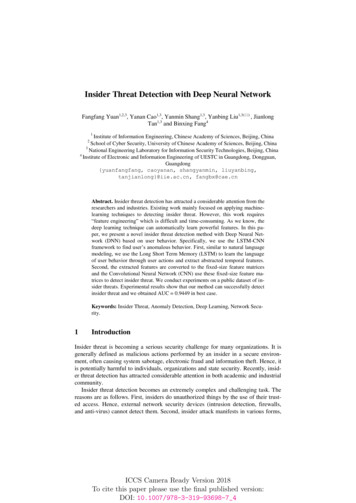
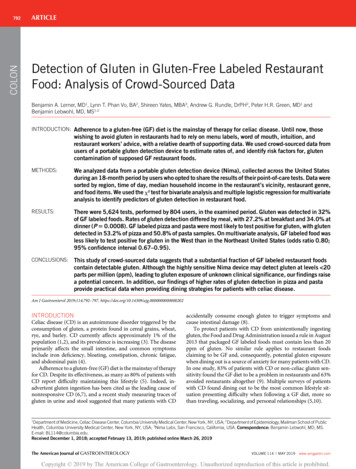
COLON794Lerner et al.these hours. Tests were reported from 50 states. The greatestnumber of tests was performed in the West, accounting for about46% of the data, followed by the South, accounting for another25%. Regarding the distribution of data by median householdincome, most tests were performed at restaurants in the wealthiest quartile of zip codes, and 81% were performed in the wealthierhalf of zip codes.Table 2. Factors associated with detection of gluten in GF labeledfoodsaGluten present in GFlabeled foodRegionNortheastOverall rate of gluten detectionIn total, 32.2% of all foods in our study tested positive for gluten.The rate of gluten detection was essentially the same when werestricted this calculation to those 4,732 foods that were specifically labeled GF (32.0%).Bivariate analysis of factors associated with gluten detection inGF labeled foodsAfter determining the overall rate of gluten detection, wesearched for factors associated with detection of gluten in GFlabeled foods. Through bivariate analysis, we found that rates ofgluten detection did not differ significantly by region or medianhousehold income in the area around the restaurant. However,rates of gluten detection differed significantly by meal time, with27% of GF labeled foods at breakfast testing positive for gluten,30% at lunch, and 34% at dinner (P 5 0.0008) (Table 2). Moreover, among restaurant types, fast casual had significantly lowerrates of gluten detection (22%) when comparing this setting withall other foods tested (P 5 0.0063). GF labeled pizza and pasta hadthe highest rates of gluten detection compared with all othertested foods, 53% (P , 0.0001) and 51% (P , 0.0001),respectively.Multivariate analysis adjusting for region, median householdincome, and time of day revealed a decreased likelihood of glutendetection in the West as compared with the Northeast (OR 0.80,95% CI 0.67–0.95, P 5 0.01). There was also an increased likelihood of gluten detection at dinner as compared with breakfast(OR 1.46, 95% CI 1.18–1.81, P 5 0.0008) (Figure 1).Regarding restaurant types, GF labeled foods at casual (OR0.79, 95% CI 0.65–0.97, P 5 0.02) and fast-casual (OR 0.57, 95%CI 0.39–0.84, P 5 0.004) restaurants were less likely to test positive for gluten when comparing these settings with all other foodstested. Consistent with the bivariate analysis, pizza (OR 2.54, 95%CI 2.04–3.16, P , 0.0001) and pasta (OR 2.14, 95% CI 1.48–3.10,P , 0.0001) were more likely than other GF labeled foods to havegluten detected (Figure 1).DISCUSSIONIn this study of crowd-sourced data, approximately one-third ofrestaurant foods labeled GF tested positive for gluten. Rates ofgluten detection were highest during dinner hours and lowestduring breakfast hours. The West was the region within theUnited States with the lowest rate of gluten detection. Likewise,casual and fast-casual restaurants stood out for lower rates ofgluten detection. Pizza and pasta were the most likely to containgluten, with more than 50% of samples testing positive.Adherence to a GF diet is currently the only effective treatmentfor CD. Ingestion of as little as 50 mg of gluten per day can causemeasurable damage to the small intestinal mucosa of patientswith CD (14). As a result of the vigilance required to maintainThe American Journal of GASTROENTEROLOGY294/853 (34.5%)South382/1,188 (32.2%)Midwest0.0668205/595 (34.5%)West633/2096 (30.2%)Median household income quartileFirst (lowest)SecondThirdFourth (highest)95/343 (27.2%)157/503 (31.2%)0.2801297/914 (32.5%)942/2,877 (32.7%)Time of day/mealBreakfast138/508 (27.2%)Lunch358/1,213 (29.5%)Dinner977/2,873 (34.0%)0.0008Restaurant typeCasual158/552 (28.6%)0.0708Fast casual37/166 (22.3%)0.0063Quick service67/201 (33.3%)0.6767Food itemFrench friesMultivariate analysis of factors associated with gluten detectionin GF labeled foodsP valuePizza53/175 (30.3%)0.6213199/374 (53.2%),0.0001Salad78/261 (29.9%)0.4522Dessert59/195 (30.3%)0.5951Burger50/165 (30.3%)0.6353Soup35/125 (28.0%)0.3318Taco32/110 (29.1%)0.5088Pasta62/122 (50.8%),0.0001Vegetables22/94 (23.4%)0.0713Fish29/98 (29.6%)0.6063GF, gluten-free.aP values derived from x2 tests. In the case of restaurant type and food items,2 3 2 x2 tests were performed, comparing each restaurant/food item with allother tested foods not in that classification.a truly GF diet, the burden of treatment of CD is high. Patientswith CD rated their burden of treatment higher than patients withhypertension did, similar to patients with diabetes and end-stagerenal disease (15). Multiple studies cite exposure to gluten whiledining out as a leading source of anxiety for patients with CD(5,9,10). Our study results lend some credence to widespreadanecdotal reports offered by patients with symptoms suggestive ofgluten exposure after eating in restaurants, although recent workhas shown that symptoms are poorly predictive of mucosal injury (16).Beyond suggesting an overall high rate of gluten contamination at restaurants, we identified several specific associations withVOLUME 114 MAY 2019 www.amjgastro.comCopyright 2019 by The American College of Gastroenterology. Unauthorized reproduction of this article is prohibited.
795COLONGluten Detection in Restaurant FoodFigure 1. Multivariate analysis of factors associated with detection of gluten in GF labeled foods. ORs for region, median household income, and time ofd/meal were mutually adjusted. Analyses for the restaurant type and food items were run for each type/item vs all the other types/items combined andadjusted for region, median household income, and time of d/meal. Analysis of food items was limited to food items with .100 tests. GF, gluten-free; OR,odds ratio.higher or lower rates of gluten detection. For example, lower ratesof gluten contamination were found in the West. Although dataare sparse regarding regional differences in interest and knowledge about GF diets, higher rates of produce consumption andoverall healthy lifestyle have been reported in the West (17),suggesting that people living in the Western United States may bemore health-conscious and thus more knowledgeable about dietsperceived to be healthy. We previously found that the ratio ofnon-celiac gluten sensitivity to CD appears to be highest in theWestern United States (18). Given the rapid rise in glutenavoidance in recent years, outpacing the rise in CD diagnosis (19),regional differences in the rise of non-celiac gluten sensitivitymight yield greater awareness among both diners and restaurantstaff. Food workers may take better precautions to guard againstcross-contamination, and diners may make safer selections, suchas avoiding salad dressings that are at risk of contamination.Our finding of higher rates of gluten detection during dinnerhours may reflect cumulative contamination of GF ingredientsand/or equipment over the course of the day. It is not entirelyclear why pizza and pasta were more likely to test positive forgluten than other GF labeled foods. GF pizza may become contaminated by aerosolized wheat flour during various stages of 2019 by The American College of Gastroenterologyproduction. Sharing of ovens with gluten-containing pizza isa common concern, although a recent study suggests that it is notan inevitable setting for contamination (20). Although gluten isgenerally poorly soluble in water, it is possible that GF pasta maybecome contaminated by being cooked in the same water asconventional pasta. Alternatively, it is possible that the sauce onGF pizza or pasta is responsible for the detected gluten content.Although these are both basic precautions, knowledge deficitsamong food preparers are likely considerable; indeed, a 2010survey found that 23% of chefs had not heard of CD, and a significant minority incorrectly believed that peanut butter and winecontain gluten (9).Lower rates of gluten detection at casual and fast-casual restaurants were an unexpected finding. The survey of chefs referenced above found a direct relationship between average checkprice and chefs’ awareness of CD (9). One might therefore haveexpected more expensive restaurants to have lower rates of glutencontamination. Conversely, less expensive/chain restaurants mayhave more standardized training of their personnel regardinggluten contamination. Admittedly, our analysis of restaurantgenre was limited by the fact that only one-fifth of all tests camefrom chain restaurants that were categorizable. Despite thisThe American Journal of GASTROENTEROLOGYCopyright 2019 by The American College of Gastroenterology. Unauthorized reproduction of this article is prohibited.
COLON796Lerner et al.limitation, it is fair to conclude that less expensive restaurants andchain restaurants do not fair worse than their more expensive andindependent counterparts regarding gluten contamination.As alluded to above, the vigilance required to maintaina strictly GF diet can be the source of significant anxiety. In fact,anxiety is more common in patients with CD who have achievedmucosal healing on follow-up biopsy, which is a reflection of strictadherence (21). Similarly, patients with CD classified as “hypervigilant” in their efforts to avoid gluten have been found to reportlower quality of life than their less vigilant counterparts (22). So asto not cause undue alarm, it is therefore important to note thelimitations of these results.First, our study did not involve systematic testing of all GFrestaurant foods; it was a crowd-sourced study, and the foodstested could have been conceivably chosen specifically because ofdoubts regarding their GF status. Furthermore, Nima users maybe more inclined to share “gluten-found” than “gluten-free”results. Perhaps more importantly, our study relied on data froma portable gluten detection device that variably reports “glutenfound” at levels less than 20 ppm. Although a recent study fromthe makers of Nima reported a 7.8% false-positive rate, they defined false-positive as gluten being detected when the food actually contained less than 2 ppm gluten, although 20 ppm is thewidely recognized threshold for packaged GF foods (11). Similarly, a third-party evaluation of Nima found the device frequently detects gluten at levels of 5 and 10 ppm (12). This highlevel of sensitivity may protect patients with CD from potentiallyharmful gluten that may be present in greater quantity given thenonhomogenized sampling inherent in point-of-care restauranttesting, but this same feature may also overestimate the prevalence of contamination of foods with .20 ppm of gluten. Theaccuracy of our reported rates of gluten contamination is criticallydependent on the underlying distribution of gluten concentrations (i.e. the percentage of positive tests containing 10, 30, or300 ppm), data that are unknown in restaurant foods. However,even if we were to assume that only half of the reported positivetests contained .20 ppm, cutting our estimated rate of contamination from 32% to 16%, that would still be triple the ratequantified for packaged GF labeled foods (23). In addition, thedifferences we found between regions, time of day, and specificfoods are unlikely to be differentially affected by overestimationresulting from a hypersensitive sensor.It is also important to consider the clinical significance of ourfindings. In CD, intestinal damage is related to the quantity ofingested gluten, not its concentration within food. Therefore,eating a single food portion with .20 ppm gluten will not necessarily cause symptoms or villus atrophy. Rather, the 20-ppmthreshold is valuable because it keeps the intake of gluten belowpotentially toxic quantities (which vary between individuals butare commonly injurious at levels of 50 mg per day) (14).Despite the above caveats, this study provides much neededdata for patients with CD and the healthcare providers who treatand advise them. The crowd-sourced nature of these data provides an unprecedented view of restaurant testing of foodthroughout the United States. As such, this is the largest study todate on gluten contamination of restaurant foods. It capitalizeson a newly available technology and reveals that a significantpercentage of GF labeled restaurant foods contain detectablelevels of gluten. Our findings of increased gluten detection inpizza, pasta, and evening hours lend themselves to practicaladvice for patients with CD and also hint at possibleThe American Journal of GASTROENTEROLOGYmechanisms of contamination. Future studies should focus onquantifying the degree of gluten contamination in specific foodsand the development of interventions for reducing gluten contamination in restaurants.CONFLICTS OF INTERESTGuarantor of the article: Benjamin Lebwohl, MD, MS.Specific author contributions: B.A.L., P.H.R.G., and B.L.: planningand conducting the study. B.A.L., L.P.V., S.Y., A.G.R., P.H.R.G., andB.L.: collecting and/or interpreting the data. B.A.L.: drafting themanuscript. B.A.L., L.P.V., S.Y., A.G.R., P.H.R.G., and B.L.: criticallyreviewing and revising the manuscript.Financial support: The Nima device was developed with fundingfrom the National Institutes of Health (Small Business InnovationAward DK105770). The database used for sorting restaurants bygenre was produced with support from a grant from the NIA-NIH,1R01AG049970-01A1: Communities Designed to Support Cardiovascular Health for Older Adults (PI Gina Lovasi).Potential competing interests: B.L. serves as a consultant for Takedaand serves on the Advisory Board of Innovate Biopharmaceuticals.S.Y. is the Chief Executive Officer of Nima. B.L. and P.G. are bothunpaid members of Nima’s Scientific Advisory Board.Study HighlightsWHAT IS KNOWN3 Adherence to a GF diet is the mainstay of therapy for CD.3 Exposure to gluten while dining out is a major barrier to qualityof life for patients with CD.WHAT IS NEW HERE3 We used crowd-sourced data from users of a portable gluten333detection device to estimate rates of and identify risk factorsfor gluten contamination of supposed GF restaurant foods.Approximately one-third of restaurant foods labeled GFcontained detectable levels of gluten.Rates of gluten detection were highest during dinner hours.Pizza and pasta were the foods most likely to contain gluten,with more than 50% of samples testing positive.REFERENCES1. Rubio-Tapia A, Ludvigsson JF, Brantner TL, et al. The prevalence of celiacdisease in the United States. Am J Gastroenterol 2012;107(10):1538–44.2. Choung RS, Larson SA, Khaleghi S, et al. Prevalence and morbidity ofundiagnosed celiac disease from a community-based study.Gastroenterology 2017;152(4):830–9.e5.3. Rubio-Tapia A, Kyle RA, Kaplan EL, et al. Increased prevalence and mortalityin undiagnosed celiac disease. Gastroenterology 2009;137(1):88–93.4. Lebwohl B, Sanders DS, Green PHR. Coeliac disease. Lancet 2018;391(10115):70–81.5. Barratt SM, Leeds JS, Sanders DS. Quality of life in Coeliac Disease isdetermined by perceived degree of difficulty adhering to a gluten-free diet,not the level of dietary adherence ultimately achieved. J GastrointestinLiver Dis 2011;20(3):241–5.6. Abdulkarim AS, Burgart LJ, See J, et al. Etiology of nonresponsive celiacdisease: Results of a systematic approach. Am J Gastroenterol 2002;97(8):2016–21.VOLUME 114 MAY 2019 www.amjgastro.comCopyright 2019 by The American College of Gastroenterology. Unauthorized reproduction of this article is prohibited.
7. Hollon JR, Cureton PA, Martin ML, et al. Trace gluten contaminationmay play a role in mucosal and clinical recovery in a subgroup of dietadherent non-responsive celiac disease patients. BMC Gastroenterol2013;13:40.8. Syage JA, Kelly CP, Dickason MA, et al. Determination of glutenconsumption in celiac disease patients on a gluten-free diet. Am J ClinNutr 2018;107(2):201–7.9. Simpson S, Lebwohl B, Lewis SK, et al. Awareness of gluten-relateddisorders: A survey of the general public, chefs and patients. E Spen Eur E JClin Nutr 2011;6:e227–e31.10. Lee A, Newman JM. Celiac diet: Its impact on quality of life. J Am DietAssoc 2003;103(11):1533–5.11. Zhang J, Portela SB, Horrell JB, et al. An integrated, accurate, rapid, andeconomical handheld consumer gluten detector. Food Chem 2019;275:446–56.12. Taylor SL, Nordlee JA, Jayasena S, et al. Evaluation of a handheld glutendetection device. J Food Prot 2018;81(10):1723–8.13. Rundle A, Neckerman KM, Freeman L, et al. Neighborhood foodenvironment and walkability predict obesity in New York City. EnvironHealth Perspect 2009;117(3):442–7.14. Catassi C, Fabiani E, Iacono G, et al. A prospective, double-blind, placebocontrolled trial to establish a safe gluten threshold for patients with celiacdisease. Am J Clin Nutr 2007;85(1):160–6.15. Shah S, Akbari M, Vanga R, et al. Patient perception of treatment burdenis high in celiac disease compared with other common conditions. Am JGastroenterol 2014;109(9):1304–11. 2019 by The American College of Gastroenterology16. Mahadev S, Murray JA, Wu TT, et al. Factors associated with villusatrophy in symptomatic coeliac disease patients on a gluten-free diet.Aliment Pharmacol Ther 2017;45(8):1084–93.17. Troost JP, Rafferty AP, Luo Z, et al. Temporal and regional trends in theprevalence of healthy lifestyle characteristics: United States, 1994–2007.Am J Public Health 2012;102(7):1392–8.18. Zylberberg HM, Yates S, Borsoi C, et al. Regional and nationalvariations in reasons for gluten avoidance. J Clin Gastroenterol 2018;52(8):696–702.19. Kim HS, Patel KG, Orosz E, et al. Time trends in the prevalence of celiacdisease and gluten-free diet in the US population: Results from theNational Health and Nutrition Examination Surveys 2009-2014. JAMAIntern Med 2016;176(11):1716–7.20. Vincentini O, Izzo M, Maialetti F, et al. Risk of cross-contact for glutenfree pizzas in shared-production restaurants in relation to oven cookingprocedures. J Food Prot 2016;79(9):1642–6.21. Ludvigsson JF, Lebwohl B, Chen Q, et al. Anxiety after coeliac diseasediagnosis predicts mucosal healing: A population-based study. AlimentPharmacol Ther 2018;48(10):1091–8.22. Wolf RL, Lebwohl B, Lee AR, et al. Hypervigilance to a gluten-free dietand decreased quality of life in teenagers and adults with celiac disease.Dig Dis Sci 2018;63(6):1438–48.23. Thompson T, Simpson S. A comparison of gluten levels in labeled glutenfree and certified gluten-free foods sold in the United States. Eur J ClinNutr 2015;69(2):143–6.The American Journal of GASTROENTEROLOGYCopyright 2019 by The American College of Gastroenterology. Unauthorized reproduction of this article is prohibited.797COLONGluten Detection in Restaurant Food
Detection of Gluten in Gluten-Free Labeled Restaurant Food: Analysis of Crowd-Sourced Data Benjamin A. Lerner, MD1, Lynn T. Phan Vo, BA 2, Shireen Yates, MBA3, Andrew G. Rundle, DrPH , Peter H.R. Green, MD1 and Benjamin Lebwohl, MD, MS1,2 INTRODUCTION: Adherence to a gluten-free (GF) diet is the mainstay of therapy for celiac disease. Until now, those