Transcription
FY2021 Q3 - Key Performance IndicatorsProcurement Efficiency & Vendor Related InformationCompetitive Solicitations Procurement TypeAverage Number ofNumber of SBENumber of SDVNumber of MBENumber of WBESuppliers Responding Suppliers Responding Suppliers Responding Suppliers Responding Suppliers fessional Services (A&E)*Complete Requisition Received by Procurement to Intent to AwardTotalAverage Days*Non-Solicited Procurement TypeReceivedApprovedEmergencies99Cooperative Purchases00State/Federal Contracts55Sole Sources DPA00Sole Sources Exempt00Sole Sources 250K2019Sole Sources 250K43Percentage of Sole Source Requests ApprovedTransactional TypeTotalContractsContract AmendmentsCompleted Contracts Greater than 1 MillionActive Suppliers with Contracts Greater than 1Million52450 N/AN/AVirgin Paper Cost1624582 N/A 605,425483,3590.31%3 0Reams of Virgin Paper Transactional Efficiency & Vendor Related InformationAverage Days**Value127 201,174,838.0043 54,069,227.00374Delegated Purchasing Authority Purchase OrdersNumber of Purchase Orders** Intent to award to CompletionProfessional DevelopmentEmployees with CertificationsSpend per Employee on PD/TrainingProfessional Training Hours000001196%31Purchase Orders from Solicited ProcurementsOrganizational BudgetActual AmountPercentage of Spend Through CooperativePurchasingDenied8,02022,375.80 Reporting Metro Departments include:General Services, Library, and Planning(Fire and Health have reported previously, but not this quarter.)369,662.5779,298,927.80Cost Savings/AvoidanceNegotiated Cost Reductions Total Procurement Spend Training & Professional DevelopmentTrainingiProcurement Requisition Entry TrainingiSupplier TrainingiProcurement Buyer TrainingiProcurement Approver TrainingProcurement Office TrainingBAO Outreach Events/TrainingPaper ConsumptionReams of RecycledPaperRecycled Paper Cost -228,488,810Number of Attendees100720421,4504,393.50Hours Completed4.501.5103.0
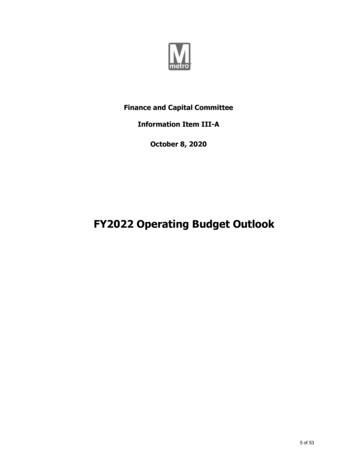
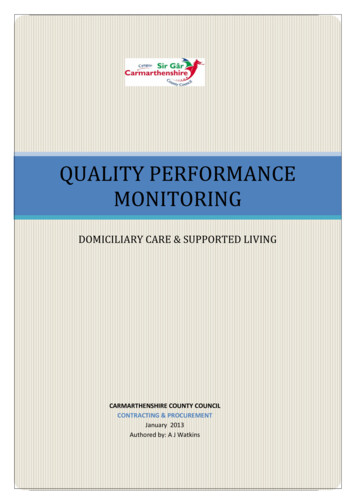
FY21 Q3 PROCUREMENT ACTIVITY4%3%24%18%AmendmentEmergencyITBRFPSole Source 250K9%13%RFQ – A&ESole Source 250K29%
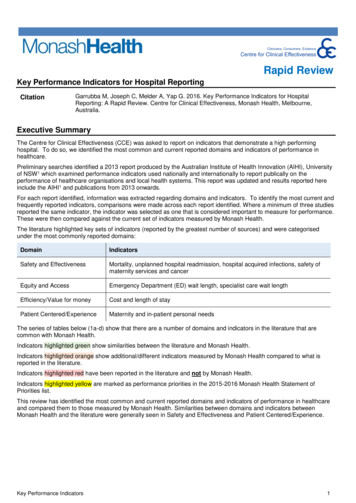
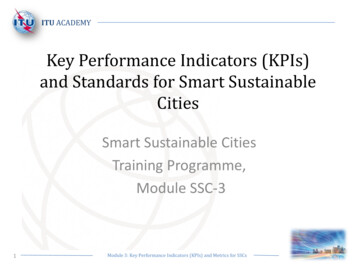
FY21 Q3 Procurement Activity by ole Source 250KSole Source 250K44444332210JanuaryFebruaryMarch
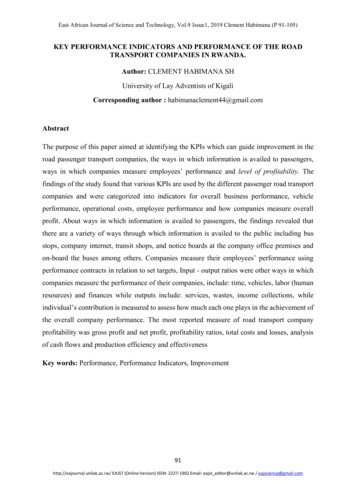
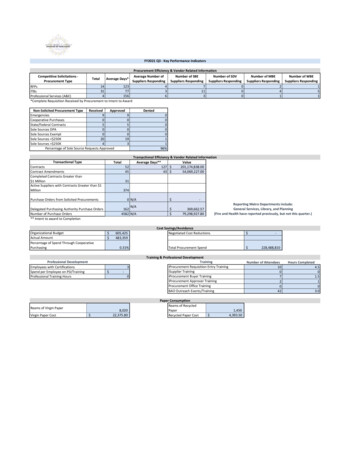
FY21 Q3 Procurement Activity by Department351212302552058315101150Letter of Acceptance – Escalation321111111238128111Letter of Acceptance – Additional LinesAssignment Consent12111111131111151RFQ – A&E53Sole Source 250K3112122Sole Source 250KSole Brand4RFPITBEmergencyAmendment
FY21 Q3 TRANSACTIONAL ACTIVITY10%Amendment Amendment46%27%ITB ContractRFP ContractRFQ – A&E Contract17%
FY21 Q3 Transactional Activity by Month201818161514141312AmendmentITB10887RFP7RFQ – A&E654442210JanuaryFebruaryMarch
0Amendment1ITBRFP11RFQ – A&EPlanning Commission2Water Services1Public Works6Parks and Recreation1Juvenile Court1Sports Authority9Water Services2Public WorksInformation Technology Services1Human Resources3Health4General Services3Fire1Finance1The Fairgrounds Nashville4Water Services1SheriffPublic Works1Information Technology Services1Health3General ServicesFire1Juvenile Court Clerk1Sports Authority2Social ServicesWater ServicesSheriffPublic Works1Police11Parks and RecreationOffice of Emergency Management2Information Technology ServicesHuman ResourcesHealth4General ServicesFinance10FY21 Q3 Transactional Activity by Department9898765654433221ContractAmendment
FY2021 ‐ Key Performance Indicators (KPI) Data for ProcurementDEPARTMENTS SERVEDFY21TOTALSKPI DETAILS1st Quarter2nd Quarter3rd Quarter4th QuarterArts CommissionAssessor of PropertyCodes AdministrationFinance*FireGeneral ServicesGeneral Sessions CourtHealthHuman ResourcesInformation Technology ServicesInternal AuditJuvenile CourtJuvenile Court ClerkLegal DepartmentMetro Action CommissionMunicipal AuditoriumMetro CouncilOffice of Emergency ManagementParks and RecreationPlanning CommissionPolicePublic LibraryPublic WorksPublic Works/Transportation Licensing CommissioPublic Works/Water ServicesSheriffSocial ServicesSports AuthorityThe Fairgrounds NashvilleTrusteeWater ServicesMetro WideRFPITBA&E121814251031404Sole Source 250K1310194466842ProcurementsSole SourceSole Brand ive22189520PurchaseOrders6004976 PO AmountsContractsContract AmountsAmendmentsAmendments Amount 1,048,123.00 0.00 0.00203352 62,409,000.00 293,095,496.57 201,174,838.00282045 44,902,846.00 6,861,536.00 54,069,227.001,048,123.00105 556,679,334.57193 105,833,609.002 70,000.00 0011429162171431412111122171243 474,793.005817 6,635,000.0047,183,310.0049,215,000.00725 2,202,738.574,845,000.0045,000,000.004318212221 28,000,000.001 182 500,000.0030,985,978.00546,997.00132 ‐3,700,000.0015,028.002 353,400.0016 47,200,000.003311 22,778,196.003,076,000.00399,400.0014,108.0014193 3110115131021131413231446610425 484,950.001 88,380.0017 84,957,425.0021 3,807,244.00750,000.00111 19,081,373.00743,844.0013627 232,225,425.001649105 556,679,334.5712116212621112176 1,048,123.00
Metropolitan Government of Nashville & Davidson CountyBusiness Utilization Quarterly Report HighlightsFY21 – 3rd Quarter (January – March 2021)Important points to note about Metro’s Prime and Subcontractor businessutilization for the third quarter of Fiscal Year 2021, BAO KPI Report Data:1. The Metro Government spent: 6,372,764 with MBE prime contractors 6,639,722 with WBE prime contractors 5,290,908 with MBE subcontractors 12,856,028 with WBE subcontractors 31,159,422 TOTAL WITH MWBESWhich represents 13.64% of the total ofall procurement transaction values.2. The Metro Government spent:52,596,955 with SBE prime contractors11,287,782 with SBE subcontractors63,884,737 TOTAL WITH SBESWhich represents 29.96% of the total ofall procurement transaction values.Business Utilization ( )FY21 3RD ,000MBEsWBEsSBEsDBEs(MWBEs SBEs)prime6,372,7646,639,722 52,596,95565,609,441sub5,290,90812,856,028 4,73795,044,159Business Utilization (%)FY21 3RD QTR3. The Metro Government achieved *DBEutilization of 41.60% at the prime andsubcontract 0.00PercentageMBEsWBEsSBEsDBEs(MWBEs SBEs)5.108.5327.9641.60*DBE is defined as businesses having small, minority or woman ownership.
Metropolitan Government of Nashville & Davidson CountyEBO and Outreach UpdateFY21 – 3rd Quarter (January - March 2021)Important points to note about the EBO Program which launched on July 5, 2019:1. Metro Government awarded 28 contracts with race and gender conscious goals.2. 16.7 million is the total estimated spend with minority or woman owned businesses.a. 7.8 million is the total estimated spend with minority owned businesses.b. 8.9 million is the total estimated spend with woman owned businesses.3. 14% is the combined goal for minority or woman owned business participation.a. 5% is the average proposed goal for minority owned business participation.b. 9% is the average proposed goal for woman owned business participation.4. 1 project had an MBE prime, 3 projects had WBE primes, and 1 project had an SBE prime.5. There have been several department trainings to build familiarity and support for the EBO Program.To date, 75 Metro personnel have participated in training sessions to learn how MBE and WBE goalsare established, and how they can help to ensure expediency in the procurement process.6. Certified MBEs and WBEs that were paid on EBO Projects during Q3:a. Aerial Innovations of Tennessee, Inc.g. Homeland LLC (WBE)(WBE)h. HQ Direct, LLC (WBE)b. BAC Paving Co Inc (WBE)i. J R Construction Tennessee Inc (MBE)c. Civic Engineering and Informationj. K.S. Ware & Associates, LLC (WBE)Technologies (WBE)k. Liberty Waste LLC (MBE)d. Cobra, LLC (WBE)l. Raven Security and Traffic Control, LLCe. Crown Paving, LLC (WBE)(WBE)f. EverReady Transportation (MBE)
Fiscal Year 2021 Disadvantaged Business Quarterly ReportFY21 Q3 (January 1, 2021 - March 31, -SpecificMinorityNon-EthnicFemaleTotal EthnicMinority Male ORWoman Owned3.79% 5,994,541 4,345,504 5,684,017 2,877,606 539,494 192,852 2,346,734 17,635,244 Ethnic Minority Male OwnedMetro General Government**Metro General Government (Subs)Metropolitan Nashville Public SchoolsNashville Electric ServiceMetro Development and Housing AgencyWeGo Public Transit/Metro Transit AuthorityMetro Nashville Airport AuthorityTotals 5,115,921 3,750,099 5,665,169 362,666 420,723 90,707 1,564,800 13,219,986 6,055 150,24535,93218,14955,95781140,735113,306379,203 75,730- - Woman OwnedMetro General Government**Metro General Government (Subs)Metropolitan Nashville Public SchoolsNashville Electric ServiceMetro Development and Housing AgencyWeGo Public Transit/Metro Transit AuthorityMetro Nashville Airport AuthorityTotals 269,417 935,640 10,100 518,400 58,255 308,301 1,164,473 106,4592,790168,558275,017 2,3476,97419,66950,90772,923 - - 6,639,722 12,856,028 1,518,553 1,587,127 1,615,447 112,667 4,095,973 15,569,489 2112,6674,572,8323,280,471Total Spend 14,384,459 4,311,072 452,126 - 15,569,489 5,290,908 20,915,7156,372,764N/AN/AN/AN/AN/AN/AN/A-NOTE:* OS&E (Other Socially and Economically Disadvantaged Business) includes disabled, veteran, and LGBT owned businesses not owned by minorities or women.**Metro GG (Subs) not included in total spend amounts.Percent of All BusinessesPercent of All BusinessesOS&EMBEWBE (White Female Owned Business)Small BusinessAll Other Businesses (Large , 3.79%OS&E, 0.03%WBE (White FemaleOwned Business), 3.08%Small Business, 12.03%OS&EPercent of Disadvantaged BusinessesAfrican American MaleHispanic American MaleAsian American MaleNative American MaleNon-specific Minority MaleAfrican American FemaleAsian American FemaleHispanic American FemaleNative American FemaleNon-specific Minority FemaleCaucasian/Non-Ethnic FemaleOS&E 0.21%0.00%0.00%44.68%0.38%100.0%WBE (White FemaleOwned Business)Small BusinessAll Other Businesses(Large Business)All Other Businesses(Large Business), 81.07%TotalDisadvantagedBusiness 2915.32%5.22%10.26%131,9056.90%OS&E*0.03%- 131,905TotalDisadvantagedBusiness 38.22% 13,015,662 18,249,644 7,232,339 5,034,040 2,341,925 305,519 6,919,566 34,849,051Small Business23.02% 52,596,955 11,287,782 1,816,754 1,607,442 881,190 2,017,930 1,883,370 60,803,6419.41% 12.03% 6.90%Large Business 34,849,051- 193,529,33158,612,584409,719,633Total Business ,287,6345,852,78067,415,520505,372,325 100.0%-81.07% 409,719,633 505,372,325
Fiscal Year 2021 Disadvantaged Business Quarterly ReportFY21 Q3 (January 1, 2021 - March 31, 2021)Total Spend6.90%ComparisonAgencyMetro General Government*Metro General Government (Subs)Metropolitan Nashville Public SchoolsNashville Electric ServiceMetro Development and Housing AgencyWeGo Public Transit/Metro Transit AuthorityMetro Nashville Airport AuthorityTotalQ2 21TotalDisadvantagedBusiness 13,015,662 18,249,644 7,232,339 5,034,040 2,341,925 305,519 6,919,566 345,852,78067,415,520TotalDisadvantagedBusiness %6.81%50.72%0.49%8.26%9.41%13.03%16.37% 505,372,32510.22%34,849,051Total BusinessFY20TotalDisadvantagedBusiness 10,938,342 21,496,840 3,275 4,318,147 949,114 787,143 17,231,803 042,994105,288,131 334,978,11934,227,824Total Business#DIV/0!Q2 mparative Analysis70.00%5.70%60.00%50.00%PercentMetro General Government*Metro General Government (Subs)Metropolitan Nashville Public SchoolsNashville Electric ServiceMetro Development and Housing AgencyWeGo Public Transit/Metro Transit AuthorityMetro Nashville Airport AuthorityTotalDisadvantagedBusiness 0%020.00%NOTE:* To capture only direct spend to Primes, Metro Subs amounts are not included in the Total.10.00%0.00%Q2 FY21Q2 FY20Metro GeneralGovernment*Metro GeneralGovernment(Subs)MetropolitanNashville PublicSchoolsNashvilleElectric MetroDevelopmentand HousingAgency15.32%9.41%WeGo o 22%
Public Works/Transportation Licensing Commissio 1 Trustee 1 KPI DETAILS FY2021 ‐ Key Performance Indicators (KPI) Data for Procurement Procurements Transactions DEPARTMENTS SERVED FY21 TOTALS. Metropolitan Government of Nashville & Davidson County .