Transcription
The Journal of Neuroscience, March 1, 2002, 22(5):1994–2004Attentional Modulation of Behavioral Performance and NeuronalResponses in Middle Temporal and Ventral Intraparietal Areas ofMacaque MonkeyErik P. Cook and John H. R. MaunsellHoward Hughes Medical Institute and Division of Neuroscience, Baylor College of Medicine, Houston, Texas 77030Although many studies have demonstrated that neuronal responses are modulated by attention, the significance of thismodulation for behavior is poorly understood. We recordedfrom neurons in the middle temporal (MT) and ventral intraparietal (VIP) areas in the visual cortex of two macaque monkeyswhile they performed a motion detection task under two conditions of spatial attention. The ability of the animals to detectthe motion was reduced when they withdrew attention from thestimulus. Withdrawing attention also reduced neuronal responses to the motion in both the MT and VIP areas. Tocompare the neuronal and behavioral effects of attention, theamount of attentional modulation was expressed in units ofstimulus strength. On average, attention modulated neuronalresponses in MT less than needed to account for the attentionaleffect on behavior. The opposite was observed in VIP, where theaverage effect of attention on neuronal responses was greaterthan that needed to account for behavior. Similar results wereobtained when the effects of attention on neuronal responseand behavioral performance were compared using a parametricfunction of stimulus strength. Across neurons in both areas,attentional modulation of neuronal responses was more variable than, and uncorrelated with, attentional modulation ofbehavioral performance. These findings suggest that attentioncan alter the average relationship between neuronal activity invisual cortex and behavioral performance. Where this relationship is preserved may indicate which cortical regions are mostclosely associated with the behavior in a given task.Directing attention to a specific region in space improves stimulusdetection at that region relative to others (Eriksen and Hoffman,1972; Posner, 1980; Downing, 1988). Spatial attention also affectsthe responses of neurons in visual cortex (Bushnell et al., 1981;Motter, 1993; Desimone and Duncan, 1995; Luck et al., 1997).How the behavioral and neuronal effects of attention are relatedis poorly understood and was the focus of our experiments.One possibility is that the effect of attention on the responses ofvisual cortical neurons can fully account for its effect on behavioral performance. This hypothesis arises from several observations. First, the neuronal modulation that occurs when attentionis directed to a stimulus (Spitzer et al., 1988) or when effort isincreased (Spitzer and Richmond, 1991) is typically an enhancement, which is consistent with behavioral improvements. Second,a rough correspondence exists between behavioral performanceand the ability of individual neurons to discriminate among ordetect stimuli (Parker and Hawken, 1985; Barlow et al., 1987;Britten et al., 1992; Geisler and Albrecht, 1997; Prince et al.,2000). Because these studies are likely to have spanned a range ofattentional states, it is possible that the relationship betweenneuronal activity and behavioral performance persists acrossdifferent attentional conditions. Third, the correspondence be-tween neuronal activity and behavioral performance persists during improvements in performance that occur with practice (Zohary et al., 1994).If attention alters behavior without affecting the link betweenneuronal activity and behavioral performance, then attentionmust act in a manner similar to varying stimulus strength. That is,behavioral performance should follow changes in neuronal responses, whether those changes arise from stimulus differences orchanges in behavioral state. This idea is supported by recentstudies which show that attention alters neuronal responses in amultiplicative manner without changing stimulus selectivity (McAdams and Maunsell, 1999; Treue and Martinez Trujillo, 1999).Multiplicative scaling is similar to the way changes in stimulusstrength affect neuronal responses (Tolhurst, 1973; Sclar andFreeman, 1982). Directing attention to a stimulus may thereforehave the effect of multiplicatively enhancing specific representations in sensory cortex, thereby improving detection.We wanted to know whether the attentional enhancement ofneuronal activity and behavioral performance is equivalent to theenhancement expected from increasing stimulus strength. Werethis the case, it would support the idea that the effect of attentionon neuronal responses in sensory cortex accounts for the attentional modulation of behavioral performance. We designed anexperiment in which we could simultaneously measure behavioralperformance and responses of individual neurons while spatialattention and stimulus strength were varied. We used a motiondetection task and recorded in the middle temporal (MT) andventral intraparietal (VIP) areas, two regions of the visual cortexinvolved in motion processing. We found that the average effectof attention on neuronal responses in MT was usually less thanneeded to account for changes in behavioral performance. InReceived June 29, 2001; revised Dec. 18, 2001; accepted Dec. 18, 2001.This work was supported by National Institutes of Health Grant R01 EY05911.J.H.R.M. is an Investigator with the Howard Hughes Medical Institute. We thank J.Assad, C. Boudreau, J. DiCarlo, G. Ghose, and T. Yang for helpful discussion on allaspects of this project. We also thank D. Murray and T. Williford for technicalassistance.Correspondence should be addressed to Erik P. Cook, Division of Neuroscience,S-603, Baylor College of Medicine, One Baylor Plaza, Houston, TX 77030. E-mail:erik@sensor.neusc.bcm.tmc.edu.Copyright 2002 Society for Neuroscience 0270-6474/02/221994-11 15.00/0Key words: attention; macaque monkey; MT; VIP; vision;motion
Cook and Maunsell Attentional Modulation in Monkey Parietal Cortexcontrast, the average effect of attention on the VIP area responses was much greater than that needed to account forchanges in behavioral performance.MATERIALS AND METHODSBehavioral task s. Data were collected from two male rhesus monkeys(Macaca mulatta) while they performed a spatially cued motion detectiontask (see Fig. 1 A). Each monkey sat in a primate chair during trainingand recording sessions, which lasted 2–5 hr. While the animal pressed alever and fixated on a central point, two patches of dynamic random dotswere presented on opposite sides of the fixation point. Both patchesstarted with no net motion (0% coherent), and the animal’s task was torelease the lever within 750 msec after either patch began moving in acoherent manner. Coherent motion started at a random time between500 and 8000 msec. Having at least 500 msec of 0% random motionbefore the coherent motion occurred minimized any effect the static cuemay have had on neuronal responses. The coherent motion onset wasexponentially distributed with a mean of 1300 msec. However, for thefirst 21 MT cells recorded in monkey 1, the coherent motion times wereuniformly distributed, which resulted in a slight increase (4%) in thenumber of correct responses for coherent motion occurring toward theend of trials.The diameter and location of one patch of dots was adjusted to fill thereceptive field (RF) of the neuron under study, and the coherent motionin either patch was in the preferred direction and speed of the neuron.The coherent motion was present until the monkey released the lever orthe end of the 750 msec reaction time window was reached. The strengthof the coherent motion signal varied randomly from trial to trial amongpreset values to produce a range of behavioral performances.Spatial attention was controlled by presenting a cue of static dots inone patch at the beginning of each trial. This cue indicated which patchwould contain the coherent motion signal. A key element of this task wasthat the cue was valid 80% of the time (valid trials). In 20% of the trials,the coherent motion signal occurred in the uncued patch (invalid trials).The idea was that the animal would devote most of its attention to thecued patch of dots, because this patch was most likely to contain thecoherent motion signal. This paradigm of valid /invalid cueing has beenused successf ully to measure the behavioral effects of spatial attention inhumans (Posner, 1980).The monkey received a reward for releasing the lever between 200 and750 msec after the start of the coherent motion signal (correct trial).Failure to release the lever or late releases was not rewarded (missedtrial). Both correct and missed trials were scored as completed trials.Trials in which the monkey released the lever early either during the 0%coherent motion or 200 msec into the coherent motion (false alarm) ordid not maintain fixation within 1 of the fixation point (fixation break)were not counted as complete or analyzed.E xperiments were run in a block mode in which the cue was presentedat the same location for 15 completed trials (either correct or missed).Valid and invalid cues were balanced between the two patch locations.Thus, for each block the monkey had 12 valid trials in which the coherentmotion occurred in the cued patch and 3 invalid trials in which thecoherent motion occurred in the uncued patch. Trials in which the cueand the coherent motion were both in the RF of the neuron will bereferred to as “attend in” because the monkey was directing its attentiontoward the RF. Trials in which the cue was outside the RF and thecoherent motion occurred inside the RF will be referred to as “attendout” because the monkey’s attention was directed away from the RF.Only trials in which the coherent motion occurred in the patch centeredon the RF were used in this analysis.Behavioral performance was measured as the proportion of correcttrials. Four levels of motion coherence were usually measured, includingthree levels of motion coherence (low, medium, and high) and 0% (catchtrials). The values of non-zero motion coherence were adjusted for eachstimulus configuration to produce a range of behavioral performances forthe animal. The average behavioral performance was 50, 92, and 99%correct for low, medium (validly cued), and high coherence trials. Noreward was given during the 0% catch trials.The monkeys were also trained to perform a standard memory delayedsaccade task (White and Sparks, 1986). In this task, the monkey fixatedon a central point while a peripheral target (0.25 diameter) appeared for500 msec. To get a reward, the monkey had to remember the targetlocation for 500 –2500 msec and then, after the central fixation point wasextinguished, saccade to within 2.5 of its location within 300 msec.Neuronal responses were analyzed only from correctly completed trials.J. Neurosci., March 1, 2002, 22(5):1994–2004 1995Random dot stimulus. The animals sat 62 cm from a computer monitor( 17 13 of visual angle, 1600 1200 pixels, 75 Hz refresh). Thestimuli consisted of two patches of white dots (each 0.25 diameter, 78cd /m 2) on a dark gray background (12 cd /m 2) with a dot density of 2.1dots/degree 2. Each patch of dots was updated every other frame (37.5Hz) using the following procedure. The dots were evenly divided intotwo groups. On each update, one group was replaced with new, randomlypositioned dots, while dots in the other group were displaced by a fixeddistance. The dots in this latter group determined the motion coherence.For 0% coherence, all of the dots in this group moved a fixed distance ina random direction. For coherent motion greater than zero, a proportionof the dots moved with a fixed distance in the same direction. Thisproportion determined the strength of the coherent motion. On the nextupdate, the groups were switched. This arrangement ensured that all thedots had a lifetime of two updates (26.6 msec) before they were replacedand that there would be no changes in the apparent dot density associatedwith the onset of coherent motion. Because half of the dots are alwaysrandomly replotted regardless of the proportion of dots moving coherently, our motion had a maximum strength of 50% coherence. Forexample, at 25% coherent motion, half of the dots are randomly replotted, one-fourth are moving with the same fixed distance and direction,and one-fourth are moving with the same fixed distance in a randomdirection.Neuronal recording and data collection. Using standard extracellularrecording techniques (Gibson and Maunsell, 1997), we recorded fromsingle neurons in MT and V I P areas in both animals. When a neuron wasisolated, the receptive field was mapped using a manually controlled barwhile the animal fixated on a central spot. The diameter of the receptivefields ranged from 3.9 to 10.7 (median 7.4 ) for the MT area and 5 to10.6 (median 8.2 ) for the V I P area. Receptive field center eccentricitiesranged from 3.9 to 11.1 (median 7.9 ) for the MT area and 3.9 to 11.0 (median 8.1 ) for the V I P area. The preferred speed was also judgedusing a bar moved by hand. The directional tuning of the neuron wasdetermined using the motion detection task described above with 50%coherent motion presented in eight directions. For most cells, once thereceptive field location, size, preferred direction, and speed were determined, the memory saccade task was run with the targets at the centersof where the random dot patches would be located. Five to 30 (median12) correctly completed trials were collected for this task. The motiondetection task was then run, and we recorded from the neuron as long aspossible. The number of completed trials per coherence level for themotion detection task ranged from 15 to 175 (median 35). The monkey’sperformance varied with patch location, size, and motion speed, whichwere determined by the response properties of the neuron under study.Consequently, different neurons were tested with different coherencelevels. The animal’s eye position was measured every 5 msec using ascleral search coil (Robinson, 1963; Judge et al., 1980), and the occurrence of action potentials was recorded to the nearest millisecond.Anal ysis. Standard statistical methods were used for most analyses.The exception was the analysis in Figure 5, in which a bootstrap procedure (Efron and Tibshirani, 1993) was used to determine whether theneuronal and behavioral effects of attention observed in a single neuronwere significantly different. The bootstrap procedure has the advantageof requiring no assumptions regarding the distribution of the null hypothesis. For this analysis, trials from each neuron were randomlyresampled with replacement to form new bootstrap samples. This wasrepeated to produce 1000 total bootstrap samples in which each bootstrap sample had the same number of trials as the original data set. Foreach bootstrap sample, sigmoidal and linear fits were performed as af unction of motion strength on the behavioral and neuronal data, respectively. The difference between the neuronal and behavioral effects ofattention was computed from these fits, forming a distribution of differences. If the 95% confidence interval of this distribution of attentionaldifferences contained zero, then it was concluded that there was nodifference between the neuronal and behavioral effects of attention (seeFig. 5, open symbols). Otherwise, it was concluded that attention had asignificantly different effect on the behavior and neuronal response ( p 0.05) (see Fig. 5, filled symbols). For the marginal distributions in Figure5, the effects of attention on the neuronal response and behavioralperformance were assessed separately using the same bootstrap procedure. However, in this case, distributions were computed separately forneuronal and behavioral data and tested if the 95% confidence intervalfor the mean contained zero.Sigmoidal curves were fit to behavioral performance using a nonlinearfitting f unction in M ATL AB (The Mathworks). Because we fit four data
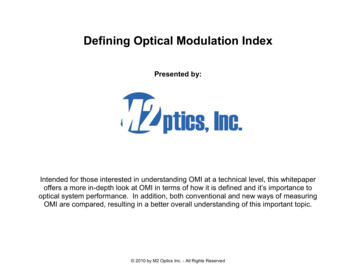
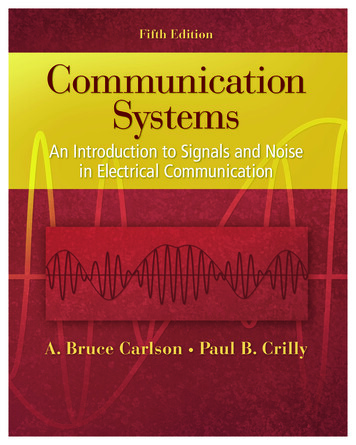
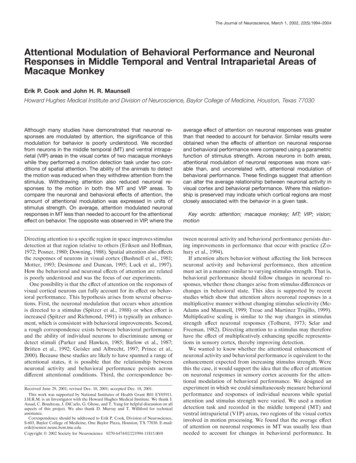
1996 J. Neurosci., March 1, 2002, 22(5):1994–2004points with sigmoids containing two free parameters, the fits wherepredictably very good. For all experiments, the minimum correlationcoefficient between the measured behavior and fitted sigmoid was 0.97(median 0.99). The use of a sigmoid to describe behavioral performanceas a f unction of motion coherence was based on days when we measuredthe animal’s behavioral performance with more than four levels ofcoherent motion (data not shown). Neuronal responses as a f unctionmotion coherence were described using a linear f unction. We chose thisbecause it has been shown that MT responses increase linearly withmotion coherence (Britten et al., 1993). Linear fits of neuronal responses were evaluated using standard regression analysis (F test forslope 0; p 0.05).Histolog y. A vertical approach was used with recording chambersimplanted dorsal to the superior temporal and intraparietal sulci. Ahistological reconstruction of recording sites was made only for monkey1 (monkey 2 is to be used in f urther experiments). For monkey 1,electrolytic lesions (10 A for 10 sec) were made at a few recording sitesin the MT and V I P areas a few days before the end of recording. Theextent of the MT area was mapped using myelin-stained sections (VanEssen et al., 1981). Of 56 neurons recorded in the superior temporalsulcus in monkey 1, 9 were not unequivocally within the MT area andwere excluded from analysis. Sections of the intraparietal cortex revealedthat we recorded from neurons located in the ventral portion of thelateral bank. Recordings from the lateral bank of the intraparietal sulcuswere within 3 mm of the f undus, which has been identified as V I P (Colbyet al., 1993). The Horsely-C lark coordinates of the MT area recordingsranged from 4 to 7 mm posterior and 15 to 18 mm lateral. The V I Pcoordinates ranged from 1 mm posterior to 2 mm anterior and from 10to 14 mm lateral.RESULTSWe recorded from 93 MT cells and 104 VIP cells in two monkeysperforming a motion detection task. Of these, 11 MT and 15 VIPneurons were excluded from the analysis on the basis of their lackof responsiveness to the coherent motion (see below).Directional selectivity in MT and VIPThe MT area projects to several parts of the parietal cortexincluding the VIP area (Maunsell and Van Essen, 1983), which isa later stage of processing in the parietal stream (Ungerleider andMishkin, 1982). Both areas contain many neurons that arestrongly directionally selective (Van Essen et al., 1981; Colby etal., 1993). The directional selectivity of the neurons that werecorded is shown in Figure 2, A and B. Data from the twomonkeys were combined because directional selectivity was similar for both animals. The average directional tuning curve in theleft panels was based on responses to 50% motion coherencepresented using the motion detection task. Directional selectivitywas measured only while the animals were attending to thestimulus in the RF of the neuron.Individual tuning curves were rotated to bring the preferreddirection of each neuron to the top, and responses to differentdirections were then averaged. The mean firing rates for the 0%and 50% coherent motion were computed using two 300 msecperiods just before and after the onset of the coherent motion(Fig. 1 B). We chose these intervals on the basis of the monkeys’reaction times, which were 300 msec 99% of the time. Thespontaneous firing rate was computed using the 250 msec periodjust before the 0% coherent motion began.MT neurons were more directionally selective than VIP neurons, and most were inhibited relative to the 0% coherent response by motion in the null direction. The right panels in Figure2 show the distributions of directional selectivity expressed as adirectionality index (DI). This index is the normalized vector sumof the firing rates for different directions. DI was calculated byfirst normalizing the average firing rates for each motion direction by the sum of all the average firing rates, referred to as Nd,Cook and Maunsell Attentional Modulation in Monkey Parietal CortexFigure 1. A, The motion detection task. Each trial began with thepresentation of the fixation point and static cue indicating which patch ofdots would most likely contain the coherent motion. After fixation andpressing a lever, both patches of dots began moving randomly with 0%coherent motion. At a random time, one patch began moving coherently,and the animal had a reaction time window of 200 –750 msec to release thelever to obtain a reward. The strength of the coherent motion was variedfrom trial to trial to produce a range of behavioral performances. Illustrated here is an example of a validly cued trial in which the coherentmotion occurred in the cued location. In 20% of trials, the cue was invalidand the coherent motion occurred in the uncued location. All cueing wasbalanced between the two locations. B, Schematic of neuronal responsesduring the motion detection task. Neuronal responses were quantifiedusing the absolute response to the 0% coherent motion ( a), the absoluteresponse to the coherent motion ( b), and the driven response ( c), whichwas the difference between the response to the coherent and 0% motion.where d represents one of eight directions. If all Nd are summedas vectors, with each vector pointing in the direction of motion,the result is a vector with a magnitude that is DI. For a cell thathas no directional tuning, in which all directions of motion produced the same response, DI 0. For a cell that only respondedto motion in the preferred direction, DI 1. The mean DI (Fig.2, dashed lines) for MT neurons was slightly greater than that forVIP neurons, but both areas contained a large proportion of cellsthat could contribute to motion detection.Attentional modulation in MT and VIPFigure 3 shows the responses of a typical MT neuron recordedwhile the monkey performed the motion detection task. Theproportion of trials in which the monkey released the lever inresponse to the coherent motion signal is shown in Figure 3A forthe two attentional states. The filled points in Figure 3A correspond to trials in which the monkey directed his attention to thepatch of dots in the RF (Attend in). When the strength of themotion signal was strong (30%), the monkey correctly detectedthe coherent motion on almost every trial. As the strength of thecoherent motion was reduced, the monkey’s ability to detect themotion signal decreased. At 0% coherent motion there was nosignal, and a behavioral performance greater than zero indicatesa false alarm or guessing rate by the animal. For both animals the
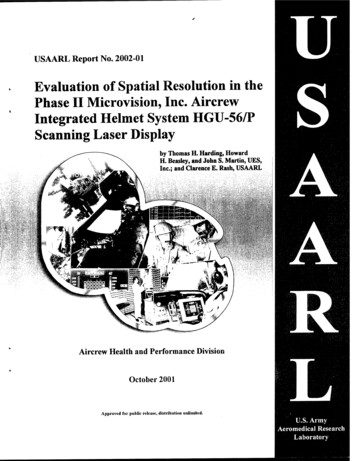
Cook and Maunsell Attentional Modulation in Monkey Parietal CortexFigure 2. Directional selectivity of MT and VIP neurons. A, On the leftis a directional tuning plot of the average response of MT neurons to 50%coherent motion in eight different directions. Responses from each neuron were aligned with the preferred direction pointing up. The solid circleis the spontaneous rate in response to the static cue. The dashed circle isthe average response to the 0% coherent motion that preceded the 50%coherent motion. Error bars indicate SEM. To the right is the distributionof the directionality index (DI), which is the normalized vector sum of theresponse for each direction (see Results). The dashed line is the mean ofthe distribution. B, Directional tuning and DI for VIP area.false alarm rate averaged 5%, indicating that they used a conservative criterion for detecting coherent motion.To assess the behavioral effect of attention, we measured thebehavioral performance on trials when the animal was attendingto the patch of dots outside the RF (Fig. 3A, Attend out). In thesetrials, the cue was presented outside the RF of the neuron,whereas the coherent motion occurred in the RF. Thus, thesetrials had invalid cues. Only the medium strength coherent motion was presented during invalidly cued trials (which for this cellwas 22.5%). The effect of withdrawing attention on behavioralperformance is shown in Figure 3A (open square) by the poorerperformance when the monkey directed its attention away fromthe patch of dots containing the coherent motion.We did not sample invalidly cued trials at other motion coherence levels because of the limited time available for electrophysiological recordings of single neurons. Because the invalid cuesoccurred on only 20% of the trials, adding another invalid cueinglevel would double the number of trials required for a completedata set. We measured behavioral performance using invalid cueswith several motion coherence levels on days when we did notrecord neuronal data. The resulting psychophysical curves for thedetection of the motion when the animal was not attending wasalways consistent with a rightward shifted version of the performance curve for when the animal was attending (data not shown).To compare the behavioral and neuronal effects of attention,we expressed both in units of stimulus strength (percentage motion coherence). A sigmoid was fit to the behavioral performancein Figure 3A (see Materials and Methods). Using the sigmoidalfit, the effect of withdrawing attention in units of motion coherence is shown by the dotted lines. For the invalid cueing conditionJ. Neurosci., March 1, 2002, 22(5):1994–2004 1997Figure 3. A representative MT cell. A, Behavioral performance as afunction of motion coherence in the attended ( filled circles) and unattended conditions (open square). Only trials in which the coherent motionoccurred in the RF of the neuron were included. The unattended trialsonly contained the 22.5% coherent motion. The solid curve is the fitsigmoidal function to the attended performance. The dotted lines andarrow indicate the equivalent motion coherence (13.5%) in the attendedcondition that produces the same behavioral performance as the unattended condition. B, The time course of the response of the MT neuronto the three levels of coherent motion above 0%. Responses are aligned tothe onset of the coherent motion (vertical line), and the coherence level isindicated above each response. The response in the unattended condition(open histogram) is shown below the valid cueing condition. C, Averagedriven response for the first 300 msec of coherent motion. Driven rateswere computed using the difference between the two 300 msec periodsbefore and after the onset of the coherent motion signal. The solid line isthe best linear fit. The dotted lines and arrow indicate the equivalentmotion coherence (12.5%) in the attended condition that produced thesame neuronal response as the unattended condition. Error bars indicateSEM.at 22.5% motion coherence, withdrawing attention reduced themonkeys behavioral performance from 0.6 to 0.3. This was equivalent to the behavioral performance at the 13.5% motion coherence level in the attended condition. Thus the behavioral effect ofwithdrawing attention in units of motion coherence is 13.5–22.5% 9% and represented a significant change in behavior (bootstrap; p 0.0; see Materials and Methods).The time course of the response of the MT neuron is shown inFigure 3B aligned to the onset of the coherent motion stimulus(vertical line). The response to the coherent motion was greaterfor stronger motion signals. The effect of attention on the neuronal response can be seen by comparing the histograms for the twoattentional conditions at 22.5% coherent motion stimulus. Theresponse of the neuron was reduced on trials when the monkeywas attending to the patch of dots outside the RF (Attend out). Weused the increment in driven rate (Fig. 1 B, c) to quantify thestrength of the neuronal response. This was computed as themean firing rate produced by the coherent motion signal minusthe mean firing rate produced by the 0% coherent motion usingthe two 300 msec periods just before and after the onset of thecoherent motion. The mean driven response above the 0% back-
1998 J. Neurosci., March 1, 2002, 22(5):1994–2004Figure 4. A representative VIP neuron. Same format as Figure 3. A,Behavioral performance as a function of coherent motion. B, Time courseof neuronal response. C, Average driven rate above 0% coherent motionas a function of motion coherence. Error bars represent SEM.ground for this MT neuron is plotted in Figure 3C. The drivenrates of firing were typically small, but this is not surprisingbecause the motion signals were set to be close to detectionthreshold.We described the response of each neuron as a function ofmotion coherence using a linear relationship (see Materials andMethods). Of 93 MT cells, 11 were not well described by a linearrelationship and were excluded from further analysis. Using thelinear fits, we computed the effect of withdrawing attention inunits of motion coherence, which is shown by the dotted line inFigure 3C. For this neuron, withdrawing attention was equivalentto changing motion coherence in the valid cueing condition by theamount of 12.5–2.5% 10%. This change, however, was notsignificant (bootstrap; p 0.09).In this example, withdrawing attention reduced both behaviorand neuronal activity by similar amounts. This was not true for allcells in either MT or VIP. A different effect of attention isillustrated for an example VIP neuron in Figure 4. The monkey’sbehavioral performance during the motion detection task is illustrated in Figure 4 A. In this case, the reduction in behavioralperformance that occurred while the monkey directed attentionaway from the stimulus in the RF was equivalent to 9% in unitsof motion coherence (bootstrap; p 0.0). The neuronal responses to the low, medium, and high coherent motion levels areshown in Figure 4, B and C. This cell, like many VIP neurons,was strongly suppressed while the monkey directed attention awayfrom the stimulus in the RF. In Figure 4C, the mean drivenneuronal response above the 0% coherent background is shown.The respon
Howard Hughes Medical Institute and Division of Neuroscience, Baylor College of Medicine, Houston, Texas 77030 Although many studies have demonstrated that neuronal re-sponses are modulated by attention, the significance of this modulation for behavior is poorly understood. We recorded from neurons in the middle temporal (MT) and ventral intrapa-