Transcription
Instream Flow Study of theMiddle and Lower Brazos RiverDraft Study DesignPrepared forMiddle and Lower Brazos River Sub-Basin Study DesignWorkgroupPrepared byTEXAS INSTREAM FLOW PROGRAMAND BRAZOS RIVER AUTHORITYMARCH 2010
Contents1.02.03.04.05.06.0INTRODUCTION.51.1 Summary of available information and results of preliminary analysis andreconnaissance surveys .61.1.1 Hydrology .91.1.2 Biology.151.1.3 Physical Processes .211.1.4 Water Quality .231.1.5 Connectivity .291.1.6 Allens Creek Reservoir Study.291.2 Assessment of Current Conditions.301.2.1 Hydrology .301.2.2 Biology.301.2.3 Physical Processes .311.2.4 Water Quality .321.2.5 Connectivity .321.3 Conceptual Model .32STAKEHOLDER INVOLVEMENT AND STUDY DESIGNDEVELOPMENT .352.1 Stakeholder Involvement .352.2 Study Goal and Objectives.352.2.1 Hydrology .352.2.2 Biology.362.2.3 Physical Processes .362.2.4 Water Quality .362.2.5 Connectivity .362.3 Study Indicators .36DESCRIPTION OF TECHNICAL STUDIES .453.1 Study Site Selection .453.2 Study Components .513.2.1 Hydrology and Hydraulics .513.2.2 Biology.553.2.3 Physical Processes .633.2.4 Water Quality .653.2.5 Connectivity .67CONTINUED STAKEHOLDER INVOLVMENT AND FUTUREACTIVITIES .68REFERENCES.71APPENDIX .78II
List of TablesTable 1.Table 2.Table 3.Table 4.Table 5.Table 6.Table 7.Table 8.Table 9.Table 10.Table 11.Table 12.Table 13.Table 14.Table 15.Studies of interest to the TIFP study of the middle and lower Brazos River subbasin. 8USGS stream gages with daily streamflow data of interest in the middle andlower Brazos River sub-basin. . 9Brazos River Basin reservoirs with original capacities greater than 100,000acre-feet. . 13Population data for counties with largest urban areas near the middle and lowerBrazos River. . 14Life history and population information on fish species collected in the middleand lower Brazos River sub-basin. . 16Biological and habitat sample site locations on the middle and lower Brazos River,Little River and Navasota River. . 19Historic occurrence, recent collection, and current status of mussel species inthe Brazos River basin. . 21Water quality data information in the middle and lower Brazos River . 25Ecological processes supported by instream flow components of the middleand lower Brazos River. . 34List of Hydrology indicators and their importance to the instream flow study. . 37List of Biology indicators and their importance to the instream flow study. . 38List of Physical Processes indicators and their importance to the instream flowstudy. . 42List of Water Quality indicators and their importance to the instream flow study. 43List of Connectivity indicators and their importance to the instream flow study . 44Description of proposed TIFP Study Areas and Reaches for the middle and lowerBrazos River . 48III
List of FiguresFigure 1.Figure 2.Figure 3.Figure 4.Figure 5.Figure 6.Figure 7.Figure 8.Figure 9.Figure 10.Figure 11.Figure 12.Figure 13.Map of the Brazos River basin with middle and lower Brazos River sub-basin (studyboundary) depicted . 7Median of daily streamflow values for USGS gage 08096500, Brazos River atWaco . 11Flow duration curves for daily average flow at USGS gage 08096500, Brazos Riverat Waco . 11Median of daily streamflow values for USGS gage 0811400, Brazos River atRichmond . 12Flow duration curves for daily average flow at USGS gage 0811400, Brazos Riverat Richmond . 12Average monthly precipitation for Brenham, Texas for the periods 1903 to 1940and 1984 to 2008 (National Climate Data Center data) . 13TIFP baseline fish sampling and mussel collection sites in the middle and lowerBrazos River sub-basin . 20Major wastewater dischargers in the middle and lower Brazos River sub-basin. . 26Water diversion points on the middle and lower Brazos River . 27SWQM monitoring sites in the middle and lower Brazos River sub-basin . 28General conceptual model of the riverine ecosystem of the middle and lowerBrazos River . 33Proposed TIFP Study Areas, Reaches and Sites for the middle and lower BrazosRiver . 47Stages of stakeholder participation in the TIFP study of the middle and lowerBrazos River . 68IV
1.0 INTRODUCTIONThe Brazos River basin is one of the most diverse river basins in the state, spanning eightdistinct ecoregions and rainfall conditions that vary from a mean average of 6 inches per year inheadwater areas to more than 50 inches per year near its mouth. The middle and lower BrazosRiver (portion downstream of Lake Brazos in Waco) reflects much of that diversity as it travels403 miles through or along the edge of 12 counties in south central and south east Texas. Alongthe way, the middle and lower Brazos passes through four ecoregions (Gould et al. 1960): asmall extent of Cross Timbers and Prairies at the upper end, alternating bands of BlacklandPrairie and Post Oak Savannah, and finally Gulf Prairies and Marshes at the lower end. Themiddle and lower Brazos River supports a diverse ecological community that relies on thequality, quantity, and timing of water moving through the system.The hydrology of the middle and lower Brazos has been affected by the operation of reservoirswhich were constructed in the upper watershed as early as 1941. Typical impacts of reservoirdevelopment include a reduction in the magnitude and frequency of large flood events and anincrease in the magnitude of low flows. Downstream of Waco, tributaries (Little Brazos River,Little River, Yegua Creek and the Navasota River) and unregulated areas contribute to theriver’s flow, reducing the impacts of reservoirs. . The flow of the middle and lower BrazosRiver thus continues to be variable with the seasons and responsive to precipitation patternswithin the sub-basin. This portion of the river remains the most hydrologically intact within thebasin and is one of the largest, relatively intact floodplain rivers in North America.The middle and lower Brazos River sub-basin has undergone several transformations over thepast century. Native landscapes have given way to agriculture, the primary land use in the subbasin. Urban areas have developed, including Waco, Bryan/College Station, and suburbanareas in Fort Bend and Brazoria counties that are part of the Houston metropolitan area.Mining and industry have developed in areas such as Grimes and Brazoria counties. Damshave been constructed on many of the tributaries. Groundwater resources in the sub-basin,including the Brazos River alluvium aquifer, have been developed. Near its mouth,channelization and levee projects have impacted the river. Along with population and land usepatterns, diversions from and return flows to the river have changed over time.The middle and lower Brazos River is one of the largest, relatively intact floodplain rivers inNorth America and remains a valuable natural resource for the State of Texas. Nevertheless,transformations within the basin have had a cumulative impact on fish and wildlife dependanton the river. For example, notable changes in fish (Bonner and Runyan 2007) and mussel(Karatayev and Burlakova 2008) assemblages have been documented. Understanding the flowneeds of ecosystems dependant on the river provides the rationale behind the Texas InstreamFlow Study (TIFP) of the middle and lower Brazos River.Senate Bill 2, enacted in 2001 by the 77th Texas Legislature, established the TIFP. The purpose ofthe TIFP is to perform scientific studies to determine flow conditions necessary to support asound ecological environment in the rivers and streams of Texas. With passage of Senate Bill 3in 2007, the Texas Legislature restated the importance of maintaining the health and vitality ofthe State’s surface-water resources and further created a stakeholder process that would resultin science and policy based environmental flow regime recommendations to protect instreamflows and freshwater inflows on a basin-by-basin basis.5
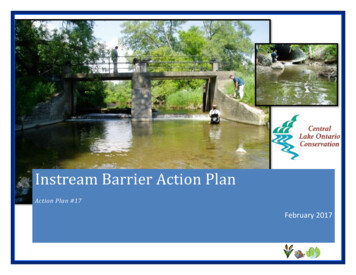
Stakeholder involvement has been a key component of the TIFP’s middle and lower BrazosRiver sub-basin study. Through a series of TIFP sponsored meetings, stakeholders were briefedon the TIFP, informed about the available information and current conditions in the sub-basin,and provided a framework from which to define the study goal, objectives, and indicators(described in Section 2.0).The focus of this Study Design document is to provide: an overview (Section 1.0) ofoavailable information, results of preliminary analyses and reconnaissancesurveys,oassessment of current conditions, andoa conceptual model of the middle and lower Brazos River sub-basin; an overview of the stakeholder process and description of the study goal, objectives,and indicators developed with stakeholders (Section 2.0); a description of the proposed technical studies (Section 3.0), includingoStudy Site locations,odata collection methods and analysis, andomultidisciplinary coordination; and an overview of continued stakeholder involvement and future activities (Section 4.0).Ultimately, the culmination of study efforts will be to characterize the flow-habitat and flowecological relationships within the riverine ecosystem supported by the middle and lowerBrazos River (Brazos River downstream of Lake Brazos in Waco to the Gulf of Mexico). Resultswill provide a means of assessing the relevant biological and physical factors associated withvarious flow regimes. A comprehensive tool will be generated from existing studies and fieldgathered data that will provide predictive capabilities necessary to evaluate the ecologicalsignificance of the full range of flows (from low, to moderate, to high throughout the annualhydrologic cycle) on the riverine ecosystem of the middle and lower Brazos River.1.1Summary of available information and results of preliminary analysis andreconnaissance surveysThe middle and lower Brazos River sub-basin is shown in Figure 1. An inventory of availabledata and study reports related to the hydrologic, biologic, geomorphic, water quality, andconnectivity features of the middle and lower Brazos River sub-basin was completed by theBrazos River Authority (BRA). This effort (BRA 2005) identified more than 300 reports, sourcesof data, or information related to the study area. Results were then summarized in a databaseand used to identify gaps in the data (either spatially or temporally). Identification of thesegaps by the TIFP and BRA directed specific field surveys and preliminary analysis to bettercharacterize the current condition of the river system. TIFP and BRA staff also conductedsurveys of the river in order to familiarize themselves with conditions on the river, and evaluatelocations for access and conducting baseline data collection.A representative example of available information and recent technical studies used to supportthe Study Design are presented in Table 1. Listing of a study in this table does not imply anendorsement by the TIFP of any conclusions documented in these reports. Rather, these studiesare identified because they have collected valuable data related to riverine ecosystems in themiddle and lower Brazos River sub-basin. This data will be considered and incorporated alongwith data collected by TIFP in order to provide a better understanding of the study area.6
Figure 1. Map of the Brazos River basin with middle and lower Brazos River sub-basin (studyboundary) depicted.7
Table 1.Studies of interest to the TIFP study of the middle and lower Brazos River sub-basin.Type of StudyName of sAll DisciplinesBrazos River bar: a study in the significance of grain sizedparametersThe nature of channel planform change: Brazos River,TexasAnalysis of instream flows for the lower Brazos River –hydrology, hydraulics, and fish habitat utilizationFolk & Ward19571997All DisciplinesResponse of oxbow lake biota to hydrologic exchangeswith the Brazos River channelMiddle and lower Brazos River instream flow study –data summary evaluation and databaseGillespie& GiardinoOsting,Mathews,& AustinWinemilleret al.BRAAll Disciplines200420042005PhysicalProcessesMorphology and stratigraphy of the late Quaternarylower Brazos valley: Implications for paleo-climate,discharge and sediment deliverySylvia &Galloway2006BiologyFish assemblage changes in three western gulf slopedrainagesBiological data collection – Brazos River study areaBrazos River basin summary reportField data collection in support of geomorphicclassification of the lower Brazos and Navasota RiversGeologic and hydrogeologic information for ageodatabase for the Brazos River alluvium aquifer, BosqueCounty to Fort Bend County, TexasHydrogeologic characterization of the Brazos Riveralluvium aquifer, Bosque County to Fort Bend County,TexasApplication of surface geophysical methods, withemphasis on magnetic resonance soundings, tocharacterize the hydro-stratigraphy of the Brazos Riveralluvium aquifer, College Station, Texas, July 2006Base flow (1966-2005) and streamflow gain and loss (2006)of the Brazos River, McLennan County to Fort BendCounty, Texas, 2006Distributional survey and habitat utilization of freshwatermusselsHistorical channel adjustment and estimates of selectedhydraulic values in the lower Sabine River and lowerBrazos River basins, Texas and LouisianaDistributional survey and habitat utilization of freshwatermussels (Family Unionidae) in the lower Brazos andSabine River basinsBonner &RunyanBRABRAPhillips2007BiologyWater ogy200720072007Shah &Houston2007Shah,Houston, &BraunShah, Kress,& Anatoly2007Turco, East,& Milburn2007Karatayev &BurlakovaHeitmuller &Greene2008Randklev,Kennedy, &Lundeen200720092010The following sections highlight key studies and preliminary results which describe existinghydrology, biology, geomorphology, water quality, and connectivity conditions in the middleand lower Brazos River sub-basin. Please note that throughout this document the termsgeomorphology and physical processes will be used interchangeably to refer to the science orfield of study related to processes that shape the physical features of a river system.8
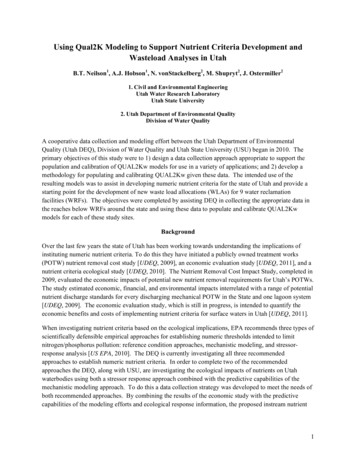
1.1.1 HydrologyUSGS gage data and flow trends at representative gagesThe U.S. Geological Survey (USGS) has maintained a network of streamflow gages in themiddle and lower Brazos River sub-basin since 1898. Currently, the USGS operates 38 gages inthe sub-basin, including 6 on the mainstem of the Brazos River and 32 on tributaries. Somehistorical data is also available from an additional five mainstem stream gages that are nolonger maintained. Stream gages with daily streamflow data of interest to an instream flowstudy of the middle and lower Brazos are listed in Table 2.Observation of the available gage data indicates that flow conditions in the middle and lowerBrazos River have changed over time. Figure 2 shows median flow for each day of the year fordata collected from USGS gage #08096500, Brazos River at Waco. The first data set, collectedfrom 1898 to 1940, reflects pre-development hydrology of the river at this location. The seconddata set, collected from 1984 to 2008, reflects current conditions and the combined effects ofchanges in the basin. As shown in this figure, median flow in late spring (May) has beenreduced while flows in late fall through early spring (November through April) and summer(August) have increased. Median flows in June, September, and October are little changed.Table 2.USGS stream gages with daily streamflow data of interest in the middle and lowerBrazos River sub-basin.Median DrainageEarliest LatestFlowAreaGage #Gage NameRecord Record(cfs)(mi2)08096500 Brazos Rv at Waco, TX1898 Present77129,55908097500 Brazos Rv nr Marlin, TX193819511,06030,21108098290 Brazos Rv nr Highbank, TX1965Present1,00030,43608106500 Little Rv nr Cameron, TX1916Present5007,06508108700 Brazos Rv at SH 21 nr Bryan, TX1993Present1,65039,04908109000 Brazos Rv nr Bryan, TX189919931,78039,51508110000 Yegua Ck nr Somerville, TX192419916.41,00908110100 Davidson Ck nr Lyons, TX1962Present2.819508110800 Navasota Rv at OldSpanishRd nr Bryan,TX1997Present681,28708111000 Navasota Rv nr Bryan, TX19511997541,45408111010 Navasota Rv nr College Station,TX19771985811,80908110200 Brazos Rv at Washington, TX196519872,31041,19208111500 Brazos Rv nr Hempstead, TX1938Present2,56043,88008111700 Mill Ck nr Bellville, TX1963Present3408114000 Brazos Rv at Richmond, TX1903Present2,94045,10708114500 Brazos Rv nr Juliff, TX194919691,94045,18908115000 Big Ck nr Needville, TX1947Present1.808116650 Brazos Rv nr Rosharon, TX1967Present3,60045,33908117290 Brazos Rv at Freeport, TX20022002NA45,603937642.8
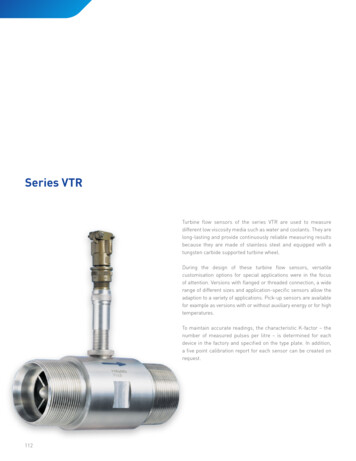
Figure 3 shows the daily gage data for these same time periods displayed as flow durationcurves. From this figure, it can be seen that the occurrence of daily flows between 3,000 and9,000 cfs and in excess of 30,000 cfs have been reduced slightly from the earlier time period.Conversely, the occurrence of flows between 10,000 and 25,000 cfs has increased slightly. Themagnitude of lower flows (those that are exceeded more than 40% of the time) has alsoincreased. The hydrologic changes shown in Figures 2 and 3 are typical for rivers that havebeen impounded in order to provide flood protection and a more stable water supply.Observation of data from USGS gage 08114000, Brazos River at Richmond, illustrates that thepattern of hydrologic change is not uniform in the sub-basin. Figures 4 and 5 show daily flowdata collected at that gage for the same pre-1941 and post-1983 time periods. It should be notedthat the gage at this location did not begin operation until 1903 and there is a gap in the datafrom 1907-1922. Figure 4 shows an increase in November through January median flows frompre-development conditions, but flows remain relatively similar during the rest of the year.Figure 5 shows an increase in magnitude for the entire range of flows exceeded more than 2percent of the time. The type of change shown in Figure 5 is typical for a basin experiencingincreased runoff due to factors such as increased precipitation or increased impervious coverwithin the basin. The changes may also be a result of reservoir operation for hydropowergeneration, flood control, or water supply. A hydrologic evaluation of the sub-basin, asdescribed in Section 6.1 of the TIFP Technical Overview (TIFP 2008), will be required in order toinvestigate these changes fully.Changes in the hydrology of the middle and lower Brazos River are due to a combination offactors, which include construction of dams and reservoirs, urban growth and other land usechange, and changes in precipitation. As shown in Figure 6, average monthly precipitation forBrenham, Texas has been greater in the period since 1984, relative to the period before 1941.Dams and reservoirs can have a significant impact on hydrology. Although there are noreservoirs on the mainstem of this portion of river, construction and operation of reservoirs inthe basin as a whole may have affected the hydrology of the middle and lower Brazos River.There are 15 reservoirs within the Brazos River basin that were designed with flood and/orconservation storage capacities in excess of 100,000 acre-feet (listed in Table 3). Eight of thesereservoirs are located upstream of the middle and lower Brazos sub-basin (three on the BrazosRiver mainstem and the remainder on tributaries). Seven are located on tributaries within themiddle and lower Brazos River sub-basin. Construction of these reservoirs was completedbetween 1941 and 1983.Land use changes associated with development and a growing human population can alsoaffect hydrology. The human population of the 12 counties the middle and lower Brazos Riverflows through or along has grown significantly during the past decades. These counties includeAustin, Brazoria, Brazos, Burleson, Falls, Fort Bend, Grimes, McLennan, Milam, Robertson,Waller, and Washington counties. According to US Census data, their combined populationhas grown from less than 400,000 in 1940 to just over 700,000 in 1980 and more than 1.1 millionin 2000. The estimated population of these 12 counties was more than 1.4 million in 2008 and isprojected to increase to more than 2.8 million by 2060.10
Figure 2. Median of daily streamflow values for USGS gage 08096500, Brazos River at Waco.Figure 3. Flow duration curves for daily average flow at USGS gage 08096500, Brazos River atWaco.11
Figure 4. Median of daily streamflow values for USGS gage 0811400, Brazos River atRichmond.Figure 5. Flow duration curves for daily average flow at USGS gage 0811400, Brazos River atRichmond.12
Figure 6. Average monthly precipitation for Brenham, Texas for the periods 1903 to 1940 and1984 to 2008 (National Climate Data Center data).Table 3. Brazos River Basin reservoirs with original capacities greater than 100,000 acre-feet.Location inBrazos esMiddle eet]Reservoir NamePossum Kingdom LakeLake WhitneyLake GranburyHubbard Creek ReservoirLake WacoSquaw Creek ReservoirAquilla LakeAlan Henry ReservoirBelton LakeProctor LakeSomerville LakeStillhouse Hollow LakeLake LimestoneGranger LakeLake 977198319941954196319671968197819791982a result of sedimentation, a reservoir’s flood and conservation storage decrease over time. Therefore,these numbers do not reflect current capacities.13
Land use changes affect the hydrology of a river in several ways. For example, conversion ofland from agriculture to urban areas can increase peak flows and decrease base flows. Land usein the upper portion of the sub-basin is primarily agricultural with two sizeable urban areas,Waco in McLennan County and Bryan/College Station in Brazos County. The lower portion ofthe sub-basin has many and varied land uses, including agriculture, oil and gas retrieval,chemical industry, mining, and municipalities. The largest urban areas in the lower portion ofthe sub-basin are in Brazoria and Fort Bend counties and have experienced substantialpopulation growth along with the greater Houston metropolitan area. Table 4 showspopulation growth and projections for the counties with the largest urban areas near the middleand lower Brazos River.Surface water diversions and (depending on geology) groundwater extractions can also affectstream hydrology. Irrigated agriculture, dependant on both surface water and groundwater(including the Brazos alluvium aquifer), has historically been the largest user of water in thesub-basin. Water use for agriculture has declined over the past decades, however, andwithdrawls for manufacturing and municipal use are now nearly as large as those foragriculture. Surface water diversions in the 12 counties have actually decreased (largely due todecreased agricultural demand) from almost 655,000 acre-feet in 1980 to less than 420,000 acrefeet in 2000. However, groundwater pumping has grown from less than 250,000 acre-feet in1980 to almost 325,000 acre-feet in 2000.The Brazos River alluvium aquifer extends along the river from Bosque to Fort Bend counties.Groundwater/surface water interactions between this aquifer and the middle and lower BrazosRiver may be significant during some flow conditions. Gains or losses to the aquifer may affectsubsistence and base flows in the river while high flow pulses and overbank flows may providesignificant recharge to the aquifer. Recent studies have estimated streamflow gains and lossesand determined characteristics of the Brazos River alluvium aquifer (see Section 1.1.5).Table 4. Population data for counties with largest urban areas near the middle and lowerBrazos River.CountyBrazoriaBrazosFort BendMcLennanUrban AreasPearlandBryan,College StationSugar LandWaco1940aCensus27,06926,97732,963101,898County Population1980a2000a2008bCensusCensus 130,846170,755aUS354,452213,517census datacensus estimatescTWDB 2006 regional water plan county population 4279,1821,475,761307,378
1.1.2 BiologyFisheries data collection results summarySixty two native freshwater, 4 marine and two introduced fish species have been reported fromthe mainstem of the middle and lower Brazos River from collections dating back to 1939 (Table5). Life history and population information for these species are also provided in Table 5 andare based upon scientific studies (Balon 1975, Balon 1981, Williams et al. 1989, Warren et al.2000, BRA 2007, Bonner and R
North America and remains a valuable natural resource for the State of Texas. Nevertheless, transformations within the basin have had a cumulative impact on fish and wildlife dependant on the river. For example, notable changes in fish (Bonner and Runyan 2007) and mussel (Karatayev and Burlakova 2008) assemblages have been documented.