Transcription
BP Statistical Reviewof World Energy2019 68th edition
ContentsFor 66 years,the BPNaturalgasStatistical Review of WorldRenewable eserves51Renewables consumption1 Group chief executive’s kets.32Production52Generation by source2 2018 at a glance34Consumption53Biofuels production3 Group chief economist’s analysisThe review is one of the most widely respected37Pricesand authoritative publications in the field of Electricityenergy38 Trade movementsPrimary energyeconomics, used for reference by the media,54 Generation8 Consumptionacademia, Coalworld governments and energy56 Generation by fuel9 Consumption by fuelcompanies.A new edition is published every June.42 Reserves12 Consumption per nConsumptionPricesRefiningTrade movements44 Production45 ConsumptionDiscover more47 onlinePrices and trade movementsAll the tables and charts found in the latest printededition are available at bp.com/statisticalreviewplus a number of extras, including:Nuclear energy48 Consumption The energy charting tool – viewpredetermined reports or chart specific dataaccording to energy type, region, countryand year.Hydroelectricity Historical data from 1965 for many sections.49 Consumption Additional data for refined oil productiondemand, natural gas, coal, hydroelectricity,nuclear energy and renewables. PDF versions and PowerPoint slide packs ofthe charts, maps and graphs, plus an Excelworkbook of the data.CO2Carbon57 Carbon dioxide emissionsKey minerals58 Production59 Reserves59 PricesAppendices60 Approximate conversion factors60 Definitions61 More information Regional and country factsheets. Videos and speeches.Energy OutlookDiscover more onlineWatch the BP Energy Outlook 2017 video,containingourareprojectionsof long-term energyAll the tables and charts found in the printededitionavailabletrends to 2035. Download the booklet andat bp.com/statisticalreview plus a number ofextras,including:presentation materials at bp.com/energyoutlook The energy charting tool – view predeterminedreports or chartJoin the conversationspecific data according to energy type,#BPstatsregion, country and year.Download the BP World Energy appExplore the world of energy from your tablet or smartphone.Customize charts and perform the calculations. Reviewthe data online and offline. Download the app for free fromthe Apple App Store and Google play store. Historical data from 1965 for many sections.AdditionalDownloadthe BP World Energy appcountry and regional coverage for all consumption tables.Explore the world of energy from your tablet or Additional data for refined oil tomizechartsperform thecalculations. Review the data online and offline.hydroelectricity, nuclear energy and renewables.Download the app for free from the Apple PDF versions and PowerPoint slide packsof themapsApp Storeandcharts,Google playstore.and graphs, plus an Excel workbook and database format of the data. Regional and country factsheets. Videos and speeches.DisclaimerThe data series for proved oil and gas reserves in BP Statistical Review of World Energy June 2017 does not necessarilymeet the definitions, guidelines and practices used for determining proved reserves at company level, for instance, aspublished by the US Securities and Exchange Commission, nor does it necessarily represent BP’s view of provedreserves by country. Rather, the data series has been compiled using a combination of primary official sources andthird-party data.
Group chief executive’s introductionThe developments documented in this year’s Statistical Review highlight acritical challenge facing the global power sector. Power demand increasedeven more strongly than overall energy demand in 2018, as the worldcontinued to electrify. But this shift towards greater electrification can playan important part in the energy transition only if it is accompanied by adecarbonization of the power sector.Despite the continuing rapid growth in renewable energy last year, itprovided only a third of the required increase in power generation, with coalproviding a broadly similar contribution. Indeed, the increasing use of coalwithin the power sector is estimated to have more than accounted for theentire growth of global coal consumption last year.Overall, the electric power sector is estimated to have absorbed around halfof the growth in primary energy in 2018 and accounted for around half of theincrease in carbon emissions.Welcome to the BP Statistical Review ofWorld Energy, which records the events of2018: a year in which there was a growingdivide between societal demands for anaccelerated transition to a low carbon energysystem and the actual pace of progress.In particular, the data compiled in this year’s Review suggest that in 2018,global energy demand and carbon emissions from energy use grew at theirfastest rate since 2010/11, moving even further away from the acceleratedtransition envisaged by the Paris climate goals.BP’s economics team estimate that much of the rise in energy growthlast year can be traced back to weather-related effects, as families andbusinesses increased their demand for cooling and heating in response toan unusually large number of hot and cold days. The acceleration in carbonemissions was the direct result of this increased energy consumption.Even if these weather effects are short-lived, such that the growth in energydemand and carbon emissions slow over the next few years, there seemslittle doubt that the current pace of progress is inconsistent with the Parisclimate goals. The world is on an unsustainable path: the longer carbonemissions continue to rise, the harder and more costly will be the eventualadjustment to net-zero carbon emissions. Yet another year of growingcarbon emissions underscores the urgency for the world to change.Decarbonizing the power sector while also meeting the rapidly expandingdemand for power, particularly in the developing world, is perhaps the singlemost important challenge facing the global energy system over the next20 years. Renewable energy has a vital role to play in meeting that challenge.But it is unlikely to be able to do so on its own. A variety of differenttechnologies and fuels are likely to be required, including extensive coal-togas switching and the widespread deployment of carbon capture, use andstorage (CCUS). As I have said before, this is not a race to renewables, it isa race to reduce carbon emissions across many fronts.Our industry, and society more generally, face significant challenges aswe navigate the transition to a low carbon energy system. That will requireunderstanding and judgement, both of which rely on the kind of objectivedata and analysis found in the Statistical Review. We are proud of the rolethat the BP Statistical Review has played in informing public debate overthe past 68 years and I hope that you find it a useful resource for yourown discussions and deliberations.Let me conclude by thanking BP’s economics team and all those whohave helped us prepare this Review – particularly those governments andstatistical agencies around the world who have contributed their official dataagain this year. Thank you for your continuing co-operation and transparency.Bob DudleyGroup chief executiveJune 2019The Statistical Review provides a timely and objective insight into thosedevelopments and how that change can begin to be achieved.The strength in energy consumption was reflected across all the fuels,many of which grew more strongly than their recent historical averages.This acceleration was particularly pronounced for natural gas, which grewat one of its fastest rates for over 30 years, accounting for over 40% of thegrowth in primary energy. On the supply side, the data for 2018 reinforcedthe central importance of the US shale revolution. Remarkably, the USrecorded the largest ever annual increases by any country in both oil andnatural gas production last year, with the vast majority of both increasescoming from onshore shale plays. At the same time, renewable energy,led by wind and solar power, continued to grow far more rapidly than anyother form of energy.BP Statistical Review of World Energy 20191
2018 at a glanceGlobal primary energy consumption grewrapidly in 2018, led by natural gas andrenewables. Nevertheless, carbon emissionsrose at their highest rate for seven years. 2.9%Growth of global primary energyconsumption, the fastest growth since 2010.Energy developments Primary energy consumption grew at a rate of 2.9% last year,almost double its 10-year average of 1.5% per year, and the fastestsince 2010. By fuel, energy consumption growth was driven by natural gas,which contributed more than 40% of the increase. All fuels grewfaster than their 10-year averages, apart from renewables, althoughrenewables still accounted for the second largest increment toenergy growth. Global natural gas production increased by 190 bcm, or 5.2%.Almost half of this came from the US (86 bcm), which (as with oilproduction) recorded the largest annual growth seen by any countryin history. Russia (34 bcm), Iran (19 bcm) and Australia (17 bcm)were the next largest contributions to growth. Growth in inter-regional natural gas trade was 39 bcm or 4.3%,more than double the 10-year average, driven largely by continuingrapid expansion in liquefied natural gas (LNG). China, the US and India together accounted for more than twothirds of the global increase in energy demand, with USconsumption expanding at its fastest rate for 30 years. LNG supply growth came mainly from Australia (15 bcm), the US(11 bcm) and Russia (9 bcm). China accounted for around half of theincrease in imports (21 bcm).Carbon emissionsCoal Carbon emissions grew by 2.0%, the fastest growth for seven years. Coal consumption grew by 1.4%, double its 10-year average growth.Oil Consumption growth was led by India (36 mtoe) and China(16 mtoe). OECD demand fell to its lowest level since 1975. The annual average oil price (Dated Brent) rose to 71.31 per barrel,up from 54.19/barrel in 2017. Oil consumption grew by an above-average 1.4 million barrels perday (b/d), or 1.5%. China (680,000 b/d) and the US (500,000 b/d)were the largest contributors to growth. Global oil production rose by 2.2 million b/d. Almost all of the netincrease was accounted for by the US, with their growth inproduction (2.2 million b/d) a record for any country in any year.Elsewhere, production growth in Canada (410,000 b/d) and SaudiArabia (390,000 b/d) was outweighed by declines in Venezuela(-580,000 b/d) and Iran (-310,000 b/d). Refinery throughput rose by 960,000 b/d, down from 1.5 millionb/d in 2017. Nevertheless, average refinery utilization climbed to itshighest level since 2007.Natural gas Natural gas consumption rose by 195 billion cubic metres (bcm), or5.3%, one of the fastest rates of growth since 1984. Growth in gas consumption was driven mainly by the US (78 bcm),supported by China (43 bcm), Russia (23 bcm) and Iran (16 bcm). Coal’s share in primary energy fell to 27.2%, its lowest infifteen years. Global coal production rose by 162 mtoe, or 4.3%. China (82 mtoe)and Indonesia (51 mtoe) provided the largest increments.Renewables, hydro and nuclear Renewable power grew by 14.5%, slightly below its historicalaverage, although its increase in energy terms (71 mtoe) was closeto the record-breaking increase of 2017. Solar generation grew by 30 mtoe, just below the increase in wind(32 mtoe), and provided more than 40% of renewables growth. By country, China was again the largest contributor to renewablesgrowth (32 mtoe), surpassing growth in the entire OECD (26 mtoe). Hydroelectric generation increased by an above-average 3.1%, withEuropean generation rebounding by 9.8% (12.9 mtoe), almostoffsetting its steep decline in the previous year. Nuclear generation rose by 2.4%, its fastest growth since 2010.China (10 mtoe) contributed almost three quarters of global growth,with Japan (5 mtoe) the second largest increase.Electricity Electricity generation rose by an above-average 3.7%, buoyed byChina (which accounted for more than half of the growth), Indiaand the US. Renewables accounted for a third of the net increase in powergeneration, followed closely by coal (31%) and then naturalgas (25%). The share of renewables in power generation increased from8.4% to 9.3%. Coal still accounted for the largest share of powergeneration at 38%.Key minerals Cobalt and Lithium production rose by 13.9% and 17.6%respectively, both well in excess of their 10-year averagegrowth rates.Above: Singapore central business district.2BP Statistical Review of World Energy 2019 Cobalt prices rose 30% to their highest levels since 2008, whileLithium carbonate prices increased by 21% to new highs.
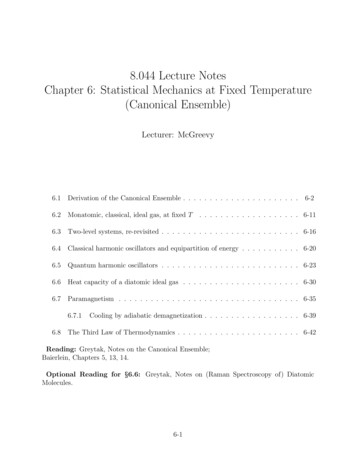
Group chief economist’s analysisPrimary energyContribution to primary energy growth in 2018Cumulative contribution fricaRest ofWorld0%Energy in 2018: an unsustainable pathContributions shown do not sum to 100% due to roundingThe Statistical Review of World Energy has been providing timely andobjective energy data for the past 68 years. In addition to the raw data, theStatistical Review also provides a record of key energy developments andevents through time.energy consumption. Coal demand (1.4%) also increased for the secondconsecutive year, following three years of declines. Growth in renewableenergy (14.5%) eased back slightly relative to past trends although remainedby far the world’s fastest growing energy source.My guess is that when our successors look back at Statistical Reviewsfrom around this period, they will observe a world in which there wasgrowing societal awareness and demands for urgent action on c
PDF versions and PowerPoint slide packs of the charts, maps and graphs, plus an Excel workbook and database format of the data. Regional and country factsheets. Videos and speeches. Download the BP World Energy app Explore the world of energy from your tablet or smartphone. Customize charts and perform the calculations. Review the data online and offline. Download the app for free from the .