Transcription
Economic Mobility in Winston-Salem/Forsyth County, NC:A Closer Look into Employed Bus Riders’ Lives, Ambitions and MissedOpportunities to Climb the Economic LadderCSEM Working Papers in Transportation Series, no. 1. November 2018Zachary D. BlizardWinston-Salem State UniversityThis study was initiated by the Center for the Study of Economic Mobility (CSEM)located on the campus of Winston-Salem State University, in Winston-Salem, NC. CSEM is aresearch collaborative formed to understand and address the causes of low economic mobility inForsyth County.
INTROUCTION AND MOTIVATIONWinston-Salem, NC is consistently rated one of the best places to live. Home to the city aremany well-respected higher education institutions and prospering companies. Billions of dollarshave been invested in the downtown area over the last decade. However, Forsyth County, NC, thecounty in which Winston-Salem is located, is one of the worst in the United States regardingeconomic mobility. It is the third worst county in the country, the first two being counties locatedon Indian reservations. This is easily seen while exploring Chetty, Friedman, Hendren, Jones, andPorter’s (2018) interactive map named the Opportunity Atlas. According to a study by Harvardeconomists Chetty and Hendren (2018), children born to parents in the bottom income quantile inForsyth County are unlikely to ever reach higher quantiles. Thus, from one generation to the nextin Forsyth County, underprivileged families remain stuck in poverty. The United States takes greatpride in being known as the “land of opportunity,” where children can earn higher standards ofliving than their parents before them. In Winston-Salem, NC, however, the evidence suggests thatthis is not occurring.There are many factors that affect economic mobility. Chetty, Hendren, Kline, and Saez (2014)identify 5 main factors that determine economic mobility, which are 1) residential segregation, 2)income inequality, 3) quality of education system, 4) social capital, 5) family structure.Segregation is measured in part by the distance commuters travel for work. This measurement willindicate whether opportunities lie elsewhere, far from the commuter’s neighborhood. Residentialsegregation is one of the strongest correlates to economic mobility (Chetty et al., 2014). However,this factor may be capturing more than just physical segregation. It could also be that those whostand to gain the most from climbing the socioeconomic ladder, such as the poor and minorities,tend to lack personal vehicles and dedicate substantial amounts of their time to traveling on publicbuses to and from work without being compensated. Their commute times are higher than thosewith cars, even though the distance they travel is shorter (Gautier & Zenou, 2010; Hv & Young,1999; Kawabata, & Shen, 2007). They spend many hours a week on public transportation systems,hours that could have been used for more productive activities like working or spending time withfamily, both of which can impact economic mobility (Chetty et al., 2014). Thus, it’s not just beingresidentially segregated that can trap people on lower rungs of the socioeconomic ladder, but it isalso the commute itself that takes valuable time away from them to do any climbing of that ladder.Those without personal transportation and who rely on public systems, are not only losing timebut are being restricted by the routes the systems are set on and the schedules in which they areoperating (Gurley, & Bruce, 2005; Ong, 2002; Raphael, & Rice, 2002). Access to reliable and safetransportation is critical for success in the modern economy. Being physically mobile allows forthe access of a wider variety of jobs and opportunities (Thakuriah, & Metaxatos, 2000). Withouta personal vehicle, or at least a reliable public transportation system, the ability to access theseopportunities is severely restricted (Tomer, Kneebone, Puentes, & Berube 2011). Public bus usersare limited to jobs located near bus routes, or at least within reasonable walking distance. InWinston-Salem, the fifth largest city in North Carolina, located in the middle of Forsyth County,we believe the public transportation system is restricting the economic mobility of many of itsresidents, which is contributing to the county’s poor economic mobility score.It is crucial, from a public policy standpoint, to understand why economic mobility in ForsythCounty is so low. The socioeconomic ladder sometimes takes a generation to climb, therefore,residents being affected are losing precious years. If the barriers to economic mobility can beidentified, local governments can then work to remove them. It is our belief that a primary cause2
of Winston-Salem/Forsyth County’s economic mobility problem is the public transportationsystem. This report seeks to demonstrate how the transportation system is hindering the economicmobility of Winston-Salem and Forsyth County’s residents, in the hopes that the system will beimproved and the lives of the residents with it.This report sheds light on the lives of Winston-Salem’s employed bus riders by providingnumerous detailed graphics to help visualize the survey data. For the analyses, we implementedcorrelation and regression analyses and found that the labor productivity of female bus riders isnegatively impacted by long commutes on the bus. We also find that taking more buses to worknegatively impacts labor productivity. Along with the productivity losses due to commuting on thebus, we find that employed riders face severe opportunity costs from their reliance on the bussystem. We offer various policy solutions that could alleviate the barriers impeding economicmobility.LITERATURE REVIEWAccording to The Pew Charitable Trusts (2012), North Carolina (NC) has some of the lowestrates of economic mobility in the United States. Poor economic mobility is attributed to variousfactors, one being inefficient public transportation systems (Blumenberg and Pierce, 2014;Kaufman, Moss, Tyndall, and Hernandez, 2014; Bullard, 2003). Without proper transportation toand from jobs, events, and other beneficial economic activities, people can easily fall behind andbecome stuck in lower socioeconomic levels. This is especially relevant to Forsyth County, NC,which has some of the worst rates of economic mobility in the country, according to a study byChetty and Hendren (2018). Since public transportation has been identified as an importantdeterminant of economic mobility, it likely plays an important role in Forsyth County’spredicament.Local governments have recognized this trend in recent years and have actively worked toexpand the access to higher quality public transportation (Pastor and Turner, 2010). However,“some regions of the United States persistently offer less mobility than most other developedcountries,” as demonstrated by many counties within North Carolina (Chetty et al., 2014). Onearea of focus has been understanding the link between high quality public transportation and theoverall health of local economies. In a European report involving 45 nations, gross domesticproduct (GDP) was found to be positively linked to improvements in public transportation systems(Albalate, 2010). As GDP grows, demand for public transportation decreases due to increases invehicle ownership, which further boosts GDP. However, if residents lack viable transportation,then GDP growth will likely be stunted because lacking transportation decreases the likelihood ofparticipating in economic activities, such as working, shopping, and even networking (Kawabata,2007). Local governments might hesitate to invest in public transportation systems when theireconomies are sluggish. This exacerbates the challenges surrounding their economy, since highquality public transportation has been shown to improve GDP. Thus, they become trapped withboth low GDP growth and poor quality public transportation systems. Since the poor are thosewho stand to gain the most from high quality public transportation, they end up suffering from thisstalemate and economic mobility remains low.According to a study in 2000, while most jobs are accessible by a personal vehicle, only 60percent are accessible by public transportation (Thakuriah and Metaxatos, 2000). With a personalvehicle, geographical barriers between a person’s home and job opportunities are removed. Ifcommuters had personal vehicles or if their public transit system expanded operational hours, they3
would then be able to work non-standard work hours, which would increase income opportunities(Baum, 2009; Gurley and Bruce, 2005; Ong, 2002; Raphael and Rice, 2002). This would especiallybenefit those in lower income brackets. Thus, reliance on rigid public transportation schedulesprevent low income commuters from pursuing extra income opportunities. This in turn precludesthem from taking advantage of opportunities to get ahead. Overall, access to high quality publictransits and personal automobiles has a powerful influence on commuters’ ability to pursue, attain,and maintain employment (Cervero, Sandoval, and Landis, 2002). These are crucial determinantsof economic mobility.Public transportation systems have been found to increase the travel times of commuters,sometimes up to 90 minutes (Tomer, Kneebone, Puentes, and Berube, 2011). Long commute times,especially for those in poverty, are negatively correlated with workers’ earning potential, whichfurther decreases their ability to escape poverty and reach higher income levels (Chetty et al., 2014;Chetty and Hendren, 2018). This substantial time requirement, in combination with rigid publictransit schedules, prevent individuals in low-income areas from accessing nearly 80 percent of jobsin low/middle-skilled metropolitan job sectors, thus, decreasing their ability to escape poverty, andundermining economic mobility (Tomer, 2011).Incidents of crime and income tend to be negatively related (Hsieh and Pugh, 1993; Patterson,1991). Hence, the poor tend to reside in more crime prone areas. Quality public transportation hasoften avoided extending into areas of violent tendencies, which tends to restrict the physicalmobility of these residents. These areas often have large percentages of high school drop outs(Sharkey, 2017). Without the presence of public transportation in these areas, young adults withlower education achievements are unable to obtain proper employment and become trapped inthese impoverished areas. According to Tyndall (2017), if better transportation options wereextended to these individuals, to connect them to economic opportunities, unemployment andincome gaps would decrease. Overall, studies show that there is a strong positive correlationbetween car ownership, educational attainment, and the likelihood of transitioning off welfare(Cervero et al., 2002). Likewise, individuals who live closer to bus stops have higher employmentrates than those who live farther away (Sandoval, Cervero, and Landis, 2011). These factors arecritical in understanding economic mobility (Chetty et al., 2014). Evidence supports the conclusionthat physical mobility, whether it be with a personal vehicle or riding an efficient public bus,promotes all aspects of economic mobility.While having transportation options is important for accessing jobs, maintaining and improvingthe quality of these sources of transportation is imperative for employment retention. A studyconducted by Blumenberg and Pierce (2014) find that public transportation improvements increasethe likelihood of maintaining employment. These improvements were made to the systemsreliability, efficiency, and availability. Likewise, as work commutes shorten, commuters are morelikely to experience job stability (Crane, 1996). Gurley and Bruce (2005) estimate reliabletransportation’s impact on the hourly wages of low income workers. They find that, for lowerincome workers provided with more efficient transportation options, their hourly wages couldincrease by 1.40 (Gurley and Bruce, 2005). Thus, there was a sizeable labor productivity gain.Along with productivity losses due to transportation, individuals who use inefficient transportationwith longer commuters have an average daily opportunity cost of 14.59, compared to those withshort commutes who face an average daily opportunity cost of 5.92 (Ciscel, 2001). The overallopportunity cost to commuters has been estimated to equal roughly ten percent of their annualincomes (Ciscel, 2001). This percentage is larger for those who use public transportation systems,since their commute lengths are much longer than those with personal vehicles. With such4
significant opportunity costs, commuters earn less money, which could have otherwise promotedtheir economic mobility. Without high rates of job retention due to reliable transportation,economic mobility is less likely to occur.As was previously discussed, a recurring issue with public transportation systems is the amountof time they require to use, compared to private transportation. Many public transportation usersexperience trips that take twice the time it would take in a personal vehicle (Hu and Young, 1999).An astonishing finding is that there is a correlation estimate of 0.605 between decreases incommute times and upward economic mobility for children (Chetty et al., 2014). This relationshipstems from reduced residential segregation indicative of shorter commutes. Nevertheless, anadditional explanation is that extra time to pursue economic activities boosts economic mobility.More time required for commuting with public transportation limits the “hours available for otherproductive activities, such as networking, professional development, continuing education, andpersonal care,” thus, further limiting the potential for future job development (Majeski, 2015). Forjust a twenty-three-minute public transportation routine, a person is likely to lose potential earningsequivalent to 19 percent of their monthly salary, stemming from the opportunity cost of publictransits (Stutzer and Frey, 2008). This is particularly burdensome to low income commuters, whichdisproportionately belong to minority communities.Studies find it to be more difficult for minority groups, especially blacks and Hispanics, toexperience economic mobility. According to Gautier and Zenou (2010), blacks on average spendmore time traveling to work no matter the distance between their houses and their jobs. Their traveltimes are much higher when they use public transportation. As Gautier and Zenou (2010) argue,this sizeable time requirement reduces their ability to earn extra income and pursue othereconomically advantageous opportunities. Thus, black and Hispanic public transportation usershave lower rates of economic mobility, which explains their disproportionate rates ofintergenerational poverty. Corak (2013) argues that income inequality is the primary driver of pooreconomic mobility, which is evidenced by the severe income inequity in minority populations.Most researchers acknowledge that income inequality does play a role in low economic mobility.Nevertheless, it could be that income inequality, and in turn, poor economic mobility, are a resultof economic isolation caused by inefficient public transportation systems. Along with the racialdifferences in transportation’s impact on economic mobility, gender differences have beenexplored as well.According to studies by Madden (1981) and Hanson and Johnston (1985), women tend to haveshorter work commutes than men, and their longer commutes do not correspond to higher payingjobs, unlike for men. Roberts, Hodgson, and Dolan (2011) find similar evidence. They find thatfemale commuters are more sensitive to longer commutes, which affects well-being and jobsatisfaction. Commuting generally has a negative effect on subjective well-being, resulting in acorresponding opportunity costs due to the health impact, regardless of gender (Stutzer and Frey,2008). Nevertheless, the impact is worse for females. Their labor productivity takes a larger hit,which results in the female commuters earning less per hour (Thomas and Strauss, 1997; Glickand Sahn, 1998). Thus, female commuters that utilize public transportation face a greater burdensince commute times are longer. Since their labor productivity is negatively affected, and they tendto earn less than male commuters, it stands to reason that economic mobility among females isworse than males, and even worse for minority females.Public transportation is a key determinant of economic mobility, especially for vulnerablemembers of society who stand to gain the most from economic mobility. Chetty et al.’s (2014) 5main factors that determine economic mobility, which are 1) residential segregation, 2) income5
inequality, 3) quality of education system, 4) social capital, 5) family structure, are all impacted,directly or indirectly, by transportation. The research discussed above indicates that access to bettertransportation options, whether that be efficient public systems or personal vehicles, will lower theopportunity costs of commuting. The savings will stem from improved labor productivity andhealth, access to a wider range of employment opportunities, longer job retentions, and more timeto pursue enriching activities.DATAData used for this report are from the WSTA Employed Bus Rider Survey, which was designedby the Center for the Study of Economic Mobility at Winston-Salem State University. It is arepresentative survey involving employed bus riders in Winston-Salem, NC and was administeredin August of 2018. Ten interviewers delivered the survey, which consists of 54 questions. All theriders that participated in the survey were employed. The survey has three main sections, whichare Employment, Demographic, and Transportation.The first section, Employment, contains questions regarding the number of jobs held, hourlywages earned, and the number of hours worked per week. There are questions measuring commutetimes involving the bus and how frequently the bus is used. There are also questions measuringforegone economic opportunities stemming from the public bus system.The second section, Demographic, contains questions about education attainment, race, gender,and age. The section also contains questions regarding household size, household vehicles, andwhether riders have cell phones, among other things.The third and last section, Transportation, includes questions about the frequency of usingpublic transportation and the purpose of using it. There are questions about the impact of publictransportation on riders’ diets and how it has affected other areas of the riders’ lives. This sectionmeasures the perspectives surrounding the bus system, such as the bus riders’ confidence in thebus’s ability to get them to work on time. In addition, this section asks riders to rate the public bussystem on its over quality. Thus, the survey gathers data on a rich set of variables covering manyareas in the lives of employed bus riders in Winston-Salem, NC.The sample includes 215 observations of 215 unique employed bus riders. Of those surveyed,around 58 percent are male, while the remaining 42 percent are female. The average rider is justunder 42 years old. African Americans make up most of the employed bus riders in the WinstonSalem, consisting of around 78 percent. The next largest racial group are whites/Caucasians.Around 11 percent of the employed bus riders in the city are white. Eight percent identify as eitherAsian, American Indian, Pacific Islander, or biracial. These groups have been collapsed togetherinto one category, named non-Hispanic other to improve the regression analyses later in the report.Two percent of employed riders identify as Hispanics/Latinos. Employed bus riders havecompleted an average of 12.4 years of formal schooling, which is slightly more than a high schooleducation. Riders typically work more than one job. They work around 32 hours a week at theirprimary job, and for those with secondary jobs, there they work around 22 hours a week. Thehourly wage they receive at their primary job is just over 10. The average annual income ofemployed riders is 20,636.15, which places the average rider close to the poverty line. They livein households with 2-3 people, and there is usually less than 1 working automobile available to thehousehold. The amount of time employed riders in Winston-Salem dedicate to commuting to andfrom work is substantial. They spend over an hour getting to work and then another hour gettingback home. They dedicate around 12 hours a week to commuting to and from work, involving the6
bus. Riders in Winston-Salem take around 2 buses to get to work. The information discussed aboveis presented below in Table 1, along with other variables.Table 1: Descriptive Statistics for the Continuous VariablesResults of 2018 WSTA Bus Transit Survey: Descriptive Statistics for the Continuous VariablesMeanStand. Dev.N*CommutingTotal amount of time (minutes) it takes to get to work from home, when using the bus66.7934.53Total amount of time (minutes) it takes to get to home from work, when using the bus68.6033.895.311.11Days a week use the bus to commute to workHours a week commuting to and from work, involving the bus12.046.488.9311.62Time (minutes) it takes to get from last bus stop to work15.1317.15Length of time (years) using public transportation reguarly11.2211.161.960.7312.401.211.150.36Time (minutes) it takes to get to first bus stopNumber of buses taken to get to workEducationYears of educationWork InformationNumber of jobsHourly wage ( ) of primary job10.143.58Hourly wage ( ) of non-primary job(s)18.7449.86Annual income ( ), involving all jobs20636.1520302.60Hours a week of work at primary job32.5912.38Hours a week of work at non-primary job(s)22.0211.1834Hourly wage ( ) of better job offer that was turned down, due to the bus12.363.84106Hourly wage ( ) of promotion that was turned down, due to the bus13.124.6329Length of time (days) it took to find a new job83.75114.7344Hourly wage ( ) of the lost job, compared to the new job10.362.4744Hourly wage ( ) of the new job, compared to the lost job10.202.594414.677.1611534Foregone OpportunitiesNon-Standard TransportationCost ( ) of taking a taxi to workHousehold informationPeople living in household2.461.5441.7814.540.480.81Length of time (minutes) to get to the doctor, by bus47.9427.75Length of time to get to the doctor, if driving a car15.2010.16Satisfaction in the predictability of bus system to get riders to work on time (10 being Very Satisfied)6.462.76Riders' rating of their public transportation system overall (5 being Excellent)2.311.02Riders' belief that the bus system creates opportunities to achieve long term financial goals (10 being Most Likely)6.662.77AgeVehicle informationWorking automobiles owned by householdMedical AccessOpinions of Bus System*N 215, unless otherwise specifiedMore than half of employed bus riders in Winston-Salem work full-time and are not students.Many of them have had to make the hard decision of passing on better opportunities because theydid not align with the bus system’s routes and/or schedules. For example, approximately 50 percentof employed bus riders have turned down better job offers from other companies because thecurrent bus route did not take them close enough to the job. Twenty percent have lost jobs becausea bus route changed. Nearly 74 percent have been late to work because of transportation issues.Most face penalties for being tardy, whether that be a dock in pay (20 percent face this), ordisciplinary action (44 percent face this). Riding the bus also impacts other avenues of life beyondwork, such as shopping for groceries. Forty-seven percent of employed riders buy less raw meat,7
53 percent buy less canned foods, and 36 percent eat more fast food, like McDonalds, which theytribute to the bus system. The information discussed above is shown in Table 2 below.Table 2: PercentagesResults of 2018 WSTA Bus Transit Survey: PercentagesEducationBus riders with less than a high school education10.69%Bus riders with a high school education47.44%Bus riders with more than a high school education41.86%Work InformationBus riders that work full time and are not students55.81%Bus riders that work part time and are not students42.32%Bus riders that work and are full time students1.86%Foregone OpportunitiesBus riders that have turned down a better job offer from another company because of current bus routes49.30%Bus riders that have turned down a promotion at their current job because of the bus schedule13.48%Bus riders that have lost a job because of a bus route change20.46%Bus riders that have used a taxi (includuing Uber, Lyft, etc.) to get to work53.48%Bus riders that use the night bus service to get to work42.79%Penalty for being late to work, if relevant (all that apply):Bus riders that are docked pay20.30%Bus riders that face a loss in promotion5.58%Bus riders that face disciplinary action44.18%Bus riders that face demotion5.11%Bus riders that don't face any penalties38.60%Black/African American78.13%White11.16%Hispanic/Latino1.86%Other (Asian, American Indian, Pacific Islander, etc.)8.83%RaceGenderMale58.13%Female41.86%Vehicle informationBus riders with a valid drivers license28.83%Households that own the following 1.39%Bicycle1.39%No vehicles owned67.91%Cell phone accessBus riders that own cellphones88.37%Bus riders with smart phones, like an Iphone or an Android85.78%Bus riders that report bus transportation interfering with:New employment opportunity44.18%Promotion at place of employment17.20%Arriving to work on time73.95%Receiving medical attention20.93%Everyday tasks (grocery shopping, going to the bank)34.41%School/classes7.90%Health and NutritionBus riders that say riding the bus contributes to a healthier diet14.88%Bus riders that say riding the bus has no impact on diet64.65%Bus riders that say riding the bus contributes to an unhealthier diet20.46%Bus riders that say riding the bus means purchasing:Less fresh vegetables38.13%Less cans of food53.02%Less raw meat47.90%More dried foods, like cereal and pasta33.95%More snack foods39.06%More fast food, like McDonald's and Bojangles36.27%N 2158
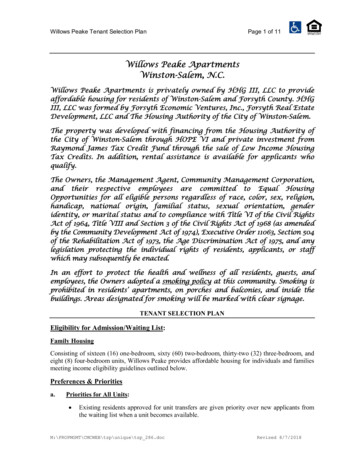
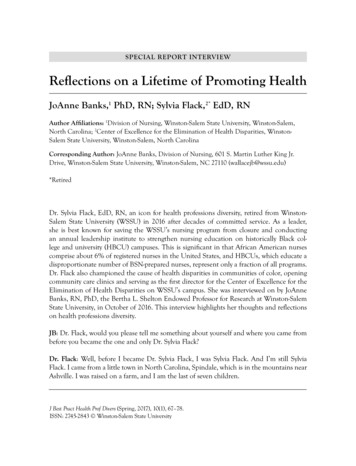
DATA EXPLORATION AND ULLUSTRATIONSThis subsection contains many charts and graphs in the hopes that they will illuminate detailsabout the lives of Winston-Salem’s employed bus riders that may have otherwise been overlooked.Variables have been sliced in various ways to underscore areas of economic interest, such asdifferences across gender and race. Hopefully, this will shed even more light into the employedriders’ lives. The more rigorous analyses and illustrations are saved for the Analyses section of thereport.Part I: Demographics, Labor, and CommutesAround 58 percent of employed bus riders in Winston-Salem are male and 42 percent are female(see Figure 1). This differs from the national average. Most public transportation users in theUnited States are women, approximately 55 percent (American Public Transportation Association,2017 Report). This is also true globally. Women are the primary users of public transportationaround the world (The World Bank).Percent (%)Figure 1Gender and Riding the Bus1009080706050403020100N 21558%42%MaleFemaleGenderFigure 2 shows that employed bus riders in Winston-Salem, on average, are in their early 40s.There are many riders less than 30 or older than 50. Thus, there is a noticeable age divide. In theUS, the age distribution of bus riders is more heavily weighted in the age range of highest economicactivity (25 – 54) (American Public Transportation Association, 2017 Report). The age ofemployed bus riders in Winston-Salem, however, does not follow this pattern.Figure 2Age Distribution of Bus Riders20N: 215Mean: 41.7Median: 43Min: 18Max: 69181613.5%Percent 018 - 2223 - 2728 - 3233 - 3738 - 4243 - 4748 - 5253 - 5758 - 62 62Age9
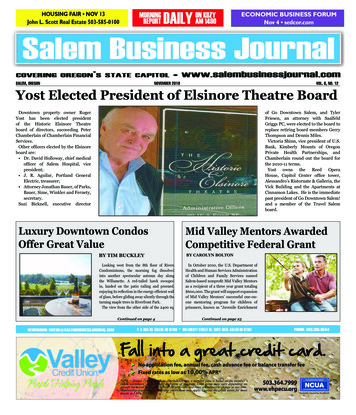
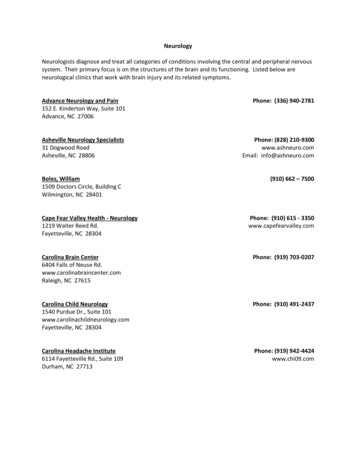
African Americans make up the largest employed group to use the public bus, with the nextlargest group being white (see Figure 3). In the US, African-Americans and whites nearly tie whenit comes to which group more often uses public buses (American Public TransportationAssociation, 2017 Report).Figure 3The four race categories shown in Figure 4 establish mutual exclusivity and help with theregression analyses shown later in the report. Some of the original race categories were eitherempty or very sparse, so these were collapsed into the group labeled Non-Hispanic Other. As isstill the case, most employed riders in Winston-Salem qualify as non-Hispanic black.Figure 4Most employed bus riders in Winston-Salem report having only a high school diploma, withnearly 11 percent having less than a high school education (see Figure 5). Around 42 percent reporthaving an education level higher than high school. Less than 2 percent report having a 4-yeardegree and less than 1 percent report having a graduate degree. These differ from the nationalaverages. In the US, for example, more than half of all bus riders report having at least anundergraduate college degree (American Public Transportation Association, 2017 Report). Thus,employed bus riders in Winston-Salem tend to be less educated.10
Percent (%)Figure 5605550454035302520151050Education Level Distribution of Bus Riders47.4%28.4%1.4%0.9%7th Grade8th Grade1.9%9.8%6.5%9th Grade 10th Grade 11th Grade 12th egreeCollegeGraduateSchoolEducation LevelWhen education achievement is examined in relation to completing high school, it reinforcesthe conclusion that most employed bus riders in Winston-Salem have only a high school education(see Figure 6). The next largest group reports having completed more than just a high schooleducation. Most riders in this group report having some college.Figure 6Nearly
Winston-Salem State University This study was initiated by the Center for the Study of Economic Mobility (CSEM) located on the campus of Winston-Salem State University, in Winston-Salem, NC. CSEM is a research collaborative formed to understand and address the causes of low economic mobility in Forsyth County.