Transcription
NORWALK2021 EQUITY PROFILEDataHaven
NORWALK2021 EQUITY PROFILECONTENTSExecutive onomy11Income & Wealth13Health16Civic Life & Community Cohesion24Environment & Sustainability27Notes29Compiled by DataHaven in August 2021.This report is designed to inform local-level e orts to improve community well-being and racial equity. This representsversion 1.0 of the DataHaven town equity profile, which DataHaven has published for all 169 towns and several regions ofConnecticut. Please contact DataHaven with suggestions for version 2.0 of this report.ctdatahaven.org
NORWALK 2021 EQUITY PROFILEEXECUTIVE SUMMARYThroughout most of the measures in this report, there are important di erences by race/ethnicityand neighborhood that reflect di erences in access to resources and other health-related socialneeds. Wherever possible, data will be presented with racial/ethnic breakdowns. Data for white,Black, Asian, and other populations represent non-Hispanic members of each racial group.Norwalk is a town of 91,184 residents, 51 percent of whom are people of color. The town’spopulation has increased by 6.5 percent since 2010.Of the town’s 34,187 households, 58 percent are homeowner households.Forty-two percent of Norwalk’s households are cost-burdened, meaning they spend at least30 percent of their total income on housing costs.Ninety percent of public high school seniors in the Norwalk School District graduated withinfour years in 2019.Among the town’s adults ages 25 and up, 43 percent have earned a bachelor’s degree orhigher.Norwalk is home to 43,536 jobs, with the largest share in the Health Care and Social Assistancesector.Norwalk’s average life expectancy is 82.6 years.Sixty-six percent of adults in Norwalk say they are in excellent or very good health.In 2020, 17 people in Norwalk died of drug overdoses.Eighty-four percent of adults in Norwalk are satisfied with their area, and 47 percent say theirlocal government is responsive to residents’ needs.In the 2020 presidential election, 74 percent of registered voters in Norwalk voted.Seventy-three percent of adults in Norwalk report having stores, banks, and other locations inwalking distance of their home, and 73 percent say there are safe sidewalks and crosswalks intheir neighborhood.DataHaven2
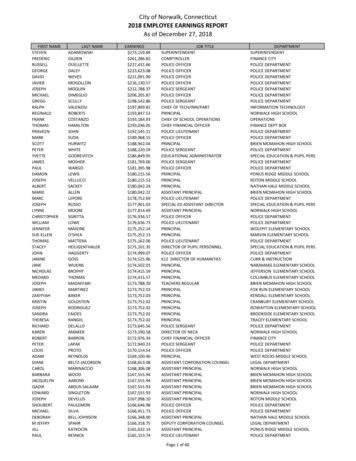
NORWALK 2021 EQUITY PROFILEOVERVIEWFor the purposes of this report, Norwalk will be compared to Connecticut as a whole, as well as to the towns in thesurrounding Public Use Microdata Area (PUMA) designated by the US Census Bureau with the number 0900103.PUMA 0900103 is made up of thefollowing towns (with 2020populations):FIGURE 1: STUDY AREADarien (21,499)Norwalk (91,184)Westport (27,141)TABLE 1: ABOUT THE AREAConnecticutPUMA0900103NorwalkTotal population3,605,944139,82491,184Total households1,370,74650,99834,187Homeownership rate66%67%58%Housing cost burden rate36%38%42%9%9%12% 78,444 109,671 85,769Poverty rate10%8%10%Life expectancy (years)80.383.382.6Adults w/o health insurance10%9%12%IndicatorAdults with less than a high schooldiplomaMedian household incomeDataHaven3
NORWALK 2021 EQUITY PROFILEDEMOGRAPHICSAs of 2020, the population of Norwalk is 91,184, including 18,502 children and 72,682 adults. Fi y-one percent of Norwalk’sresidents are people of color, compared to 37 percent of the residents statewide.TABLE 2: POPULATION BY RACE/ETHNICITY, 317%170,4595%6,404 6725%134 102 1%3,2934%ConnecticutAs Connecticut’s predominantly white Baby Boomers age, younger generations are driving the state’s increased racial andethnic diversity. Black and Latino populations in particular skew much younger than white populations.FIGURE 2: POPULATION BY RACE/ETHNICITY AND AGE GROUP, 2019DataHaven4
NORWALK 2021 EQUITY PROFILEAbout 24,923 residents of Norwalk, or 28 percent of the population, are foreign-born. The largest number of immigrantsliving in PUMA 0900103 were born in Mexico, followed by Colombia and India.Linguistic isolation is characterized as speaking English less than “very well.” People who struggle with English proficiencymay have di iculty in school, seeking health care, accessing social services, or finding work in a largely English-speakingcommunity. As of 2019, 14,099 Norwalk residents, or 17 percent of the population age 5 and older, were linguistically isolated.Latinos and Asian Americans are more likely to be linguistically isolated than other racial/ethnic groups.FIGURE 3: LINGUISTIC ISOLATION BY RACE/ETHNICITY, 2019DataHaven5
NORWALK 2021 EQUITY PROFILEPOPULATION CHANGE: 2020 CENSUSThe first set of data from the 2020 Census was released in August 2021, containing basic population counts by age andrace/ethnicity. Between 2010 and 2020, Connecticut’s population was nearly stagnant. During the same period, Norwalk grewby 5,581 people, a 6.5 percent increase. The number of white residents in Norwalk shrank by 7.1 percent, while the non-whitepopulation grew by 24 percent.TABLE 3: POPULATION AND POPULATION CHANGE BY AGE GROUP, centchangeAll ages3,574,0973,605,944 31,847 0.9%Children817,015736,717 80,298 9.8%2,757,0822,869,227 112,145 4.1%All ages132,726139,824 7,098 5.3%Children34,12232,531 1,591 4.7%Adults98,604107,293 8,689 8.8%All ages85,60391,184 5,581 6.5%Children18,87418,502 372 2.0%Adults66,72972,682 5,953 8.9%AreaAgeConnecticutAdultsPUMA 0900103NorwalkFIGURE 4: SHARE OF POPULATION BY RACE/ETHNICITY, 2010–2020DataHaven6
NORWALK 2021 EQUITY PROFILEHOUSINGNorwalk has 34,187 households, of which 58 percent are homeowner households. Of Norwalk’s 36,898 housing units, 52percent are single-family and 48 percent are multifamily, compared to PUMA 0900103, where 65 percent are single-familyand 35 percent are multifamily.Homeownership rates vary by race/ethnicity. Purchasing a home is more attainable for advantaged groups because theprocess of purchasing a home has a long history of racially discriminatory practices that continue to restrict access tohomeownership today. This challenge, coupled with municipal zoning dominated by single-family housing, results in defacto racial and economic segregation seen throughout Connecticut.TABLE 4: HOMEOWNERSHIP RATE BY RACE/ETHNICITY OF HEAD OF HOUSEHOLD, ticut66%76%39%34%58%40%PUMA AreaYounger adults are less likely than older adults to own their homes across several race/ethnicity groups. However, in mosttowns, younger white adults own their homes at rates comparable to or higher than older Black and Latino adults.FIGURE 5: HOMEOWNERSHIP RATES BY AGE AND RACE/ETHNICITY OF HEAD OF HOUSEHOLD, PUMA 0900103, 2019DataHaven7
NORWALK 2021 EQUITY PROFILEA household is cost-burdened when they spend 30 percent or more of their income on housing costs, and severely costburdened when they spend half or more of their income on housing costs. Housing costs continue to rise, due in part tomunicipal zoning measures that limit new construction to very few towns statewide. Meanwhile, wages have largelystagnated, especially among lower-income workers who are more likely to rent. As a result, cost-burden generally a ectsrenters more than homeowners, and has greater impact on Black and Latino householders. Among renter households inNorwalk, 47 percent are cost-burdened, compared to 36 percent of owner households.FIGURE 6: HOUSING COST-BURDEN RATES BY RACE/ETHNICITY, PUMA 0900103, 2019Household overcrowding is defined as having more than one occupant per room. Overcrowding may increase the spread ofillnesses among the household and can be associated with higher levels of stress. Increasing the availability of appropriatelysized a ordable units helps to alleviate overcrowding.TABLE 5: OVERCROWDED HOUSEHOLDS BY RACE/ETHNICITY OF HEAD OF HOUSEHOLD, 2019TotalWhiteBlackLatinoAsianNative reCountShareCountShareConnecticut25,5412%7,252 1%4,4373%10,7716%2,9546%1584%PUMA 09001031,4233%331 1%1533%78810%1345% 50N/ANorwalk1,3834%2911%1533%78811%1348% 50N/ADataHaven8
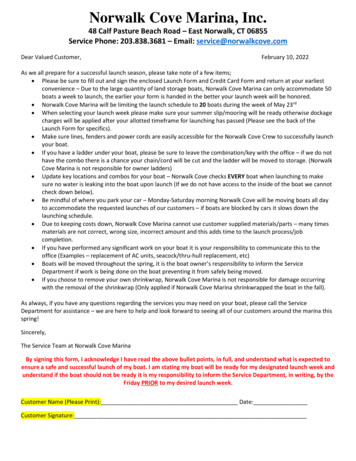
NORWALK 2021 EQUITY PROFILEEDUCATIONPublic school students in Norwalk areserved by the Norwalk School Districtfor pre-kindergarten through grade12. During the 2019–2020 school year,there were 11,716 students enrolled inthe Norwalk School District. Trackingstudent success measures isimportant since disparate academicand disciplinary outcomes areobserved as early as preschool andcan ultimately a ect a person’s longterm educational attainment andeconomic potential.FIGURE 7: PUBLIC K–12 STUDENT ENROLLMENT BY RACE/ETHNICITY PER100 STUDENTS, 2019–2020FIGURE 8: SELECTED ACADEMIC AND DISCIPLINARY OUTCOMES BY STUDENT RACE/ETHNICITY, 2018–2019DataHaven9
NORWALK 2021 EQUITY PROFILEAdults with high school diplomas or college degrees have more employment options and considerably higher potentialearnings, on average, than those who do not finish high school. In Norwalk, 12 percent of adults ages 25 and over, or 7,750people, lack a high school diploma; statewide, this value is 9 percent.FIGURE 9: EDUCATIONAL ATTAINMENT BY RACE/ETHNICITY, SHARE OF ADULTS AGES 25 AND UP, 2019DataHaven10
NORWALK 2021 EQUITY PROFILEECONOMYThere are 43,536 total jobs in Norwalk, with the largest share in the Health Care and Social Assistance sector. While thesenumbers are from 2019 and do not include economic outcomes related to the COVID-19 pandemic, they describe generallabor market strengths and average wages for the area.TABLE 6: JOBS AND WAGES IN NORWALK’S 5 LARGEST SECTORS, 2019ConnecticutSectorNorwalkTotal jobsAvg annual payTotal jobsAvg annual pay1,670,354 69,80643,536 97,072Health Care and Social Assistance271,014 54,8586,191 60,910Retail Trade175,532 35,8336,103 60,82695,868 111,0553,958 119,402129,012 23,1833,559 26,84431,466 120,4123,270 127,583All SectorsProfessional, Scientific, and Technical ServicesAccommodation and Food ServicesInformationIndividual earnings vary by race/ethnicity, sex, and other characteristics. These can be measured comparing the di erencesin average earnings between groups. White workers and men o en out-earn workers of color and women. These trends holdeven when controlling for educational attainment.FIGURE 10: MEDIAN INCOME BY RACE/ETHNICITY AND SEX FOR FULL-TIME WORKERS AGES 25 AND OVER WITHPOSITIVE INCOME, 2019DataHaven11
NORWALK 2021 EQUITY PROFILERates of unemployment also vary by race and ethnicity. Generally, workers of color are more likely to be unemployed due tofactors ranging from hiring practices to proximity to available jobs. Overall unemployment in Norwalk averaged 7 percent in2019.FIGURE 11: UNEMPLOYMENT RATE BY RACE/ETHNICITY, 2019DataHaven12
NORWALK 2021 EQUITY PROFILEINCOME & WEALTHThe median household income in Norwalk is 85,769, compared to 78,444 statewide. Norwalk’s median household income isthe lowest of the towns in PUMA 0900103. Racial disparities in outcomes related to education, housing, and wages result indisparate household-level incomes and overall wealth. Racial disparities in outcomes related to education, employment, andwages result in disparate household-level incomes and overall wealth. Households led by Black or Latino adults generallyaverage lower incomes than white households.FIGURE 12: MEDIAN HOUSEHOLD INCOME BY RACE/ETHNICITY OF HEAD OF HOUSEHOLD, 2019DataHaven13
NORWALK 2021 EQUITY PROFILEThe Supplemental Nutritional Assistance Program (SNAP, or food stamps) is a program available to very low-incomehouseholds earning less than 130 percent of the federal poverty guideline ( 25,750 for a family of four in 2019). Throughoutthe state, poverty and SNAP utilization rates are higher among Black and Latino households than white households.TABLE 7: SELECTED HOUSEHOLD ECONOMIC INDICATORS BY RACE/ETHNICITY OF HEAD OF HOUSEHOLD, harePopulation living below poverty 014%4,53817%2593% 50N/ANorwalk8,89310%2,5956%1,75014%4,38018%1533% 50N/AHouseholds receiving food 1,22616%1164% 50N/ANorwalk2,6888%6493%80316%1,16617%614% 50N/AAccess to a personal vehicle may also be considered a measure of wealth since reliable transportation plays a significant rolein job access and quality of life. Vehicle access reduces the time a family may spend running errands or traveling toappointments, school, or work.TABLE 8: HOUSEHOLDS WITH NO VEHICLE AT HOME BY RACE/ETHNICITY OF HEAD OF HOUSEHOLD,2019TotalAreaWhiteBlackLatinoOther A %N/AN/AN/AN/AN/AN/AN/AN/AConnecticutDataHaven14
NORWALK 2021 EQUITY PROFILEOver the past 40 years, neighborhood income inequality has grown statewide as the share of the population living in wealthyor poor neighborhoods has increased and the population in middle income areas declined in a process known as “economicsorting,” which o en leads to further disparities in access to economic opportunity, healthy environments, and municipalresources.FIGURE 13: DISTRIBUTION OF POPULATION BY NEIGHBORHOOD INCOME LEVEL, PUMA 0900103, 1980–2019DataHaven15
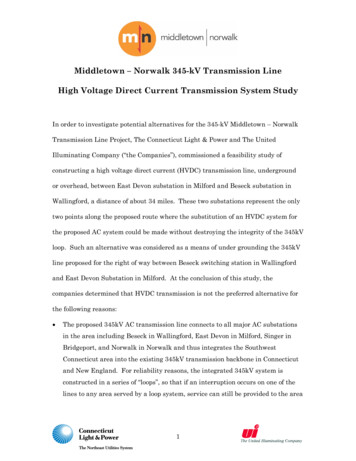
NORWALK 2021 EQUITY PROFILEHEALTHThe socioeconomic disparities described above tend to correlate with health outcomes. Factors such as stable housing,employment, literacy and linguistic fluency, environmental hazards, and transportation all impact access to care, physicaland mental health outcomes, and overall quality of life. Income and employment status o en drive di erences in access tohealthcare, the likelihood of getting preventive screenings as recommended, the a ordability of life-saving medicines, andthe ability to purchase other goods and services, including high-quality housing and nutritious food.Life expectancy is a good proxy foroverall health and well-being since itis the culmination of so many othersocial and health factors. Theaverage life expectancy in Norwalk is82.6 years, compared to 83.3 yearsacross PUMA 0900103, and 80.3 yearsstatewide.FIGURE 14: LIFE EXPECTANCY, PUMA 0900103 BY CENSUS TRACT, 2015Health-related challenges begin with access to care. Due to di erences in workplace benefits, income, and eligibility factors,Black and especially Latino people are less likely to have health insurance than white people.FIGURE 15: UNINSURED RATE AMONG ADULTS AGES 19–64 BY RACE/ETHNICITY, 2019DataHaven16
NORWALK 2021 EQUITY PROFILEPreventive care can help counteract economic disadvantages, as a person’s health can be improved by addressing riskfactors like hypertension and chronic stress early. Lack of a ordable, accessible, and consistent medical care can lead toresidents relying on expensive emergency room visits later on. Overall, 77 percent of the adults in Norwalk had an annualcheckup as of 2018, and 72 percent had a dental visit in the past year.FIGURE 16: PREVENTIVE CARE MEASURES, SHARE OF ADULTS BY CENSUS TRACT, PUMA 0900103Throughout the state, people of color face greater rates and earlier onset of many chronic diseases and risk factors,particularly those that are linked to socioeconomic status and access to resources. For example, diabetes is much morecommon among older adults than younger ones, yet middle-aged Black adults in Connecticut have higher diabetes ratesthan white seniors.FIGURE 17: SELECTED HEALTH RISK FACTORS, SHARE OF ADULTS, 2015–2018DataHaven17
NORWALK 2021 EQUITY PROFILEFIGURE 18: SELECTED HEALTH INDICATORS BY AGE AND RACE/ETHNICITY, SHARE OF ADULTS, NORWALK, 2015–2018FIGURE 19: CHRONIC DISEASE PREVALENCE, SHARE OF ADULTS BY CENSUS TRACT, PUMA 0900103DataHaven18
NORWALK 2021 EQUITY PROFILEMental health issues like depression and anxiety can be linked to social determinants like income, employment, andenvironment, and can pose risks of physical health problems as well, including by complicating a person’s ability to keep upother aspects of their health care. People of color are slightly more likely to report feeling mostly or completely anxious andbeing bothered by feeling depressed or hopeless. Overall, 13 percent of Norwalk adults report experiencing anxiety regularlyand 6 percent report being bothered by depression.TABLE 9: SELECTED MENTAL HEALTH INDICATORS, SHARE OF ADULTS, nConnecticut12%11%15%19%14%15%PUMA necticut9%8%10%14%8%12%PUMA iencing anxietyBothered by depressionLike other states, Connecticut has seen a rise in drug overdose deaths in the last several years. In 2020, Connecticut saw anaverage of 113 overdose deaths per month, up from 60 in 2015. White residents long comprised the bulk of these deaths, butas overall overdose death rates have increased, an increasing share of those deaths have been people of color.FIGURE 20: AGE-ADJUSTED SEMI-ANNUAL RATES OF DRUG OVERDOSE DEATHS PER 100,000 RESIDENTS BYRACE/ETHNICITY, 2015–2020DataHaven19
NORWALK 2021 EQUITY PROFILEThe introduction and spread of fentanyl in drugs—both with and without users’ knowledge—is thought to have contributedto this steep rise in overdoses. In 2015 and 2016, 41 percent of the drug overdose deaths in Norwalk involved fentanyl; in 2019and 2020, this share was 74 percent.FIGURE 21: SHARE OF DRUG OVERDOSE DEATHS INVOLVING FENTANYL, 2015–2020Sexually transmitted infections (STIs) can have long-term implications for health, including reproductive health problemsand certain cancers, and can increase the risk of acquiring and transmitting diseases such as HIV and hepatitis C. Followingnationwide trends, Connecticut has seen increases in the rates of STIs like chlamydia and gonorrhea over the past twodecades. Between 2016 and 2018, Fairfield County had annual average case rates of 366 new cases of chlamydia per 100,000residents, 72 cases of gonorrhea per 100,000, and 3.2 cases of syphilis per 100,000.FIGURE 22: ANNUALIZED AVERAGE RATES OF NEW CASES OF SELECTED SEXUALLY TRANSMITTED INFECTIONS PER100,000 RESIDENTS, 2001–2003 THROUGH 2016–2018DataHaven20
NORWALK 2021 EQUITY PROFILELike many other diseases, Connecticut’s Black and Latino residents face a higher burden of HIV rates. Statewide between 2016and 2018, Black residents ages 13 and up were more than 10 times more likely to be diagnosed with HIV than white residents.FIGURE 23: ANNUALIZED AVERAGE RATE OF NEW HIV DIAGNOSES PER 100,000 RESIDENTS AGES 13 AND OVER, 2016–2018DataHaven21
NORWALK 2021 EQUITY PROFILEBirth outcomes o en reflect health inequities for parents giving birth, and those outcomes can a ect a child throughouttheir life. O en, parents of color have more complications related to birth and pregnancy than white parents. Complicationsduring pregnancy or childbirth also contribute to elevated mortality among parents giving birth.TABLE 10: SELECTED BIRTH OUTCOMES BY RACE/ETHNICITY OF PARENT GIVING BIRTH, %2.9%5.1%3.5%PUMA .2%6.6%8.7%PUMA 3.7%6.6%N/A6.4%N/AAreaLate or no prenatal careLow birthweightInfant mortality (per 1k live births)Connecticut4.63.19.55.0N/AN/AN/APUMA N/AN/AFIGURE 24: MATERNAL MORTALITY RATE PER 100K BIRTHS, CONNECTICUT, 2013–2017DataHaven22
NORWALK 2021 EQUITY PROFILEChildren under 7 years old are monitored annually for potential lead poisoning, based on having blood-lead levels in excessof the state’s accepted threshold. Between 2013 and 2017, 1.7 percent of children tested in Norwalk were found to haveelevated lead levels. Children living in homes built before 1960 are at a higher risk of potential lead poisoning due to the morewidespread use of lead-based paints in older homes. Black and Latino households are slightly more likely to live in structuresbuilt before 1960.TABLE 11: HOUSEHOLDS LIVING IN STRUCTURES BUILT BEFORE 1960 BY RACE/ETHNICITY OF HEAD OF HOUSEHOLD,2019TotalAreaWhiteBlackLatinoOther %PUMA DataHaven23
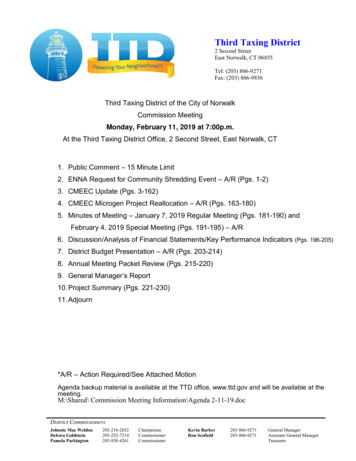
NORWALK 2021 EQUITY PROFILECIVIC LIFE & COMMUNITY COHESIONBeyond individual health, severalmeasures from the DataHavenCommunity Wellbeing Survey showhow local adults feel about the healthof their neighborhoods. High qualityof life and community cohesion canpositively impact resident well-beingthrough the availability of resources,sense of safety, and participation incivic life. For example, adults who seethe availability of role models in theircommunity may enroll their childrenin extracurricular activities thatbenefit them educationally andsocially; residents who know and trusttheir neighbors may find greatersocial support. Overall, 84 percent ofNorwalk adults reported beingsatisfied with the area where they live.DataHavenFIGURE 25: RESIDENTS’ RATINGS OF COMMUNITY COHESION MEASURES,SHARE OF ADULTS, 2015–201824
NORWALK 2021 EQUITY PROFILECrime rates per 100,000 residents are based on reports to law enforcement of violent force against persons, as well aso enses involving property. Not all crimes involve residents of the areas where the crimes occur, which is important toconsider when evaluating crime rates in areas or towns with more commercial activity. Crime patterns can also varydramatically by neighborhood. Crime can impact the social and economic well-being of communities, including throughnegative health e ects.FIGURE 26: PART I CRIME RATES PER 100,000 RESIDENTS BY TOWN / JURISDICTION, 2019A lack of trust in and engagement with local government and experiences of unfair treatment by authorities can impaircommunity well-being and cohesion. Forty-seven percent of Norwalk adults feel their local government is responsive toresidents’ needs, compared to 51 percent statewide.TABLE 12: RESIDENTS’ RATINGS OF LOCAL GOVERNMENT, SHARE OF ADULTS, 2015–2018AreaConnecticutPUMA 0900103NorwalkDataHavenUnfairly stopped by policeLocal govt is responsiveHave some influence over local govt11%51%67%8%56%67%10%47%65%25
NORWALK 2021 EQUITY PROFILEDuring the 2020 presidential election, 74 percent of Norwalk registered voters cast ballots, compared to 80 percent statewide,and to 78 percent in the 2016 presidential election.FIGURE 27: REGISTERED VOTER TURNOUT, 2018–2020DataHaven26
NORWALK 2021 EQUITY PROFILEENVIRONMENT & SUSTAINABILITYMany environmental factors—from access to outdoor resources to tree canopy to exposure to pollutants—can have directimpacts on residents’ health and quality of life. Environmental justice is the idea that these factors of built and naturalenvironments follow familiar patterns of socioeconomic disparities and segregation. The federal Environmental ProtectionAgency (EPA) ranks small areas throughout the US on their risks of exposure to a variety of pollutants and hazards, scaled toaccount for the historically disparate impact of these hazards on people of color and lower-income people.FIGURE 28: EPA ENVIRONMENTAL JUSTICE INDEX BY BLOCK GROUP, PUMA 0900103DataHaven27
NORWALK 2021 EQUITY PROFILEHigh-quality built environment resources, such as recreational facilities and safe sidewalks, help keep residents active andbring communities together. Walkable neighborhoods may also encourage decreased reliance on cars. ThroughoutConnecticut, Black and Latino residents are largely concentrated in denser urban areas which tend to o er greaterwalkability. Of adults in Norwalk, 73 percent report having stores, banks, and other locations they need in walking distance,higher than the share of adults statewide.FIGURE 29: RESIDENTS’ RATINGS OF LOCAL WALKABILITY MEASURES BY RACE/ETHNICITY, SHARE OF ADULTS, 2015–2018DataHaven28
NORWALK 2021 EQUITY PROFILENOTESFigure 1. Study area. Map tiles by Stamen Design, under CC BY 3.0. Data by OpenStreetMap, under ODbL.Table 1. About the area. DataHaven analysis (2021) of US Census Bureau American Community Survey 2019 5-yearestimates. Available at https://data.census.gov; US Census Bureau 2020 Decennial Census P.L. 94-171 Redistricting Data.Available at l‑census/about/rdo.html; PLACES Project. Centers forDisease Control and Prevention. Available at https://www.cdc.gov/places; and National Center for Health Statistics. U.S.Small-Area Life Expectancy Estimates Project (USALEEP): Life Expectancy Estimates Files, 2010–2015. National Center forHealth Statistics. 2018. Available at Table 2. Population by race/ethnicity, 2020. US Census Bureau 2020 Decennial Census P.L. 94-171 Redistricting Data.Figure 2. Population by race/ethnicity and age group, 2019. DataHaven analysis (2021) of US Census Bureau AmericanCommunity Survey 2019 5-year estimates.Figure 3. Linguistic isolation by race/ethnicity, 2019. DataHaven analysis (2021) of US Census Bureau AmericanCommunity Survey 2019 5-year estimates.Table 3. Population and population change by age group, 2010–2020. US Census Bureau 2010 & 2020 Decennial CensusP.L. 94-171 Redistricting Data.Figure 4. Share of population by race/ethnicity, 2010–2020. US Census Bureau 2010 & 2020 Decennial Census P.L. 94-171Redistricting Data.Table 4. Homeownership rate by race/ethnicity of head of household, 2019. DataHaven analysis (2021) of US CensusBureau American Community Survey 2019 5-year estimates.Figure 5. Homeownership rates by age and race/ethnicity of head of household, PUMA 0900103, 2019. DataHavenanalysis (2021) of US Census Bureau American Community Survey 2019 5-year public use microdata sample (PUMS) data,accessed via IPUMS. Steven Ruggles, Sarah Flood, Sophia Foster, Ronald Goeken, Jose Pacas, Megan Schouweiler andMatthew Sobek. IPUMS USA: Version 11.0 [dataset]. Minneapolis, MN: IPUMS, 2021. https://doi.org/10.18128/D010.V11.0Figure 6. Housing cost-burden rates by race/ethnicity, PUMA 0900103, 2019. DataHaven analysis (2021) of Ruggles, etal. (2019).Table 5. Overcrowded households by race/ethnicity of head of household, 2019. DataHaven analysis (2021) of US CensusBureau American Community Survey 2019 5-year estimates.Figure 7. Public K–12 student enrollment by race/ethnicity per 100 students, 2019–2020. DataHaven analysis (2021) of2019–2020 school year enrollment data from the Connecticut State Department of Education, accessed via EdSight at http://edsight.ct.gov At the school district level, not all groups may be shown due to CTSDE data suppression rules for smallenrollment counts, even though they may represent more than 1% of the school district population.Figure 8. Selected academic and disciplinary outcomes by student race/ethnicity, 2018–2019. DataHaven analysis(2021) of 2018–2019 school year testing (8th grade English/language arts), discipline, and four-year graduation data from theConnecticut State Department of Education, accessed via EdSight. Because students can be suspended more than once in aschool year, the suspension rate is given as the number of reported suspensions per 1,000 enrolled students rather than apercentage.Figure 9. Educational attainment by race/ethnicity, share of adults ages 25 and up, 2019. DataHaven analysis (2021) ofUS Census Bureau American Community Survey 2019 5-year estimates.Table 6. Jobs and wages in Norwalk’s 5 largest sectors, 2019. DataHaven analysis (2021) of annual employment datafrom the Connecticut Department of Labor. Note that in some cases, especially for smaller towns, data have beensuppressed. Available at https://www1.ctdol.state.ct.us/lmi/202/202 annualaverage.aspDataHaven29
NORWALK 2021 EQUITY PROFILEFigure 10. Median income by race/ethnicity and sex for full-time workers ages 25 and over with positive income,2019. DataHaven analysis (2021) of Ruggles, et al. (2019).Figure 11. Unemployment rate by race/ethnicity, 2019. DataHaven analysis (2021) of US Census Bureau AmericanCommunity Survey 2019 5-year estimates.Figure 12. Median household income by race/ethnicity of head of household, 2019. DataHaven analysis (2021) of USCensus Bureau American Community Survey 2019 5-year estimates.Table 7. Selected household economic indicators by race/ethnicity of head of household, 2019. DataHaven analysis(2021) of US Census Bureau American Community Survey 2019 5-year estimates.Table 8. Households with no vehicle at home by race/ethnicity of head of household, 2019. DataHaven analysis (2021)of US Census Bureau American Community Survey 2019 5-year estimates.Figure 13. Distribution of population by neighborhood income level, PUMA 0900103, 1980–2019. DataHaven analysis(2021) of household income and population by Census tract. Values for 1980–2000 are from the US Census Bureau DecennialCensus, provided by the Neighborhood Change Database (NCDB) created by GeoLytics and the Urban Institute with supportfrom the Rockefeller Foundation (2012). 2019 values are calculated from US Census Bureau American Community Survey2019 5-year estimates.Figure 14. Life expectancy, PUMA 0900103 by Census tract, 2015. Data from National Center for Health Statistics. U.S.Small-Area Life Expectancy Estimates Project (USALEEP): Life Expectancy Estimates File
Norwalk's average life expectancy is 82.6 years. Sixty-six percent of adults in Norwalk say they are in excellent or very good health. In 2020, 17 people in Norwalk died of drug overdoses. Eighty-four percent of adults in Norwalk are satisfied with their area, and 47 percent say their local government is responsive to residents' needs.