Transcription
Minneap lisliving well2010 Sustainability Report
Minneap lisliving wellPublished June 2010Printed on recycled paper100% post-consumer fibers, FSCV2Minneapolis City CoordinatorSustainability350 S. Fifth St. – Room 301MMinneapolis, MN 55415612-673-2027For more information: call 311or e-mail sustainability@ci.minneapolis.mn.usor visit www.ci.minneapolis.mn.us/sustainability
Minneap lisliving wellExecutive SummaryMinneap lis a healthy life5Healthy Infants6Teen Pregnancy7HIV and Gonorrhea8Healthy Weight9Asthma10Lead Poisoning11Minneap lis greenprintClimate Change12Renewable Energy13Air Quality14Waste Reduction and Recycling15Biking16Downtown Transportation Alternatives17Airport Noise18Tree Canopy19Stormwater20Healthy Lakes21Green Jobs22Local Food23Minneap lis a vital communityAffordable Housing24Homelessness25Brownfield Sites26Violent Crimes27Community Engagement28Arts and the Economy29Graduation Rate30Employment and Poverty31www.ci.minneapolis.mn.us/sustainability
English: Attention. If you want help translating this information, call 311.Spanish: Atención. Si desea recibir asistencia gratuita para traducir esta información, llame 612-673-2700.Somali: Ogow. Haddii aad dooneyso in lagaa kaalmeeyo tarjamadda macluumaadkani oo lacag la’ aan wac 612-673-3500.Hmong: Ceeb toom. Yog koj xav tau kev pab txhais cov xov no rau koj dawb, hu 612-673-2800.TTY: 612-673-2157
5ExecutiveSummaryMinneap lisliving wellExecutive SummaryIn its fifth year of publishing the Living Well report, the City of Minneapolis continues upgrading its businesspractices in ways that will systematically improve the city’s ecological, economic and social systems. Aligningdecision-making with principles of sustainability increases innovation and return on investment, reduces the risksassociated with increasing pollution levels and environmental degradation, and protects the planet and humanhealth.The report is divided into three sections and highlights include:A Healthy Life Meeting the teen pregnancy target Decreasing the asthma hospitalization rate by 10 percent from a year ago, with the greatestimprovement among children up to age 4 Inspecting all the homes of children with lead poisoning for the first time in Minneapolis history,and a decrease in the number of kids found to have lead poisoningGreenprint Meeting the target for no combined sewer overflows for the third year in a row Expanding a pilot residential organics composting program to a second neighborhood Engaging more than 100 residents in the Homegrown Minneapolis initiative, focused on expandingefforts to grow, sell, distribute and consume more fresh, sustainably produced and locally grown foods Completing the downtown Marquette and Second avenues transit project providing side-by-sidebus-only lanes for less idling of buses in downtown, decreased stormwater runoff, more efficientlighting and new treesA Vital Community Nearing our 2014 target for brownfield sites by cleaning up 97 sites and 266 acres since 2004 Meeting the homicide reduction target for the second year in a rowA number of important efforts are already under way for 2010, including the first map of the city’s tree canopyusing satellite imagery; more resident investment in solar power; a new hydropower plant at St. Anthony Falls; a600 kW solar installation on the Convention Center roof; a community gardens pilot program; a public bike sharingsystem; improvements to food and physical activity policies and practices in child care programs, schools andneighborhoods; and an expansion of the City’s efforts to address youth violence by increasing neighborhood collaboration and partnerships with community stakeholders.Despite these advances, the city also continues to face a number of challenges that will require more efforts toresolve. These include the number of families and individuals staying in shelters increasing for the third year in arow, a higher first quarter homicide rate, 14 percent of Minneapolis residents living in poverty and 36 percent ofthose residents are people of color, and 10 percent of employed residents living in poverty.Thank you to all those who contributed to this report including the City’s Citizen Environmental Advisory Committee and Environmental Coordinating Team, the Minneapolis Park and Recreation Board staff, City, HennepinCounty and Minneapolis Public Schools staff, Minneapolis Mayor R.T. Rybak, the Minneapolis City Council, businesses, nonprofits, and residents working with us toward a sustainable city.Learn more about the Minneapolis sustainability initiative at the City and join us in achieving its vision.Please visit www.ci.minneapolis.mn.us/sustainability.
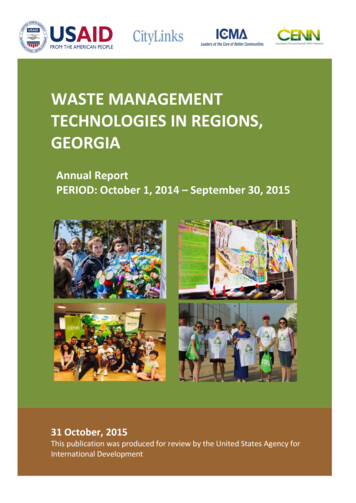
HealthyInfantsMinneap lis a healthy lifeReduce Infant Mortality and Low Birth WeightsIn the U.S., the five leading causes of infant deathare birth defects, disorders related to low birthweight (less than 5.5 pounds), sudden infant deathsyndrome (SIDS), pregnancy complications andaccidental injuries. Infants born too small and/or toosoon are at a higher risk of death and disability. Preterm birth (before 37 weeks) is the primary cause oflow birth weight. Infants born to teenage mothershave the highest rate of mortality. Infant mortalityis death from any cause during the first year of ababy’s life.Target Reduce infant mortality rates overall and withineach racial/ethnic subgroup to 4.5 deaths per1,000 live births by 2010. Reduce the proportion of infants born at low birthweight to 5 percent by 2010.Trend AnalysisThe infant mortality rate overall – the number ofdeaths per 1,000 live births – continues to rise inMinneapolis. The average rate from 2006 to 2008was 7.9, up from 6.8 for the previous three-yearperiod. The total number of deaths from 2006 to2008 was 149 compared with 113 from 2003 to2005. While the target was met for the Asian/Pacific Islander populations, infant mortalityincreased in the black, Hispanic and American Indian populations and stayed the same for the whitepopulation. From 2005 to 2007, the infant mortality rate was higher among U.S.-born blacks (12.7)than among foreign-born blacks (8.1). There were6,232 births to Minneapolis residents in 2008.The percentage of Minneapolis infants born withlow birth weight was 7.6 percent in 2008, adecrease from 7.8 percent in 2007. The AmericanIndian population met the target, the first population group to do so. Low birth weight remainshighest within the black population.Recent City and Community ActivitiesInfant mortality rates among Minneapolis residents1 Screened 758 pregnant women in communityclinics and provided case management servicesto 386 through the Twin Cities Healthy StartProgram.per 1,000 live births in three-year rolling average rates1815Black129American IndianMinneapolis6HispanicWhite2010 target302002-04Asian/Pacific Islander2003-052004-062005-072006-08Source: Minnesota Department of HealthLow-birth-weight babies born to Minneapolis residents112 %Black108MinneapolisHispanicAsian/Pacific IslanderWhite62010 targetAmerican Indian4 Conducted 6,212 home visits with 638 pregnant or parenting teens and 484 children of teenparents through the Minnesota Visiting NurseAgency. www.mvna.org Conducted 2,115 home visits with 325 pregnantwomen and provided community-based prenatalclasses to 195 women through Way to Grow.www.mplswaytogrow.org Provided more than 1,110 people in AfricanAmerican and American Indian communitieswith information on healthy birth outcomes andsafe sleep environments for infants. Developed an action plan to respond to theresults of focus groups with African-Americanand American Indian women on prenatal careand alcohol and drug use during pregnancy.Web Links and ResourcesMinneapolis Department of Health and FamilySupport: Twin Cities Healthy sp202004 Provided 63 families in need with portable cribsfor their infants.U.S. Department of Health www.healthierus.govCenters for Disease Control and Prevention2005200620072008Source: Minnesota Department of Health1 Race/ethnicity categories are mutually exclusivewww.cdc.govMinnesota SIDS Centerwww.childrensmn.org/services/SIDsMinnesota March of Dimeswww.marchofdimes.com/minnesota6
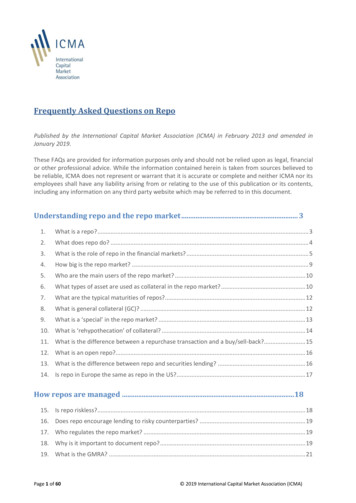
TeenPregnancyMinneap lis a healthy life7Reduce Teen PregnancyTeenage childbearing can create challenges for themother and her children. Teen mothers are at a higher risk for premature birth, low birth weight babiesand ongoing difficulties such as long-term poverty,lower levels of education and poorer job prospects.Children born to teen parents are at a higher risk forabuse, neglect and poor school performance.Target Reduce the pregnancy rate among 15- to 17-yearolds to 46 pregnancies per 1,000 by 2010.Trend AnalysisThe target for teen pregnancy was met in 2008.There were 271 teen pregnancies reported. Theteen pregnancy rate1,2 among 15- to 17-year-oldsdecreased from 49 to 44 pregnancies, surpassing the target of 46 pregnancies per 1,000. Teenpregnancy rates for all racial groups remainedsteady or declined except for whites, for whom therate increased. The rate for the Hispanic populationdecreased the most from 2007 to 2008, from 119.1to 83.2 pregnancies per 1,000 girls.Despite the overall decline in teen pregnancies,much work remains to be done to address thehigher pregnancy rates for Hispanic, black andAmerican Indian teens compared with other racial/ethnic groups.1 The pregnancy rate includes live births, abortionsand fetal deaths.2 Pregnancy rate calculations use population countsfrom the 2000 U.S. Census.Recent City and Community ActivitiesTeen pregnancies in Minneapolis3 Provided health services for 2,120 studentsthrough clinics in six public high schools.per 1,000 teenagers ages 15 to 125100Hispanic75BlackAmerican Indian502010 targetMinneapolisAsian/Pacific Islander25White020042005200620072008Source: Minnesota Department of Health3 Race/ethnicity categories are mutually exclusive Partnered with the Minnesota Organization onAdolescent Pregnancy, Prevention and Parentingand Minneapolis Public Schools (MPS) to revisethe MPS health curriculum for grades K-12. MPSstaff, board members and community agencies were trained on science-based approachesfor preventing teen pregnancies and practicalstrategies for handling community controversy.healthphyed.mpls.k12.mn.us/health core content.html Partnered with the University of Minnesota,Southside Community Health Center and SouthHigh School to launch a teen action group insouth Minneapolis that develops community approaches for addressing teen pregnancy. Awarded 168,000 in Community DevelopmentBlock Grant funds to community-based agenciesto provide teen pregnancy prevention educationand services to approximately 1,000 teens. Provided training and technical assistance toteachers at Na-Way-Ee Center School and CityInc. on science-based comprehensive sexualityeducation curricula. Partnered with Minneapolis Public SchoolsTeenage Pregnant and Parenting program andMinnesota Visiting Nurses Association (MVNA)to offer public health home visits, vocational,educational and support services to pregnant andparenting teens and their infants. MVNA provided 6,212 visits to 638 teens and their infants.Web Links and ResourcesTeen health information www.birdsandbees.orgNational Institutes of .html
HIV andGonorrheaMinneap lis a healthy lifeReduce the Rates of HIV and GonorrheaHIV (the virus that causes AIDS) and gonorrheahave immense consequences for public health andthe economy, and they have a higher prevalence inMinneapolis than in other areas in Minnesota.Comprehensive sex education and prevention areeffective in reducing the spread of disease. Aggressive screening of those at risk is also necessary, because a person can be infectious with these sexuallytransmitted infections before symptoms develop.Target Reduce the rate of new HIV cases to 21 per100,000 people by 2010. Reduce the rate of new gonorrhea cases to161 per 100,000 people by 2010.8Trend AnalysisIn 2008, 142 new cases of HIV were reported inMinneapolis. The three-year rolling average ratewas 34 cases per 100,000 people,1 an 8-percentincrease. The rate rose among all populationsexcept among the Asian/Pacific Islander population, whose rate remained stable and again metthe target.2 Most HIV transmission continues to beamong men who have sex with men, demonstratingthe continued need for prevention and screeningamong this population.In 2008, 1,011 total gonorrhea cases – 264 casesper 100,000 people – were reported in Minneapolis. The rates for the Asian-Pacific Islanderand white populations met the target, black andAmerican Indian populations saw decreases andthe Hispanic population stayed at the same level.3Since peaking at 314 cases per 100,000 people in2005, the overall rate has now returned to 2004levels.Recent City and Community ActivitiesNew cases of HIV1,2,4 in Minneapolisper 100,000 people1008060BlackHispanicAmerican Indian40MinneapolisWhite2010 target 2002002-04Asian/Pacific Islander2003-052004-062005-072006-08Source: Minnesota Department of Health Provided sexually transmitted disease (STD) andHIV prevention education to 2,396 young malesin underserved areas by assuring the continuationof the Seen on da Streets project with an allocation of 200,000 in state public health funds in2009 and .asp Tested uninsured people for STDs and HIVthrough Neighborhood Health Care Networkclinics. Provided 2,215 family planning visits, 742other reproductive visits, and 2,136 sexuallytransmitted infection tests through City-fundedschool-based aspGonorrhea cases in Minneapolis3,4Web Links and Resourcesper 100,000 people1,2001,000Black800Some of the sites below contain explicit information about prevention and transmission of sexually transmitted diseases and are not appropriatefor all viewers.Minnesota AIDS Projectwww.mnaidsproject.orgMinnesota Department of Healthsexually transmitted diseases statistics600400MinneapolisAmerican IndianHispanic2002010 targetWhiteAsian/Pacific vs/idepc/dtopics/stds/stdstatistics.htmlRed Door Clinicwww.reddoorclinic.org2008Source: Minnesota Department of Health1 Minneapolis has a small number of HIV cases, so rolling averages from 2002 to 2008 are presented to interpret trends in HIV rates.2 These rates were calculated based on 2000 U.S. Census population counts. Because the population may have increased since 2000, the reported rates may be higher than the actual rates of thedisease.3 These rates represent identified cases. While people with symptoms typically seek treatment, screening programs targeting high-risk individuals without symptoms have been implemented in recentyears. This increases the rate of reported disease, so how much a reported increase represents an actual increase in disease incidence is unknown.4 Race/ethnicity categories are mutually exclusive.
Minneap lis a healthy lifeHealthyWeightIncrease the Proportionof Adults at a Healthy WeightObesity is a leading cause of preventable illnessand death. Weight reflects individual health and thegeneral health of a community. People at a healthyweight1 are less likely to suffer from chronic conditions such as diabetes, high blood pressure, heartdisease and high cholesterol. Women at a healthyweight in their childbearing years have fewer problems than overweight women with fertility, pregnancy and birth. Diet, accessibility to affordable,healthy food, exercise and opportunities for physicalactivity all affect healthy weight.TargetIncrease the proportion of Minneapolis adults whoare at a healthy weight to 52 percent by 2010.9Trend AnalysisThe percentage of Minneapolis adults at a healthyweight in 2008 was 49 percent,2 not significantlydifferent than the 2006 measure. U.S. and Hennepin County surveys have found that black, American Indian and Hispanic adults are more likely tobe overweight or obese than Asian or white adults.Adults with lower levels of education and lowerincomes are at a greater risk of obesity.1 Assessment of healthy weight for adults is based on bodymass index (BMI). BMI is a number calculated from aperson’s weight and height and is a reliable indicator ofbody fat for most people. People are considered to be at ahealthy weight if they have a BMI of less than 25.2 Behavioral Risk Factor Surveillance SurveyRecent City and Community ActivitiesMinneapolis adult residents at a healthy weight Assessed convenience stores in north Minneapolis to determine availability of fresh produce andowners’ interest and needs related to improvingavailability.100 %80602010 target40www.ci.minneapolis.mn.us/dhfs/ship.asp200 Launched the Healthy Housing, Healthy Communities project to improve the food environment and increase opportunities for physicalactivity around eight low-income housing units.200620072008Source: Behavioral Risk Factor Surveillance Survey 2008 Supported community-based physical activityand nutrition programs in which hundreds ofpeople participated in walking programs, cookingclasses and fitness classes. Passed a citywide Pedestrian Master Plan including recommendations for improving the walkingenvironment. terplan.asp Enhanced the food and fitness environment forCity of Minneapolis employees by improving theappearance of stairwells and facilitating weeklydelivery of locally grown produce from a nearbyfarm. Received 2.2 million from the Minnesota Statewide Health Improvement Program to improvethe food environment and increase access tophysical activity in worksites, communities,schools and clinics. Improved physical activity and nutrition policies and practices at 142 child care programs andMinneapolis Public Schools to ensure that youngpeople enter adulthood at a healthy weight.Web Links and ResourcesOver the last few decades, Americans have engineered physical activity out of their dailylives via elevators, people movers and other interventions. Simple improvements tostairwells can encourage people to build more physical activity into their daily lives.Statewide Health Improvement Program –Minneapolis www.ci.minneapolis.mn.us/dhfs/ship.aspMinneapolis farmers sFarmersMarkets.asp
Minneap lis a healthy lifeAsthmaReduce the Asthma Hospitalization RateAsthma is associated with a variety of indoor andoutdoor environmental factors, including smoking.Asthma hospitalization rates often increase whenair pollution from fine particles is high; this comesprimarily from the burning of fossil fuels, especiallyin cars and trucks.TargetReduce asthma-related hospitalizations by 2010:10Trend AnalysisAccording to the most recent data available, therewere 768 asthma hospitalizations in Minneapolisduring 2008, down 10 percent from 855 the yearbefore. The asthma hospitalization rate decreasedthe most in children up to age 4 from 86 to 55 hospitalizations per 10,000 children. Similar to 2007,the 2008 rate for people ages 5 to 64 was 16 hospitalizations per 10,000 people and for people 65 andolder was 33 hospitalizations per 10,000 people.0 to 4 years old – reduce to 51 per 10,000 people5 to 64 years old – reduce to 14 per 10,000 people65 and older – reduce to 24 per 10,000 peopleRecent City and Community ActivitiesHospitalizations from asthma among Minneapolis residents Enrolled 128 families in the EnvironmentalAction for Children’s Health project, whichcompleted environmental assessments and interventions on 86 rental properties and 11 licensedhome daycares to identify asthma triggers andprovide tools for reduction. Participants reportedreduced hospital admissions and improvementsin observed symptoms on a daily basis.per 10,000 people1201008060Age 0-40-4 target40Age 65 65 targetMinneapolisAge 5-64205-64 target020042005200620072008Source: Minnesota Department of Health Inspected every licensed tobacco dealer in thecity and issued 32 citations for selling tobaccoproducts to minors, a decrease from 74 citationsthe year before. Inspected all 1,164 restaurants and bars for violations of the smoking ordinance and found highcompliance rates despite increased after-hoursinspections. Only three citations were issued. Took enforcement action on 65 vehicle idlingcases. An ordinance limiting idling was adoptedby the City in 2008 to improve air quality byreducing vehicle Idling home.aspWeb Links and ResourcesMinnesota Department of Health asthma program .htmlCenters for Disease Control and Preventionasthma program www.cdc.gov/asthmaAmerican Lung Association of Minnesotawww.alamn.org/americancitiesCity of Minneapolis anti-idling ng home.aspMinnesota Pollution Control Agency asthmatriggers ents/09.eng.trigger.pdfChildren’s lungs are especially susceptible to fine particles found in air pollution.Residents can help protect everyone’s lung health by driving less.
Minneap lis a healthy lifeLeadPoisoning11Keep Children Lead SafeChildhood lead poisoning is one of the most common yet preventable health problems in the U.S.Lead is highly toxic and can be found in peelingpaint, soil and unregulated products. Children usually have no overt symptoms, but the damage isirreversible and can be profound – including braindamage, learning problems and antisocial behavior.Ensuring that all children are tested will promoteprevention, education and early intervention andcan reduce lead poisoning. Inspecting the homesof lead-poisoned children identifies lead sources sothey can be removed to prevent future exposures.Target Annually test all 1- and 2-year-old childrenfor lead by 2014. Annually inspect all homes where children haveelevated blood-lead levels (10 micrograms oflead per deciliter of blood or higher).Trend AnalysisThe number of children found suffering from leadpoisoning is decreasing even though the rate oflead testing is increasing. In 2009, 92 childrenwere identified as having lead poisoning; this isa decrease of 24 children from 116 in 2008. Allthe homes with children with lead poisoning wereinspected, compared with 78 percent in 2008. Leadtesting of 1- and 2-year-olds increased from 55percent in 2002 to 74 percent in 2008.Recent City and Community ActivitiesNumber of children who have elevated blood-lead levels Received a 3 million U.S. Housing and UrbanDevelopment (HUD) grant to make propertieslead safe. Ninety-five homeowners signed up toreceive up to 8,000 in free Energy Star windowreplacements and no-interest loans. Ninety-onerental units signed up to receive a 50-percentmatch on Energy Star window replacements andno-interest loans.and home inspections1250Children with elevatedblood-lead levelsgreater than 10 μg/dl200Poisoned children’shomes d-control A total of 174 properties received lead riskassessments – 100 properties were assessedbecause poisoned children lived in the home, andthe other 74 were part of HUD prevention grants.50020052006200720082009Source: Minnesota Department of Health1 As of July 2008, the City inspects the homes of children with a blood-lead level at 10 micrograms of lead per deciliter of blood or higher (μg/dl).Minneapolis 1- and 2-year-olds tested for lead20042005200664%65%69%2007200872%74%Source: Minnesota Department of HealthTesting is recommended for all Minneapolis 1- and 2-year-olds plus anyone up to age 6not previously tested. A total of 149 properties were made lead safethrough HUD lead poisoning prevention grants– 93 of these properties were the homes of leadpoisoned children. As a part of redeveloping them, 679 propertieswere made lead safe by conducting risk assessments of the whole property and removing eachsource of lead. Increased the percentage of 1- and 2-year-oldstested for lead poisoning in the Near North community (Near North, Willard-Hay, Jordan, Sumner Glenwood, Harrison, and Hawthorne neighborhoods) from 56 percent in 2007 to 63 percentin 2008 as part of targeted outreach efforts.Web Links and ResourcesMinneapolis Project for Lead-Safe . Centers for Disease Control and Preventionlead information www.cdc.gov/nceh/lead/default.htmU.S. Department of Housing and Urban Development www.hud.gov/offices/lead/index.cfmU.S. Environmental Protection Agencywww.epa.gov/leadIngesting paint chips and dust from window sills is a common yet preventable waychildren are poisoned with lead.Minnesota Department of Health, EnvironmentalHealth www.health.state.mn.us/divs/eh/lead/index.html
ClimateChangeMinneap lis greenprintReduce Carbon Dioxide Emissions12Trend AnalysisThe science is clear – climate change is real, weare responsible, and it is a threat. Carbon dioxidepollution, a greenhouse gas, causes climate change.Transportation and coal-burning power plants arethe largest sources of carbon dioxide pollution in theU.S. Worldwide, 2009 was tied for the second warmest year since recording began in 1880. Our mostrecent decade was the warmest decade on record.In 2009, 4.1 million megawatt hours of electricitywere consumed citywide releasing almost 2.5 million tons of carbon dioxide.The estimated number of vehicle miles traveled onMinneapolis roads was 2.4 billion, a 3.5-percentdecrease from the prior year.1 In Minneapolis,63 percent of all households do not own a vehicle(29,400 households) or own only one vehicle(71,600 households).2Target1 2008 Minnesota Department of Transportation Reduce carbon dioxide emissions from municipaloperations by 1.5 percent vmt.html2 2008 Census Bureau’s, American Community Survey factfinder.census.gov/servlet/ Reduce citywide carbon dioxide emissions by17 percent by 2020 using 2006 as a baseline.ADPTable? bm y&-qr name ACS 2008 1YRG00 DP4&-geo id 16000US2743000&-dsname ACS 2008 1YR G00 &- lang en&-redoLog falseRecent City and Community Activities The Xcel Energy Riverside Plant in northeastMinneapolis was converted from coal to naturalgas, producing more electricity while emittingmuch less carbon dioxide and other pollutants. More than 8,200 Minneapolis residents andbusinesses have taken the Minnesota EnergyChallenge and are discovering new ways to saveenergy and money. www.mnenergychallenge.org The City awarded a third year of climate changemicrogrants to engage people in innovative,immediate energy-saving and money-savingactions. ywide electricity consumed and carbon dioxide emissions releasedin millions of unitsElectricity in megawatt hoursCarbon dioxide in tons4.54.03.53.02.52.01.5eChangeGrants2009.asp1.0 The Energy Innovation Corridor was formed tocreate a sustainable energy and transportationshowcase along the planned Central Corridorlight-rail transit route between downtownMinneapolis and downtown Saint Paul.0.502006200720082009Source: Xcel Energywww.energyinnovationcorridor.comButler Properties, LLC Completed a comprehensive overhaul of the City’sparking requirements in the zoning code – theCity now requires bicycle parking for many uses,eliminates parking minimums and introduces parking maximums in certain districts, and allows moregenerous shared parking arrangements. LEED-certified projects – projects with nationalthird-party verification for high green buildingstandards – now registered in Minneapolis include13 certified nonresidential buildings, sevencertified homes and an additional 40 projectsthat are slated for certification. www.usgbcmn.orgButler Square, built in 1908 and renovated in 2009, is the oldest multitenant commercialbuilding in the nation to achieve Leadership in Energy and Environmental Design (LEED)certification for existing buildings. It ranks among the top 15 percent of all commercialbuildings nationwide for its efficient energy use.Web Links and ResourcesMinnesota Center for Energy and Environmentwww.mncee.orgU.S. Environmental Protection Agency (EPA)Energy Star Programwww.energystar.govXcel Energywww.xcelenergy.com/mplsconserves
RenewableEnergyMinneap lis greenprintIncrease the Use of Renewable Energy13Trend AnalysisIn the face of climate change and harmful pollutionlevels created by our current energy consumption,it is critical to use more renewable energy includingsolar, wind, biomass and hydropower. Renewableenergy contributes to energy security, stable energypricing, climate change solutions and green jobs.Limited state solar rebate availability and theeconomy contributed to a decline in new solar installations in 2009. The City issued five solar permits in2009 compared to 10 in 2008, 12 in 2007 and 18 in2006. There are solar photovoltaic systems on threeCity buildings. Twelve permits related to geothermalsystems were also issued by the City in 2009.TargetIn 2009, Xcel Energy obtained 20 percent of its power from renewable energy compared to 19 percent in2008. Minnesota regulations require Xcel to obtain30 percent of its electricity from renewable resourcesby 2020 – most of it coming from Minnesota-generated wind power. In municipal operations increase renewableelectricity to one megawatt by 2014. Citywide, increase renewable energy use to 10percent above Xcel Energy’s renewable power mixby 2014.Recent City and Community ActivitiesXcel Energy electric power sources in Minnesota1 Partnered with stakeholders to pass state legislation encouraging renewable resource developmentcombined with energy efficiency and conservation.Renewables2Natural gas/oilNuclearCoal As part of a federal Solar America Cities grant,improved the permitting process for solar projectsand conducted solar training for local governmentsto encourage more sola
parents through the Minnesota Visiting Nurse Agency. www.mvna.org Conducted 2,115 home visits with 325 pregnant women and provided community-based prenatal classes to 195 women through Way to Grow. www.mplswaytogrow.org2002-04 Provided more than 1,110 people in African-American and American Indian communities