Transcription
(2021) 7:50Koketsu et al. Porc Health n AccessRESEARCHFive risk factors and their interactionsof probability for a sow in breeding herdshaving a piglet death during days 0–1, 2–8and 9–28 days of lactationYuzo Koketsu1*, Ryosuke Iida1 and Carlos Piñeiro2AbstractBackground: Increasing preweaning piglet mortality is a concern for veterinarians and producers in relation to sowperformance and piglet welfare. Our objectives were (1) to characterize pre-weaning piglet mortality risk for sows(PWM) during early (0–1 days), mid- (2–8 days) and late (9–28 days) lactation and (2) to quantify the following five factors and their interactions, parity, number of piglets born alive (PBA), number of stillborn piglets (SB), gestation length(GL) and season for PWM during the three lactation phases.Methods: Data obtained from 264,333 parity records of 55,635 sows farrowed in 2015 and 2016 from 74 Spanishherds. Three multi-level mixed-effects logistic regression models were separately applied for PWM during three lactation phases, which was analyzed as whether or not a sow had a piglet death (i.e. probability of a sow having a pigletdeath) in each phase.Results: PWM during early, mid- and late lactation were 36.9, 27.0 and 15.4%, respectively. As PBA increased from 11or less to 16 or more pigs, PWM during early and mid-lactation increased by 15.8 and 6.0%, respectively, but there wasno increase during late lactation. Also, as GL decreased from 117–120 to 110–113 days, PWM during early, mid- andlate lactation increased by 7.5, 6.8 and 1.5%, respectively. Additionally, PWM during the respective lactation phasesincreased by 8.3, 5.2 and 1.0%, as SB increased from 0 to 3 or more pigs. During early lactation, parity 1 sows had 2.1%lower PWM than parity 5 or higher sows, but during mid- and late lactation they had 4.2% higher PWM (P 0.05).However, there was no difference between summer and winter for PWM during early lactation (P 0.26).Conclusion: Management practices to reduce PWM need to take account of these factors, and be modified fordifferent phases. For example, during early lactation special care should be given to piglets born to parity 5 or highersows farrowing 16 or more PBA, having 3 or more SB or GL 110–113 days, whereas during mid- and late lactationmore care should be given to piglets born to parity 1 sows with the same PBA, GL and SB conditions.Keywords: Farm data, Piglet death, Pre-weaning mortality, Sow data*Correspondence: koket001@meiji.ac.jp1School of Agriculture, Meiji University, Higashi‑mita 1‑1‑1, Tama‑ku,Kawasaki, Kanagawa 214‑8571, JapanFull list of author information is available at the end of the article The Author(s) 2021. Open Access This article is licensed under a Creative Commons Attribution 4.0 International License, whichpermits use, sharing, adaptation, distribution and reproduction in any medium or format, as long as you give appropriate credit to theoriginal author(s) and the source, provide a link to the Creative Commons licence, and indicate if changes were made. The images orother third party material in this article are included in the article’s Creative Commons licence, unless indicated otherwise in a credit lineto the material. If material is not included in the article’s Creative Commons licence and your intended use is not permitted by statutoryregulation or exceeds the permitted use, you will need to obtain permission directly from the copyright holder. To view a copy of thislicence, visit http:// creat iveco mmons. org/ licen ses/ by/4. 0/. The Creative Commons Public Domain Dedication waiver (http:// creat iveco mmons. org/ publi cdoma in/ zero/1. 0/) applies to the data made available in this article, unless otherwise stated in a credit line to the data.
Koketsu et al. Porc Health Manag(2021) 7:50IntroductionAn increased number of piglet deaths during lactation is one of the biggest concerns of vets and producers related to sow performance and piglet welfare[1–3]. The typical way of monitoring piglet deathsduring lactation has been to record them as herd-levelpreweaning piglet mortality, which is calculated by therecording systems [4]. However, if piglet deaths arerecorded as herd-level information, it is not possibleto perform multivariable analyses to examine multiplefactors and their interactions in the same model [5, 6].However, there are several software products thatrecord piglet deaths and can generate data of sow-levelpiglet deaths during different pre-weaning stages during lactation. Using such a data, possible factors forpre-weaning piglet mortality risk for sows (PWM) asprobabilities of a sow having a piglet death could beseparately examined during each of three lactationalphases. Also, our idea is to analyze PWM as a binaryoutcome during early, mid- and late lactation, becauseunlike sow deaths, piglet death events can occur multiple times at the sow level, with several piglets in alitter possibly dying at different times during a singlelactation. A binary model has been applied for pigletdeaths or stillbirths because those are a zero-inflatedvariable [6–8]. Therefore, it is now possible to conductsow-level PWM during different lactation phases, butto date no such studies have been reported.Possible factors associated with higher PWM areparity, more piglets born alive (PBA), more stillbornpiglets (SB), shorter gestation length (GL) and farrowing season [1, 2, 9]. Various studies have found linksbetween these factors and issues that could be associated with pre-weaning piglet deaths. For example,low and high parity have been associated with higherpre-weaning mortality [9–11]. Also, more SB at herdlevel has been correlated with herd-level pre-weaningmortality and post-weaning mortality [12]. Furthermore, sows with shorter GL have been associated withhaving more SB and more PBA which likely results inlower litter weaning weights [13] which in turn wouldbe related to piglet deaths. However, there have beenconflicting results about associations between farrowing season and piglet deaths [1, 2]. For example,researchers suggested that pre-weaning piglet mortality was higher in winter, due to cold stress, than in theother seasons [1], whereas another report observedhigher preweaning piglet mortality in summer than inspring due to heat stress [14].No research has studied these five factors (i.e. parity, PBA, SB, GL and season) and their interactionsfor PWM during early, mid- and late lactation in theseparate three models. Therefore, our objectives werePage 2 of 10(1) to characterize PWM during early (0–1 days), mid(2–8 days) and late (9–28 days) lactation in sow herds,and (2) to quantify the five factors and their two-wayinteractions for PWM during these three phases oflactation.Materials and methodsFarms and sow measurement records with ages at pigletdeathA veterinary clinic (PigCHAMP Pro Europa S.L. Segovia, Spain) has requested all client producers to mail theirdata files if they consented to allow their data to be usedfor research purposes under their data-share program,and has accumulated a database. The data in the presentproject were extracted from the sow database. Therefore,the present study was designed as an observational studycoordinating sow data from 91 Spanish herds which had10-year records, and their farm data had been previouslyused for a herd-level longitudinal study [15]. For this project, we used two years of sow data from 2015 to 2016.However, not all of the herds could be used in the analysis because not all producers appeared to have properlyrecorded the ages of the piglets that died. Consequently,17 of the herds were removed because their records hadno piglet deaths during days 0–1 of lactation throughoutthe 2 studied years and it was considered that those producers had not properly recorded the ages at piglets died.The 74 remaining herds had records of piglet deaths in allthree lactation phases. Also, according the EU regulation[16], sow records with lactation length 20 days or fewerwere not used for the present study. Therefore, the initialsow data contained 276,260 parity records of 59,088 sowsfarrowed in 74 herds between 2015 and 2016. Mean herdsize in the 74 herds over the two years was 1,066 (874standard deviation) sows ranging from 83 to 3,682 sows.Data and exclusion criteriaParity records in the data were excluded if they met any ofthe following criteria: total number of piglets born being0 or 31 pigs or more (181 records) [17]; lactation lengthof 41 or more days (3095 records), nurse sow records(7179 records) and GL of 109 days or less or 121 days ormore (1472 records). The range of gestation length waschosen as 115 5 days. Also, the nurse records were notused because there were few records, and they were notevenly distributed across all the farms. For example, 15farms had only 1 or 0 nurse records during the studiedyears. Therefore, the final data contained 264,333 parityrecords of 55,635 sows.Regarding the ages of piglet deaths recorded by theproduce, sow records were excluded if the average ageof piglet deaths was the same or one day less than theaverage weaning age (7729 records). These data were
Koketsu et al. Porc Health Manag(2021) 7:50excluded because it was considered that in these recordsthe dates of piglet death events had been recorded atweaning or one day before weaning, and did not show theactual piglet death date. Therefore, the final data for piglet ages contained 256,604 records.The recording accuracy of piglet death events may varybetween farms. So, to check how accurately the producers had recorded piglet death events, herd-level internalconsistency was examined by comparing the pre-weaning mortality recorded by the producers over the twostudied years with that calculated by the software. Thecomparison showed that the producers recorded 85.3% ofthe pre-weaning mortality calculated by the software, i.e.that they had recorded 85.3% of the piglet deaths occurring during lactation. The Pearson correlation coefficientbetween the mean pre-weaning mortality values calculated by the two methods in the 74 herds over the twoyears was 0.74 (P 0.01).Definitions and categoriesSows were categorized into three parity groups: 1, 2–4and 5 or higher. There were four farrowing season groups:January-March (winter); April-June (spring), July–September (summer) and October–December (autumn).Three BA groups were based on the 25th and 75th percentiles of BA: 11 pigs or fewer, 12–15 pigs and 16 pigsor more. Three GL groups were 110–113, 114–116 and117–120 days. The four SB groups were 0, 1, 2 and 3 ormore pigs.Statistical analysisAll analyses were carried out using of SAS UniversityEdition (SAS Inst. Inc., Cary, NC, U.S.A.). Also, a piglet death was treated as a binary outcome and PWMwas examined as the probability of a sow having a pigletdeath. For the binary outcome, a three-level generalizedmixed-effects model was used with a logit link functionPage 3 of 10in individual parity records for each phase of lactation.This model was used to account for the clustering of sowswithin a farm (GLIMMIX, random statement), and thecorrelation between repeated measures in the same sowwithin a farm (GLIMMIX, random residual statement).The ILINK (inverse link function) was used to convertthe logarithm to a probability [18]. The models containedthe five factors, parity, BA, SB, GL and season, and 10possible two-way interactions as fixed effects. Additionally, farrowing year and mean herd size (sows) for the twostudied years were included as fixed effects in all models.All significance levels were set at P 0.05. Also, pairwisemultiple comparisons were performed using the Tukey–Kramer test when significance was found. The adequacyof the model assumptions for the random effects waschecked by visual inspection of normal-probability plots[19]. Additionally, Spearman correlation analysis wasperformed between the three lactation phases for pigletdeaths.Intraclass correlation coefficientTo evaluate the variation in the amount of PWM in thethree lactation phases that could be explained by thefarm or sow, the intraclass correlation coefficients (ICC)were calculated by the following equations [20]:ICC (individual records within the same farm but different sows) σv2 /(σv2 π 2 /3),ICC(individualrecordswithinthesamefarm) (σv2 σu2 )/(σv2 σu2 π 2 /3),in which σv2 is the between-farm variance,σu2 isbetween-sow variance at the individual record level andπ 2 /3 is the assumed variance at the individual recordlevel.Table 1 Summary statistics for piglet deaths and related measurementsMeasurementsNMean ( SD)MinimumMaximumFarrowed parity264,3333.6 (2.1)117Gestation length, days264,333115 (1.5)110120Number of piglets born alive264,33313.4 (3.5)129Number of stillborn piglets264,3331.06 (1.50)023Lactation length, days264,33325.1 (3.4)2140Number of piglets weaned264,33311.5 (2.2)039Age when piglet died, days256,6042.40 (4.52)038Probability of a sow having a piglet death during early lactation (days 0–1), %256,60436.9 (48.2)––Probability of a sow having a piglet death during mid-lactation (days 2–8), %256,60427.0 (44.3)––Probability of a sow having a piglet death during late lactation (days 9–28), %256,60415.4 (36.1)––SD standard deviation
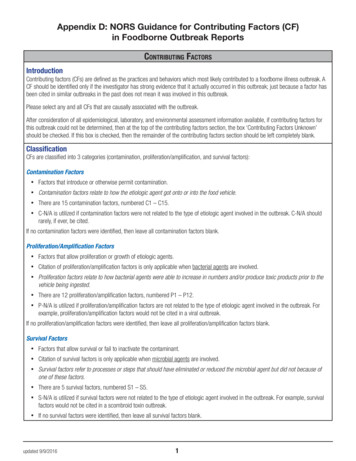
Koketsu et al. Porc Health Manag(2021) 7:50Page 4 of 10Table 2 P-values of fixed factors included in the mixed-effectslogistic regression models for pre-weaning piglet mortality riskfor sows (probabilities of a sow having a piglet death) duringearly (0–1 days), mid- (2–8 days) and late (9–28 days) lactationFixed factors1,2Pre-weaning piglet mortality riskTable 3 Comparisons of pre-weaning piglet mortality riskfor sows (probabilities of a sow having a piglet death) duringearly (0–1 days), mid- (2–8 days) and late (9–28 days) lactationbetween parity, farrowing season, piglets born alive, gestationlength and stillborn piglets groups1GroupsNPre-weaning piglet mortality nMidlactationLate lactationParity groups0.04 0.01 0.01Mean ( SE)Mean ( SE)Mean ( SE)Season groups0.020.010.10Piglets born alive (PBA) 0.01 0.010.15Stillborn piglets (SB) 0.01 0.01 0.0134.3 (1.60)b25.5 (2.53)a14.5 (1.91)aGestation length (GL) 0.01 0.01 0.01a12.7 (1.74)bb21.3 (2.20)10.3 (1.45)c0.630.420.05 0.010.04 0.0122.3 (2.36)b12.1 (1.72)0.130.270.1624.0 (2.40)ab12.4 (1.71)0.020.030.23Season PBA0.200.200.05Season GL0.980.540.37Season SB0.330.450.08PBA GL 0.010.280.44PBA SB 0.010.060.09 0.010.050.03Two-way interactionsParity seasonParity PBAParity GLParity SBSB GLParity12–45 or higher123,314 35.4 (1.72)ab85,384a36.4 (1.74)25.7 (2.34)Farrowing season64,58435.5 (1.97) abApr.–Jun64,26435.2 (1.58)abJul.–Sept68,99034.0 (1.54) b25.5 (2.40)a13.3 (1.84)Oct.–Dec66,49536.8 (1.88) a24.7 (2.32)a11.9 (1.54)Jan.–MarPiglets born alive11 or lesspigs69,23228.1 (1.52)c21.5 (2.14)c12.2 (1.65)12–15 pigs95,37135.0 (1.61)b23.6 (2.21)b12.3 (1.63)99,730a27.5 (2.80)a12.8 (1.71)127,524 31.5 (1.48)d22.0 (2.09)d12.0 (1.59)b33.0 (1.62)cc11.9 (1.60)b37.2 (1.73)bb12.9 (1.71)a39.8 (1.98)aa27.2 (2.60)12.9 (1.74)a16 or morepigs43.9 (1.92)Stillborn piglets0 pigsResultsMean PWM during early, mid- and late lactation were36.9, 27.0 and 15.4%, respectively (Table 1). Table 2 showsP-values of the five factors and their two-way interactionsin the models for PWM during each of the three lactationphases. All the five factors: parity, season, PBA, SB andGL were significant for PWM during early and mid-lactation (P 0.05; Table 2). During late lactation, parity, SBand GL were significant for PWM (P 0.01), but seasonand PBA were not (P 0.08). There were also some significant interactions for PWM between the five factors,such as parity PBA, parity SB, PBA GL, PBA SBand SB GL (Table 2; Figs. 1, 2, 3 and 4). Additionalfile 1 shows estimates of fixed effects and random effectvariance included in the three models for PWM. Also,34–45% of ICCs within the same sow and within thesame farm were found in the two models for mid- andlate lactation (Additional file 1).Table 3 shows comparisons for PWM between thegroups for each of the five factors during each lactationphase. With regard to PBA, during early lactation, PWMincreased from 28.1% in the PBA 11 or less pigs group to43.9% in the PBA 16 or more pigs group (i.e. an increaseof 15.8%). During mid-lactation, the increase was from21.5 to 27.5%, but there was no increase during late lactation (P 0.15). Also, with regard to SB, during early55,6351 pig2 pigs3 or morepigs65,18538,49433,13022.8 (2.20)24.5 (2.36)Gestation length, days1110–113 days37,87739.3 (1.93)a28.2 (2.63)a13.4 (1.81)a114–116 days187,339 35.2 (1.68)b23.1 (2.24)b12.0 (1.61)b117–120 days39,11731.8 (1.49)c21.4 (2.06)c11.9 (1.57)bMeans and SEs were estimated in mixed-effects modelsa cDifferent superscripts within a column represent significant differences inmeans (P 0.05)lactation PWM increased from 31.5% in sows with SB 0to 39.8% in sows with SB 3 or more pigs, and from 22.0 to27.2% during mid-lactation and from 12.0 to 12.9% during late lactation, respectively. Additionally, with regardto GL, during early lactation PWM increased from 31.8%for GL 117–120 days to 39.3% for GL 110–113 days, andfrom 21.4 to 28.2% during mid-lactation and from 11.9 to13.4% during late lactation, respectively.The association between parity and PWM varied during lactation phases. For example, as the number of parity increased, PWM during early lactation increased from
Koketsu et al. Porc Health Manag(2021) 7:50Piglets born alive (PBA) 11 or lessPWM, %5045Page 5 of 1050A: Day 0-1 lactation 46.2 30byaz 23.9ay25bybz2020201515151010105512-415 orhighC: Day 9-28 lactation35ayay252550B: Day 2-8 lactation35zPBA 16 or morePBA 12-152-4Parityaax ayay13.7bb b10.155 orhigha a15.112-45 orhighFig. 1 A–C Two-way comparisons of pre-weaning piglet mortality risk for sows (probabilityof a sow having a piglet death: PWM) during early(0–1 days), mid-(2–8 days) and late (9-28 days) lactation (N 264,333 sows) between parity and PBA groups. Means and SEs were estimated inmixed-effects models. a, bDifferent superscripts within parity groups represent significant differences in means (P 0.05). x–zDifferent superscriptswithin PBA groups represent significant differences in means (P 0.05)0 Stillborn piglets (SB)PWM, %50xx4036.6y30.0byxxy39.5abzzayy31.6B: Day 2-8 15151012-45 or high3 or more SB2 SB50A: Day 0-1 lactation45351 SB10Parityazay26.123.6ay30.0aybxy bx23.4byayby23.020.421.419.712-45 or highFig. 2 A, B Two-way comparisons of pre-weaning piglet mortality risk for sows (probabilityof a sow having a piglet death: PWM) during early(0–1 days) and mid-(2–8 days) lactation (N 264,333 sows) between parity and SB groups. Means and SEs were estimated in mixed-effectsmodels. a–cDifferent superscripts within parity groups represent significant differences in means (P 0.05). x,yDifferent superscripts within SB groupsrepresent significant differences in means (P 0.05)
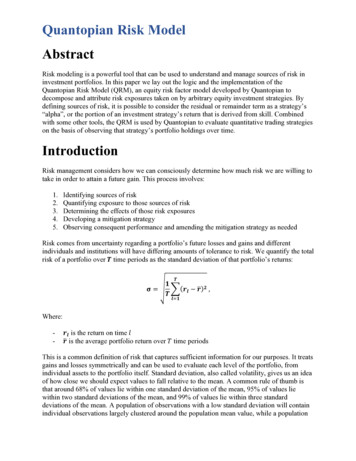
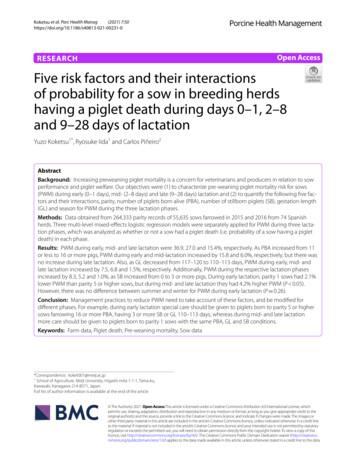
Koketsu et al. Porc Health ManagPage 6 of 10Piglets born alive (PBA) 11 or lessPWM, %50(2021) 7:50axA: Day 0-1 047.2ax5023.5bx44.1403515152 SB3 SBStillborn piglets (SB)1040.2byay32.7cybz27.4cz24.3251 SBcxay200 SBB: Day 0-1 lactation45201047.4 ax30bzczPBA 16 or morePBA 12-15110-113114-116117-120Gestation length (GL)Fig. 3 AB. Two-way comparisons of pre-weaning piglet mortality risk for sows (probabilityof a sow having a piglet death: PWM) during early(0–1 days) lactation (N 264,333 sows) between PBA groups and either SB (A) or gestation length (B) groups. Means and SEs were estimated inmixed-effects models. a–dDifferent superscripts within SB or GL groups represent significant differences in means (P 0.05). x–zDifferent superscriptswithin PBA groups represent significant differences in means (P 0.05)34.3 to 36.4%, whereas during mid- and late lactationPWM decreased from 25.5 to 21.3% and from 14.5 to10.3%, respectively (Table 3; P 0.05). In season groups,sows farrowed in summer had higher PWM during midlactation than in winter (Table 3; P 0.05), but there wasno difference between summer and winter for PWM during early lactation (P 0.26). Furthermore, no significantdifferences were found between farrowing season groupsfor PWM during late lactation (P 0.10). Additionally,there were no two-way interactions between farrowingseason and either parity, PBA, SB or GL groups for PWMduring any lactation phase (Table 2; P 0.05).There were significant two-way interactions betweenparity and PBA groups for PWM during early, mid- andlate lactation (P 0.05; Table 2; Fig. 1A–C; Additionalfile 2). For example, in the PBA 16 or more group, as parity increased from parity 1 to parity 5 or higher, PWMduring early lactation increased from 41.6 to 46.2%(Fig. 1A). However, in the same PBA group (16 or more),PWM during mid-lactation decreased from 29.1% in parity 1 to 23.9% in parity 5 or higher (Fig. 1B). Also, PWMduring late lactation decreased from 15.1 to 10.1% in thePBA 16 or more group (Fig. 1C).There were also significant two-way interactionsbetween parity and SB groups for PWM during earlyand mid-lactation (P 0.05; Table 2; Fig. 2AB; Additional file 3). For example, for parity 1 sows PWM during early lactation increased from 30.0% for sows with SB0 to 39.5% for sows with SB 3 or more, whereas for parity 5 or higher sows, PWM in the respective SB groupsincreased from 32.6% and 40.1% (Fig. 2A). Also, duringmid-lactation, PWM in parity 1 sows increased from23.0% for sows with SB 0 to 30.0% for sows with SB 3 ormore, whereas for parity 5 sows the increase in PWMbetween the SB 0 and 3 or more groups was only from19.7 to 23.4% (P 0.05; Fig. 2B).Two-way interactions between PBA and both SBgroups and GL groups were significant for PWM onlyduring early lactation (P 0.05; Table 2; Fig. 3A, B; Additional file 4). Firstly, for sows with SB 3 or more, PWMincreased from 32.7% in sows with PBA 11 or less to47.2% for sows with PBA 16 or more, whereas for sowswith SB 0 PWM increased from 23.5 to 41.2% in therespective PBA groups (Fig. 3A). Also, for the PBA 16 ormore group, PWM increased from 40.2% in the GL 117–120 group to 47.4% in the GL 110–113 group, whereasfor sows with PBA 11 or less, PWM increased from 24.3to 32.7% in those 3 GL groups (Fig. 3B).There were also significant two-way interactionsbetween GL groups and SB groups for PWM during
Koketsu et al. Porc Health ManagPWM, %50(2021) 7:50Gestation length (GL) 110-113 3a a12.3550B: Day 9-28 lactation45ay40.8cxGL 117-120 daysGL 114-116 days50axA: Day 0-1 lactation4540Page 7 of 1000SB1SB2SB3 SB0 SB1 SB2 SB3 SBStillborn piglets (SB)Fig. 4 AB. Two-way comparisons of pre-weaning piglet mortality risk for sows (probabilityof a sow having a piglet death: PWM) during early(0–1 days) and late lactation (9–28 days; N 264,333 sows) between gestation length groups and either parity (A) or SB groups (B). Means and SEswere estimated in mixed-effects models. x–zDifferent superscripts within SB groups represent significant differences in means (P 0.05). a–dDifferentsuperscripts within gestation length groups represent significant differences in means (P 0.05)early and late lactation (P 0.05; Table 2; Fig. 4AB; additional file 5). During early lactation, when GL was 110–113 days, PWM increased from 34.2% for sows with SB0 to 45.4% for sows with SB 3 or more, whereas when GLwas 117–120 days, PWM increased from only 29.1 to34.5% in the four SB groups (Fig. 4A). However, duringlate lactation while PWM for sows with GL 117–120 daysincreased from 11.3% for sows with SB 0 to 12.3% forsows with SB 3 or more, there was no difference in PWMfor sows with SB 3 or more in the different GL groups(P 0.28; Fig. 4B).In correlation analysis, significant positive coefficientswere found (P 0.01; Additional file 6) for the numbersof piglet deaths between early and mid-lactation (Coeffcient: 0.02), as well as between those during early and latelactation (Coeffcient: 0.02) and between mid- and latelactation (Coefficient: 0.12).DiscussionThis is the first study about how these five factors (i.e.parity, season, PBA, SB and GL) and their interactionshave different associations with PWM during the threedifferent lactation phases. Also, the impact of the five factors on PWM differed between lactation phases. Therefore, to reduce piglet deaths, it is recommended that ateach of the three lactation periods producers with veterinarians prioritize care provision for high-risk sows, suchas high and low parity sows that farrow more PBA orhave more SB or with short GL.Our study also suggests that the impact of PBA onPWM is much larger during early lactation than during late lactation (15.8% vs. no increase). Also, thislarge impact of increased PBA during early lactationmeant that it had a larger impact on PWM than anyof the other four factors assessed in our study; 15.8%increased PWM due to increased PBA, compared withonly 2.1% due to increased parity number, 7.5% due todecreased GL, 8.3% due to increased SB, and only 2.8%between summer and autumn.Our analysis showed a substantial associationbetween PWM and SB 3 or more. Other studies havealso found associations between increased SB and sowperformance and piglet welfare, such as decreased litterweights at weaning [13], more occurrences of uterineprolapse [21] or more abortions at subsequent pregnancy [22], decreased farrowing rate, and decreasedPBA at subsequent parity [13]. Also, SB data appearsto contain piglets that died immediately after farrowing [23]. So, these associations suggest that sows with
Koketsu et al. Porc Health Manag(2021) 7:50increased SB may have had farrowing difficulty [1, 2] oran infectious disease problem such as porcine parvovirus or porcine reproductive and respiratory syndromevirus [24]. Also, in order to decrease the number ofbirths of weak piglets and the number of piglet deathsimmediately after birth, assisted farrowing with timelyuse of manual delivery techniques should be refinedwith herd health programs [2, 9].Our study also showed that parity 1 sows had higherPWM than parity 5 or higher sows during mid- and latelactation, compared with lower PWM during early lactation. A possible reason for the higher PWM for parity 1 sows during mid- and late lactation could be thatsows produce less colostrum in parity 1 than in parity2 or higher [25, 26]. Also, some management practicessuch as colostrum intake assistance or split nursingcan help small piglets survive during early lactation[27–29], but these practices may not necessarily helpto reduce piglet deaths during mid- or late lactation[15], especially for sows in parity 1 that are having theirfirst experience of being suckled. Furthermore, parity1 sows might be more susceptible to poor herd healthsituations because they have immune immaturity [2].So, herd health programs with special care for parity1 sows should be reconsidered to decrease PWM [1, 2,24].In contrast, the high PWM in high parity sows during early lactation could have been due to many PBA. Aprevious study reported that high parity sows farrowedmany PBA with uneven size and low vitality, as well ashaving a long farrowing duration [30]. Also, it appearsthat high parity sows would have more matured immunity and more experiences for lactating than parity 1sows. Therefore, our findings suggest that during earlylactation special care and attention should be given topiglets born to party 5 or higher sows, whereas duringmid- and late lactation more care should be given to piglets born to parity 1 sows.Shorter GL is thought to be associated with higherestrogen concentrations and larger litters; sows withlarger litters have a larger fetal placental unit which produces higher concentrations of estrogen near parturition,and increases the release of oxytocin and prostaglandin[31]. Our results suggested that pregnant pigs with manyfetuses (to be many PBA) had shorter GL and that shortGL caused SB to increase. All these effects resulted inhigher PWM during all lactation phases. Therefore, pregnant pigs should be moved to a farrowing barn at least6 days before their due date. Also, sows with GL 110or 111 days might have had an abortion due to somediseases.The two-way interactions in our study between PBAand either GL or SB for PWM during early lactationPage 8 of 10indicate that when sows farrowed PBA 16 or more andhad either 3 or more SB or 110–113 days GL, there wasan increase in PWM during early lactation. A possiblereason for the increased PWM under these situations isthat shorter GL and more SB could have increased thenumber of births of weak piglets which would be morelikely to die during early lactation, especially when thesows were in parity 1.Our study showing the high PWM during mid-lactation in summer agrees with a previous study showingthe high pre-weaning mortality risks in summer in Japanese herds [14]. Also, during early lactation, there was nodifference of PWM between summer and winter in ourstudy. It appears that capabilities to cope with heat stressor winter coldness in different lactation phases varybetween farms. However, with advanced facilities, equipment (e.g. cool cell or evaporating cooling systems) andmanagement [9, 32], it is possible that producers are ableto mitigate the seasonal effects on piglet deaths for sowsfed in confined barns.The various two-way interactions between four of thefactors (i.e. PBA, parity, GL and SB) for PWM during thedifferent lactation phases indicate that there are different relationships between the four factors depending onwhether PWM occurred during early, mid- and late lactation. Previous studies have reported that higher PBA inhigher
tember (summer) and October-December (autumn). ree BA groups were based on the 25th and 75th per-centiles of BA: 11 pigs or fewer, 12-15 pigs and 16 pigs or more. ree GL groups were 110-113, 114-116 and 117-120 days. e four SB groups were 0, 1, 2 and 3 or more pigs. Statistical analysis All analyses were carried out using of SAS .