Transcription
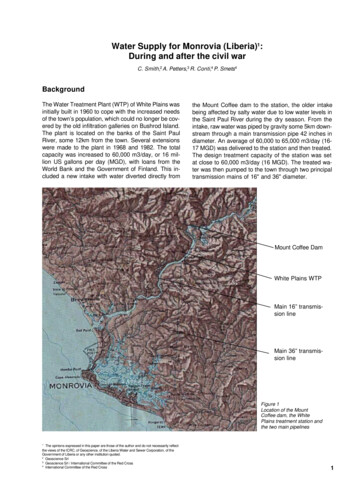
Water Supply for Monrovia (Liberia)1:During and after the civil warC. Smith,2 A. Petters,3 R. Conti,4 P. Smets4BackgroundThe Water Treatment Plant (WTP) of White Plains wasinitially built in 1960 to cope with the increased needsof the town’s population, which could no longer be covered by the old infiltration galleries on Bushrod Island.The plant is located on the banks of the Saint PaulRiver, some 12km from the town. Several extensionswere made to the plant in 1968 and 1982. The totalcapacity was increased to 60,000 m3/day, or 16 million US gallons per day (MGD), with loans from theWorld Bank and the Government of Finland. This included a new intake with water diverted directly fromthe Mount Coffee dam to the station, the older intakebeing affected by salty water due to low water levels inthe Saint Paul River during the dry season. From theintake, raw water was piped by gravity some 5km downstream through a main transmission pipe 42 inches indiameter. An average of 60,000 to 65,000 m3/day (1617 MGD) was delivered to the station and then treated.The design treatment capacity of the station was setat close to 60,000 m3/day (16 MGD). The treated water was then pumped to the town through two principaltransmission mains of 16" and 36" diameter.Mount Coffee DamWhite Plains WTPMain 16” transmission lineMain 36” transmission lineFigure 1Location of the MountCoffee dam, the WhitePlains treatment station andthe two main pipelines1The opinions expressed in this paper are those of the author and do not necessarily reflectthe views of the ICRC, of Geoscience, of the Liberia Water and Sewer Corporation, of theGovernment of Liberia or any other institution quoted.2Geoscience Srl3Geoscience Srl / International Committee of the Red Cross4International Committee of the Red Cross1
In normal times some 60-65,000 m3/day (16-17 MGD)were delivered to the 400 to 500,000 townspeople, anaverage apparent daily delivery per capita of more than100 litres, although the real figure is closer to 50 litresper day if losses in the distribution network are takeninto account. Before the war, the station was already inbad condition due to poor maintenance. Figure 1 showsthe location of the facilities:The White Plains stationThe station was designed to treat water in a conventionalway. Turbidity is removed with aluminium sulphate, thewater is then allowed to settle in four sedimentation basins (each with a 500,000 gallon capacity), and then filtered through eight rapid sand filters equipped with highpressure backwash facilities. There is a provision for preand post-chlorination. The former was abandoned andonly the latter was being done, using gas chlorine. Thetreated water was then stored in two clear water reservoirs with a capacity of 2.5 MG (about 9,500 m3). Thewater was then pumped into the transmission mains viafour high-service pumps (three Worthingtons and oneKSB) with a maximum capacity of 8 MG/day (1,200 m3/h) each.The situation at the treatment plant inmid-NovemberSecurity was one of the main problems to be solved ifregular operation of the plant was to be maintained. During the attacks, the plant suffered minor to heavy damage. LWSC (Liberia Water and Sewage Corporation),with the assistance of MSF-Belgium and otherorganisations, attempted, in precarious conditions, torepair some of the damage. However, access remainedone of the major difficulties, as did the lack of power,chemicals and people to operate the plant.1990JanuaryMayJuneJuneA brief description of the transmissionsystemThe distribution mains consist of a 16" cast iron (CI) pipethat reaches the town via Caldwell along the UN Drive. Itnarrows to 12" at the bridge over the Mesurado Channeland continues on to Mamba Point. The 36" pre-stressedconcrete main reaches Paynesville from White Plains,continues on to Congotown and Sinkor and narrows to24" and then to 16" before reaching the Mamba PointBooster. A 16" pipeline links the Paynesville and UN Drivemains along the freeway. There are reservoirs at Ducor(2,200 m3) and City (3,785 m3).Overall, there are 48 km of 36" mains and 26 km of 16"mains. Before the war, they supplied approximately 75% of the city through nearly 20,000 connections. Therecent history of the water supply of the town of Monroviais intimately linked with the onset of the conflict in earlyJanuary 1990 and with its evolution during the first yearsof the civil war. The location of the White Plains watertreatment plant made it vulnerable to attack by the warring factions. The civil war reached Monrovia in June 1990and the plant ceased operating on 27 June, followingmilitary action in the area.The chronology of events since the beginning of 1990 isgiven in Table I.2JulyAugustSeptemberOctoberNovemberCivil war breaks out.The last commercial flight leavesRobertsfield International Airport.Fighting is reported between thetwo rebel factions of Taylor andPrince Johnson at Gbarnga.White Plains is controlled byTaylor and water stops flowing tothe town.Rebels reach Monrovia. Fightingwithin the town betweengovernment troops (S. Doe) andrebel factions. Electricity suppliesare cut.Mount Coffee hydroelectric damcollapses, as floodgates cannotbe operated for unknown reasons.Widespreadlootinganddestruction in Monrovia.ECOMOG peacekeeping forcesarrive in Monrovia on 25 August.Death of President Doe.Aid workers (MSF and CatholicAid) withdraw from Kakata asTaylor’s forces are pushed backby ECOMOG.Taylor’s rebels attack WhitePlains on 9 November andseriouslydamagethetransformers, several motors andelectrical panels of the station.An intensive operation islaunched by ECOMOG/INPFL toclear and regainTable IA chronology of the main events that affected waterand power supply in 1990
On 21 November it was possible to replace the damaged transformers and carry out other repairs. Thestock of treatment chemicals (3 MT) supplied by MSFBelgium (Médecins Sans Frontières Belgique) was inprinciple sufficient for six weeks and operators wereavailable to run the station. But water was not distributed until 24 November due to lack of power. After thedestruction of the Mount Coffee hydroelectric dam,Monrovia was without a reliable source of electricalpower due to the lack of fuel (diesel) to operate the gasturbines. The only power unit still operational (aMitsubishi electrical generator) was running erraticallyand therefore unreliable.An initial production target of 20% of design capacitywas set. Production data were collected at the stationin early March 1991 and are presented in Figure 2. Thedata collected give the number of hours of operationper day of the low-lift and high-lift pumps. Of the threeoperational high-lift pumps, two were generally usedduring this period. Three pumps were operated for onlytwo days in December and four days in January. Volumes can only be extrapolated from the estimated pumping capacities of the pumps, given the total number ofhours, as no flow metres were operational. As shownDaily operation of pumpsWhite Plains WTPLow lifthours8070by the graph, production was quite erratic, reaching,when volumes are computed using mean values, onlyabout 20% of design capacity in December and about25% in January. The values obtained are subject to systematic error, as the capacity of the pumps must beestimated. It was assumed that the two high-lift pumpsin operation had an output close to 12.5 MGD, slightlyhigher than the 5 MGD used by LWSC for the 8 MGDWorthington pump. The only measurements availableare from Williamson5, who estimated the flow in 1986and 1987 by measuring the drop in the level of the clearwater store. His conclusion was that, while in 1986 twopumps produced 15-16 MGD, this had dropped to 12.5MGD the following year. The difference in the computedvolumes differs only by about 5% and should not significantly affect the results of this study, as drastic changeswill be observed during the following years. Mean values could lead to confusion as one might think the settarget has been reached. Daily data shown in Figure 2give a better idea of the problems faced by the utility.Production was irregular, with eight days without distribution in December and ten in January, leading to lowaverage results typical of systematic power failures inconjunction with other technical problems.High lift3pumps605040302pumps1 ure 2Hours of operation of the low-lift and high-lift pumps5Williamson, D., 1987 “Monrovia Water Supply - Transmission and Distribution”, LWSCInternal Report, March 1987, 28 pp.3
Water quality and chemical treatmenttion. Proportioning was done without benefit of any analytical test, as no Jar test instrument was available.Nevertheless, the water reaching the filters was of quitegood quality, even though the flocculation paddles ofsedimentation basins 1 and 2 were out of order. Mixingbasins 3 and 4 were not equipped with any device, whichdid not produce any significant difference in the results.Aluminium sulphate was added to the water at a rate of10 g/m3, as can be calculated from the daily consumption and from the computed raw water volumes, basedon pumping hours. The values are consistent with previous data and should in principle reflect varying turbidity,but most probably only reflect the variation in the quantities produced.In principle, the technicians based at station’s laboratorycarry out hourly determinations of several parameters:pH, residual chlorine, turbidity, and colour. Fortunately,the raw water is of good quality. Turbidity rarely exceeds20-30 NTU and is easily removed by coagulation withaluminium sulphate. Critical measurements such as theproportioning of aluminium and aluminium residual concentration in the clear water were not performed, as noinstruments were available (visible spectrum photometerand Jar test apparatus). Aluminium was added with theuse of mechanical feeders. The two mechanical feederswere quite corroded and only one was in working condi-Aluminium sulfate dosageWhite Plains WTPg/m3252015105daysGas chlorine dosageWhite Plains sFigure 3, 4Proportioning of aluminium sulphate and 11-900
In the two months following the resumption of water production, the average consumption of aluminium sulphatewas 8.7 kg/1,000 m3 in December and about 6.0 kg/1,000m3 in January. Chlorine was added at a rate varying from 0.6 to 1.0 g/m3, which is confirmed by the roughconcentrations calculated using the previous assumptions. Data on residual chlorine in the network were notavailable and no organised sampling programme wascarried out.The effects of the civil war on powerproductionBefore the civil war, the bulk of Monrovia’s power supply(46 MW base load and 65 MW peak load in 1985) camefrom the Mount Coffee hydroelectric dam on the SaintPaul River, 27 km to the north-east of the city. From Mayto October (rainy season) Mount Coffee provided up to64 MW but this dropped to less than 2 MW at the heightof the dry season. Monrovia’s power needs were thenmet by a disparate assortment of oil burning generatorsat LEC’s (Liberia Electricity Corporation) Bushrod IslandPlant: four BBC (Brown Boveri Co.) diesel (gas) oil-burning turbines, with a total of 68 MW; three B&W (Burmeister& Wain) slow-speed 2-stroke heavy oil-burning diesel engines, of 13.6 MW each (Luke Plant); and two mediumspeed Mitsubishi diesels of 5 MW each (Bushrod Plant).In addition, 15 MW were provided directly to the key consumers under an exchange agreement with Bong Mines.When the civil war reached Monrovia in July 1990, twoB&Ws, both Mitsubishis and one BBC gas turbine wereoperational. Bong Mines was supplying only 7.5 MW because of a transformer failure. On 13 July the Mount Coffee dam collapsed, depriving Monrovia of its principalsource of power. In September a voluntary force was setup to run the Bushrod power station. Mitsubishi Unit 2was severely damaged and beyond repair. One Mitsubishipower generator was in operating condition. B&W Unit 3was reduced to half power due to over-heating problems.Up until 23 November, when the diesel stocks ran out,power for the city was provided mainly by one 15 MWgas turbine. In early December MSF brought in two engineers with direct experience with B&W engines andLuke Unit 3 was restarted. At the end of January the unitagain experienced problems, and again a specialist hadto be brought in this time by UNICEF. By the end of March1991 the Unit was able to produce 8 MW. The Mitsubishiwas used intermittently and produced up to 2.5 MW.The ICRC six-month programme: “Emergency Water and Power supplies forMonrovia”1990, and the threat of epidemic among the population,impelled the ICRC to become more involved in the rehabilitation of the station and in the production of electricity. With unrest limited to a few skirmishes, the ICRCcommitted itself to launching a project aimed at rehabilitating the two diesel-powered electrical generators(Luke plant Units 2 and 3, total capacity 27 MW, plus aMitsubishi unit in fair working condition) and the WhitePlains WTP. The EC provided funds to the tune of 540,000ECUs. The objectives of the ICRC were the following: Overhaul the two diesel-powered electrical generators at Luke plant that operated on heavy oil, which wasavailable in large quantities, and support the staff withincentives; rehabilitate the White Plains station by providing laboratory equipment, tools and incentives for the staff; carry out major repairs on the network;in order to maintain a minimum production of water,at least 30% of the design capacity (20,000 m3/dayor 5.28 MGD) and distribute it to the town’s inhabitants.The programme started in May and was scheduled toend in October 1991, when it would be handed over toUNICEF. The latter was already involved in maintenanceactivities that were carried out by one of its engineers,who also prepared a large part of the inventory of spareparts needed to bring the two units back into regularoperation. The ICRC programme was meant to speedup the intervention, owing to the emergency situation.UNICEF would take over the programme with the aim ofrunning it in a sustainable manner. At the end of theprogramme, the following was achieved: Units 2 and 3 were operational at up to 7-9 MW each.During the project period power production averaged 6.0MW. Fifteen per cent of it was used to produce andpump water into the network, which was operating atan average of 46% of design capacity. An express power line to White Plains was constructed, reducing the amount of power needed to operate the plant. Following the collapse of a sea wall, an emergencyintervention saved the seawater pipeline, delivering cooling water to the two units at Luke plant. Sixty per cent of the plant was cleaned and degreasedto reduce fire hazards. The project supported an average of 140 workers (including 125 permanent LEC workers) who received incentives. Maintenance tools were provided to the station aswell as essential spare parts and lubricating oil.The Luke plant power supplyAn almost total breakdown of electricity production between 5 February and 8 March, poorly motivated WhitePlains plant operators who had not been paid since June5
Figures 5 and 6 show the evolution of power productionduring the project period. During the first three months,Unit 3 bore the brunt of the production. It took almostthree months to bring Unit 2 back into operation, withthe Mitsubishi unit used to maintain power above anaverage of 6 MW. Before the construction of the express line, the circuit that fed the station absorbed 2MW, with the plant requiring about 1.6 MW to run at fullcapacity. Thus some 3.6 MW were necessary to operate White Plains. With the completion of the expressline, demand was reduced to 1.6 MW and could becovered with the Mitsubishi unit alone. The entire intervention was beset by one emergency after the other.For instance, the collapse of a sea wall put the wholeheat exchange system in danger and the pipelines hadto be protected. Oil spillage had to be confined and thewhole plant cleaned up. The plant required constant surveillance and regular maintenance. It constantly neededspare parts that were hard to obtain without the regularinvolvement of an organisation capable of reactingquickly to emergencies.Power production/monthLuke plant pOctmonthsUnit 3Unit 2MitsubishiFigure 5Monthly power production during the duration of the project by unitMonthly * production per UnitFigure 6Monthly hours of production of the different units720 hours (30 days)Unit MayOctSepAugJulJunUnit 3* period taken into account mayexceed the monthly day uction
White Plains WTPThe networkAt the WTP level, spare parts were provided to protectthe circuits of the low-lift pumps, the flocculation and backwash systems were rehabilitated, as were the water leveland flow monitoring instruments. One hundred and sixtyfour MT of Al2SO4 and 3.4 MT of chlorine were deliveredto the stations and the laboratory was equipped with essential instruments, equipment and reagents to monitorthe efficiency of the treatment.A total of more than 25,000 leaks in the distributionsystem were plugged (disconnected) and another 15,000leaks were repaired. It was estimated that about 15,000of the disconnections involved illegal prewar consumers. Many leaks were due to corroded pipes. The principal line valves on the 36" line were rehabilitated andfive protective chambers constructed. Finally, 52standpipes consisting of six faucets each were constructed in selected areas of Monrovia as substitutesfor damaged distribution lines. The location of the standposts is given in the next figure.Figure 7Location of the stand posts constructed during the ICRC emergency programme7
White Plains Water Treatment Station (16 MGAL/day, 60,000 m3/day)Backwash tower and sedimentation basinLow lift pumpsSedimentation basin and paddlesHigh lift pump with diesel generator and electrical motorDiesel powered generators8
The next figure shows the outcome of the programme.The mean monthly production was increased to an average of 46% of design capacity (7.6 MG/day, compared to 16 MG/day) almost reaching 12 MG/day inOctober and November, when the entire project wasput under the supervision of UNICEF. Although averageproduction did increase, daily regularity still dependedon the availability of power. The mean daily productionsshown in the figure do not take into account days without water, or variations between anLWSCICRCDecMGDMean daily productionWhite Plains 1991monthsFigure 8Mean daily production calculated from total monthly productionPrecise figures are lacking, but the regularity of theproduction is probably best appreciated when weeklyproduction hours are plotted (Figure 9). The main reason for fluctuations was power cuts, but also technicalproblems at the station, which were gradually solved orimproved upon. The main objectives of the project werereached, with a mean daily production considerably overthe fixed target of 30% of design capacity, through theimprovement of power production at different Luke Plantunits.Weekly pumping hoursWhite Plains 9wk18wk20wk23wk26wk14wk8wk11wk5wk2wk51wk480weeks 1991Figure 9Number of pumping hours per week9
Alternative sourcesShallow wellsThe vulnerability of Monrovia’s water system convincedthe ICRC that full use had to be made of existing groundwater resources. In December 1990 a programme waslaunched to protect some of the existing wells and to dignew ones, focusing on areas barely supplied by the network and as close as possible to institutions, such asschools, feeding centres, etc.supply from the water treatment plant. These wells werethe only source of water for the entire town, along withthe collection of rainwater during the rainy season. Theimplementation of the ICRC programme was quite slow,as it took some time to identify the locations wherenew wells were to be sunk or rehabilitated and to trainthe teams, recruited among volunteers from the localRed Cross. The location of the wells built or rehabilitated by the ICRC is shown in figure 10 together withwells built by other organisations, and most of the public wells.The total number of hand-dug wells in the city was estimated to be close to 3,000. Four hundred were publicwells and were used during the period when there was noFigure 10Location of ICRC and other wells (UNICEF/AOCF/Other)The wisdom of the well construction policy has been amply vindicated. A survey carried out by the ICRC in September 1991 showed that only about 5% of the population made use of hand pumps (about 20-30,000 people),but about 55% of the population claimed that the waterwas from open wells and roughly 50% received pipedwater. Coverage was poor, but when the power was cutwater from wells and rain was the only resource, and1050% of the population lived on it in any case. A similarsurvey was carried out by SELF, a local NGO, and personnel from the Ministry of Economic Affairs, and theresults were consistent with those of the ICRC, withonly minor discrepancies in the results obtained in proportions by area. In fact, piped water was suppliedmainly to Bushrod Island (through the 16" line) and toSinkor and Paynesville, and only 13% of the inhabitants of Central Monrovia used piped water.
Source of drinking water for MonroviaSELF / MPEA%n 5630 households - July 19916050403020100InsideOutsideClosedPiped waterBushrod IslandCentral ardnersvilleFigure 11Origin of water in several areas of MonroviaBy the end of 1991 a total of 51 shallow wells was completed and equipped with hand pumps (Kardia) and about30 old wells were rehabilitated. The same approach waschosen by UNICEF, with a total of 20 hand-dug wellscompleted, mainly to supply schools. Five wells werecompleted by the Lutheran World Service. The approachwas adopted by other NGOs and it was expected thatthe general condition of the wells would be improved. Atthe end of 1991 LWSC was considered to be in a betterposition to manage water production and distribution.However, the assistance of an organisation capable ofmaking and enforcing the necessary reforms was stillneeded in order to make the best use of the meagre resources and adapt production targets to the new situation.Rainfall collectionAverage yearly rainfall in Monrovia is close to 4,500 mm.Collection of run-off from zinc roofs in buckets, drumsand cisterns is widely practised and, in addition to thewells, permitted the survival of the population of the cityfrom the end of June until November 1990, when distribution ceased completely. In principle, and with proper storage, rainfall would be sufficient to meet the needs of thecity during the dry season. Water should be stored inlarge quantities to allow for consumption between rains.Health problems and water-related diseasesIn early February a survey carried out by MSF-Belgiumamong 302 households representing 4,191 people (3,432adults and 759 children under five years of age) showedthat the mortality rate was roughly 40/1000/year (confidence limits 18 to 62), almost twice the prewar figure of17/1000/year (available for 1986 from the Liberia Demographic and Health Survey statistics), but obviously lessthan the rate observed during the civil war. Twenty percent of people interviewed mentioned diarrhoea as acause of death. Pathologies diagnosed in seven healthclinics that carried out from 5 to 8,000 consultationsper week, from 28.12.1990 until beginning of February,did not show high morbidity patterns for diarrhoea. Thelatter represented about 10% of the total number of consultations, malaria being one of the commonest diseases observed, at between 30 and 35%.A slight increase in diarrhoeal diseases, up to 16% ofcases, was observed in week 6, but data are lacking forthe following period. Diarrhoea with blood representedbetween 4 and 4.6% of reported cases.11
Trend of main diagnosis in OPD 50AnemiaResp.inf.Skin diseases1235000 n 7500 consultations/week4561991789MSF BelgiumFigure 12Trend of main diagnosis in seven health clinics just after the resumption of water distribution from White PlainsThe 1992 water emergency and thebeginning of the water trucking periodWhen the ICRC emergency project ceased, the meandaily production of water distributed to the town fluctuated between 6 and 10 MGD. At the end of OctoberLWSC took delivery of 205 MT of aluminium sulphatepurchased by the interim government, sufficient to coverconsumption for at least six months. The productionfigures were maintained throughout 1992, with UNICEFproviding technical support and equipment. At the sametime, several programmes were started to construct orrehabilitate shallow wells within the city, following theearlier ICRC approach. Besides UNICEF, severalorganisations such as AICF (Action Internationale Contrela Faim), LWF (Lutheran World Federation) and otherprivate agencies were also active in this field. Following the resumption of hostilities, the White Plains WTPwas again damaged and stopped production on 19October. Access to the station was considered too dangerous for normal and regular operation. The city wasleft with shallow wells as its only source of potablewater and many of them would dry up at the onset ofthe dry season.Unable to carry out specific damage assessment, andbearing in mind the needs of the inhabitants and thepossible outbreak of communicable diseases linked withthe lack of water, LWSC and UNICEF decided to launchan emergency water trucking programme. Several technical options were considered: 6 Identification of the main sources of water available inlarge quantities Identification of all water tankers available Organisation of a trucking operation Construction of deep water wells/boreholes Resumption of White Plains water productionThe Interim Government of National Unity was approached to obtain formal approval from the Presidencyfor the requisition of all the water trucks available in thetown, in order to start the water trucking operation. Thelatter was scheduled to last at least six months, theamount of time considered necessary to resume anyactivity at the station, given the extent of the repairsneeded and the delivery time for supplies from abroad.A preliminary survey identified the large-diameter wellscapable of delivering water in sufficient quantities to fillup the tankers in a reasonably short time (less than 30minutes for a 6,000 gallon tanker). During the first twoweeks, when it was difficult to operate outside CentralMonrovia, water was mainly pumped from the well located within the Ministry of Foreign Affairs and thengradually from other locations. The mean output of theseven wells in use was between 15 and 20,000 gal/day(56-75,000 litres). Limits were set on the output yieldsto avoid salt intrusion, and to take into account the effects of the dry season. The location of these wells isgiven in figure 13, together with the position of the mainstorage tanks to be filled by the tankers and from whichthe water would then be distributed to the public. The612UNICEF, Emergency Water Supply Operations for Monrovia, Present status and plans ofaction, December 1992
Figure 13The main large-diametre wells and storage tanks used for emergency water distribution13
total capacity of the water towers and storage tankswas close to 90,000 gallons (330,000 litres) and wouldincrease with the construction of several others at various locations, such as hospitals or clinics.Plans were also made to drill deeper wells in locationswhere boreholes were showing promising results, as inPaynesville or in the area close to the brewery, where aborehole was already in operation. MSF-Belgium wasgiven responsibility for this project and for the selectionof the contractor, but the final selection of the site wasleft to the Ministry of Land, Mines and Energy. A localcontractor was hired immediately to speed up operations and the first borehole was scheduled to be operational by end of January 1993. Twenty trucks were immediately available for the operation, with a total capacity of about 60,000 gallons per trip, later increasedto 71,250 gallons with the rental of four new trucks.Pumping teams were equipped with transfer pumps,chlorination devices and vehicles. The quality of thewater was monitored by UNICEF, which was responsible for the training of the disinfection teams.The operation started on 21 October. An initial targetwas set of over 100,000 gal/day, to be increased gradually up to 160,000 gal/day (600,000 litres), which wasconsidered sufficient for the neediest areas, i.e. thosedepending almost entirely on piped water and withoutany easy access to shallow well water. Twenty-five percent of the water would be delivered to shelters, about10% to hospitals and clinics and the public would receive the remainder. The quantities delivered are givenin the next figure (Figure 14).It took about one month to reach the target of 160,000gal/day (600,000 litres/day), which dropped to an average of between 120,000 and 140,000 gal/day, when thedecision was made to stop distribution on Sundays.On average, 120,000 people were supplied with five litresof potable water per day. According to the above-mentioned survey, these people are probably those entirelydependent on piped water, who live on Bushrod Island,in Sinkor and also in some areas of Central Monrovia.The large majority of the population was still dependen
recent history of the water supply of the town of Monrovia is intimately linked with the onset of the conflict in early January 1990 and with its evolution during the first years of the civil war. The location of the White Plains water treatment plant made it vulnerable to attack by the war-ring factions. The civil war reached Monrovia in June 1990
