Transcription
NameClassDatePopulation EcologyBefore you read the chapter, answer each question with information you know. Afteryou complete the chapter, re-answer the questions using information you learned.How Do Changes in Population SizeRelate to Environmental Conditions?4.1 How do ecologists organize andstudy life?4.2 What are theimportant characteristics of populations?4.3 What factorsdetermine whether,and how, a population’s size changes?What I KnowWhat I LearnedSample answer: Scientistsorganize life by groupingorganisms into categoriesbased on similarities anddifferences.Sample answer: Ecologistsstudy life at differentlevels—individual, population, community, ecosystem, and biosphere. Theystudy how organisms interact at each of these levels.Sample answer: Organisms in populations livetogether and interactwith each other.Sample answer: Populations can be analyzed anddescribed in terms of size,population density, population distribution, andsex ratio.Sample answer: Resourcessuch as food and waterhelp determine if a population size changes.Sample answer: Population growth rate isdetermined by births,deaths, immigration,and emigration.Chapter 4 Study Workbook Copyright Pearson Education, Inc., or its affiliates. All Rights Reserved.56
NameClassDate4.1 Studying EcologyKey ConceptsEcologists study life at many levels, from individual organisms to the entire biosphere.Ecosystems include both biotic and abiotic factors.Organisms depend on resources provided by their habitat for survival.SKILL BUILDERVocabulary PreviewDefine each vocabulary term in your own words. Then, write yourself a quick note onhow you will remember each. One term has been done for you.TermDefinitionHow I RememberEcologyThe study of how organisms interact with each other and with theirenvironmentsSpeciesA group of individuals thatinterbreed and produce fertileoffspringPopulationMembers of a species that live inthe same area at the same timeCommunityAll the populations in a particularareaEcosystemAll the living things and theirphysical environments within aparticular areaI can think about the meaning ofthe word ecosystem by thinkingof ecology and system.BiosphereAll parts of planet Earth that host life,with all of its organisms andenvironmentsI think of bio, which means “life” andsphere, which is a round object, suchas Earth.Biotic factorPart of an ecosystem that is livingor used to be livingBio means “life” and a factor is apart, so a biotic factor is a livingpart of the ecosystem.Accept all reasonable responsesfor How I Remember. A fewsamples are provided.Lesson 4.1 Study Workbook Copyright Pearson Education, Inc., or its affiliates. All Rights Reserved.57
NameClassTermDefinitionDateHow I RememberAbiotic factorPart of an ecosystem that hasnever been livingHabitatThe specific environment in whichan organism livesResourceAnything an organism needsThe word habitat reminds me ofthe word inhabit, which I knowmeans “to live in.”Levels of Ecological OrganizationFor Questions 1 and 2, circle the letter of the correct answer.1. The most basic level of ecological organization is a(n)A. biosphere.B. individual.C. ecosystem.D. population.2. The study of living and nonliving components of a system can best be described as a(n)A. abiotic factor.B. level hierarchy.C. ecosystem ecology.D. organism interaction.3. Describe how a species is commonly defined. Explain why the common definition forspecies may be problematic for some organisms, such as bacteria.A group of organisms that interbreed and create fertile offspring is considered to beof the same species. This definition, however, does not work well for organisms thatdo not reproduce sexually, such as bacteria. Due to problems with the definition,most biologists now define species on the basis of genetic similarity.4. What is community ecology? Give examples.Community ecology is the study of interactions among species. It can be as simpleas how a single bee pollinates a single flower or as complex as how entire herds ofanimals interact as they migrate across a vast desert.Lesson 4.1 Study Workbook Copyright Pearson Education, Inc., or its affiliates. All Rights Reserved.58
NameClassDateBiotic and Abiotic Factors5.Organize InformationFill in the T-chart with examples of abiotic and biotic factors inan ecosystem. Answers will vary. Sample answers appear below.Abiotic FactorsBiotic FactorsOxygenBacteriaWaterRotting InsectspH6. Is a fallen, rotting tree considered an abiotic or biotic factor? Explain.A biotic factor is something that is living or used to be living. A fallen, rotting treewould therefore be considered a biotic factor because it was once living.HabitatFor Questions 7 and 8, complete each statement by writing in the correct word.7. A cloud forest’s soil, rocks, leaf litter, humidity, plant life, and seasonal pools of water are.all part of a toad’s habitat8. Habitats provide organisms with the resourcesfood, shelter, breeding sites, and mates.they need to live, such as9. Compare and contrast an ecosystem and a habitat.An ecosystem and a habitat are similar because they both include the environmentsurrounding an organism. However, unlike an ecosystem, a habitat’s boundarydepends on the particular organism whose habitat it is. A habitat may be a subsetof an ecosystem, or may include many ecosystems.10. Explain the importance of resources and suitable habitats to an organism.An organism’s survival depends on having a suitable habitat where it can live, aswell as the availability of resources within that habitat. Without a suitable habitatand resources, the organism cannot live.11. Name at least two specific elements of the golden toad’s cloud forest habitat.Sample answers: Forest’s soil, rocks, leaf litter, humidity, plant life, seasonal pools ofwaterLesson 4.1 Study Workbook Copyright Pearson Education, Inc., or its affiliates. All Rights Reserved.59
NameClassSKILL BUILDERDateOrganize Information12. Fill in the table to explain how each concept applies to the golden toad.ConceptThe Golden ToadPopulationAll golden toads in the Monteverde region of Costa RicaCommunityAll plants, animals, fungi, and microorganisms in the same area asthe golden toadEcosystemThe surrounding community, plus the physical environment in whichthe golden toad livedHabitatThe Monteverde cloud forestResourceFood, water, living space, and other toads that were matesExtension On a separate sheet of paper, create another table like the one above. Use thesame headings for the left column, but choose a different organism. Write the name ofthe organism at the top of the table and then complete the rest of the table as it applies tothe organism you chose. Check students’ work.4.1SELF-CHECKAnswer the questions to test your knowledge of lesson concepts. You can check yourwork using the answers on the bottom of the page.13. Explain why organization is important to the study of ecology.14. Why are dead or decaying organisms still considered important parts of an ecosystem?15. What makes up an organism’s habitat?13. Ecologists use levels of organization to study how organisms interact with each other and their environment. 14. They are taken in and used as essential materials for living organisms. 15. The specific environment,including biotic and abiotic elements, around an organism makes up its habitat.Lesson 4.1 Study Workbook Copyright Pearson Education, Inc., or its affiliates. All Rights Reserved.60
NameClassDate4.2 Describing PopulationsKey ConceptsThe overall health of a population can often be monitored by tracking how its sizechanges.A population’s density is a measure of how crowded it is.Populations can be distributed randomly, uniformly, or in clumps.Age structure diagrams show the number of males and females in different age groupswithin a population.SKILL BUILDERVocabulary PreviewDefine each vocabulary term in your own words. Then, write yourself a quick note onhow you will remember each. One term has been done for you.TermDefinitionHow I RememberPopulation sizeThe number of individual organisms present in a given populationat a given timeAccept all reasonable responsesfor How I Remember. A fewsamples are provided.PopulationdensityThe number of individuals withina population per unit areaI visualize a very dense forest;there are many trees packed intoa small space.PopulationdistributionHow organisms are arrangedwithin an areaI think of the population structureof my community.Age structureThe relative numbers of organismsof each age within a populationAge structurediagramA visual tool used to show the agestructure of populationsSex ratioA population’s proportion of males tofemalesI recall that a ratio is a proportion between two things and that an organism’s sex refers to whether it is maleor female.Lesson 4.2 Study Workbook Copyright Pearson Education, Inc., or its affiliates. All Rights Reserved.61
NameClassDatePopulation SizeFor Questions 1–3, complete each statement by writing in the correct word.1. When a population size increaseshealthy population.or remains steady, this is often a sign of a2. If a population size begins to declineextinction is coming.rapidly, this can be a signal that3. Instead of counting each organism individually, ecologists use samplingmethods to estimate population sizes.4. Explain why the passenger pigeon, which was once the most abundant bird in NorthAmerica, disappeared completely.People began cutting down the forests where passenger pigeons lived and bred. Thisprovided easy access to the pigeons for hunters, and the pigeons became a popularfood. The population size dwindled to the point that pigeons could no longer formthe large colonies they required to breed effectively, so they became extinct.5. Describe how you could determine the population size of a specific type of plant in a largeforest without counting all of the plants.You could count the number of the specific plant type in a small section of the forestand then multiply that amount to estimate the total number in the forest.Population DensityFor Questions 6 and 7, circle the letter of the correct answer.6. A population’s density describes howA. old the population is.B. crowded the population is.C. big the population is.D. fast the population is declining.7. Which piece of information is used along with population size to calculate populationdensity?A. areaC. ageB. weightD. location8. How can high population density be helpful to a population?It can make it easier for organisms to form groups and find mates.9. How can high population density be harmful to a population?Organisms must compete with each other for limited resources. Also, organisms witha high population density are often more vulnerable to predators and diseases.Lesson 4.2 Study Workbook Copyright Pearson Education, Inc., or its affiliates. All Rights Reserved.62
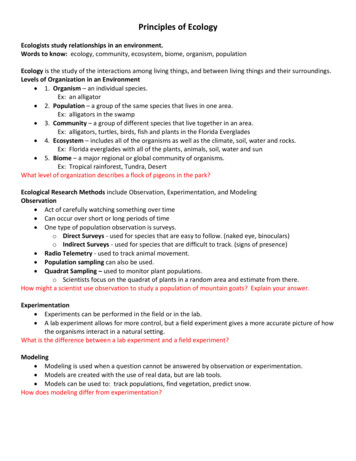
NameClassDatePopulation Distribution10.Fill in the cluster diagram with short descriptions or drawingsof the different types of population distribution.Organize InformationIndividualsare spaced outevenly.Individuals arearranged inno particularpattern.UniformTypes e arrangedaround sourcesof resources.11. Which type of population distribution is found most often in nature?ClumpedAge Structure and Sex Ratios12. Describe how to use an age-structure diagram to determine how many males and femalesare in a population.Horizontal bars extending to the left at each age range indicate the number ofmales, while bars extending to the right indicate the number of females. To find thetotal number of males or females in a population, add all the bars on each side.13. What will happen to a population made up mostly of individuals that are past reproductiveage? It will decline over time.14. What can you predict about a population with an age-structure diagram shaped like apyramid? It will experience rapid growth.Lesson 4.2 Study Workbook Copyright Pearson Education, Inc., or its affiliates. All Rights Reserved.63
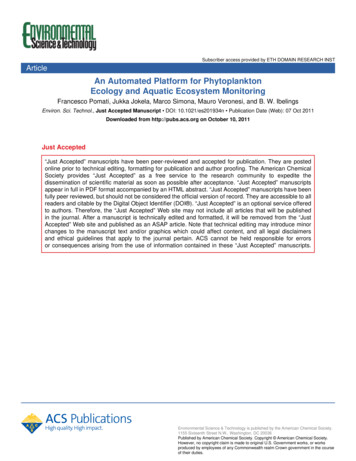
NameClassSKILL BUILDERDateThink Visually15. Use dots to represent individuals in populations as you contrast the populationcharacteristics in each set below.A. Population Size B. Population Density small population large populationlow density high densityC. Population Distribution clumped distribution random distribution4.2uniform distributionSELF-CHECKAnswer the questions to test your knowledge of lesson concepts. You can check yourwork using the answers on the bottom of the page.16. Which way of describing a population would be more informative in terms of availableresources—population size or population density? Explain.17. Describe how you might use population distribution to find the sources of food or otherresources used by a species.18. Explain the significance of an age-structure diagram in which the bars are short along oneside and long on the opposite side.16. Population density better indicates the quantity of room and resources available, since it indicates howmany organisms are living in a specific area. 17. Populations often distribute themselves according to locationof resources. In random or uniform distribution, resources may be widely available; however, if a populationis distributed in clumps, these clumps will likely indicate the location of available resources. 18. This indicatesthat the population consists mostly of either males or females. It may also indicate that the population will notbe as successful in reproducing.Lesson 4.2 Study Workbook Copyright Pearson Education, Inc., or its affiliates. All Rights Reserved.64
NameClassDate4.3 Population GrowthKey ConceptsA population’s growth rate is determined by births, deaths, immigration, andemigration.Populations can grow exponentially or logistically.Limiting factors and biotic potential regulate a population’s growth.SKILL BUILDERVocabulary PreviewDefine each vocabulary term in your own words. Then, write yourself a quick note onhow you will remember each. One term has been done for you.TermDefinitionHow I RememberSurvivorshipcurveGraph that shows how the likelihood of death varies with ageAccept all reasonable responsesfor How I Remember. A fewsamples are provided.ImmigrationThe arrival of individuals from outsidea given areaThe prefix im– reminds me of “in.”That helps me remember that immigration is individuals coming into anarea.EmigrationThe departure of individuals froma given areaI think of the letter E, which isalso at the beginning of the wordexit. That helps me rememberwhat emigration means.MigrationA seasonal movement into andout of an areaI picture birds migrating in thefall.ExponentialgrowthWhen a population increases by afixed percentage each yearLimiting factorA characteristic of the environment that limits populationgrowthLesson 4.3 Study Workbook Copyright Pearson Education, Inc., or its affiliates. All Rights Reserved.65
NameClassTermDateDefinitionHow I RememberCarryingcapacityThe largest population size agiven environment can sustainablysupportI think of the most I can carrybeing my carrying capacity. Thishelps me remember the definition.Logistic growthHow a population’s initial exponential increase is slowed andfinally stopped by limiting factorsDensitydependentfactorA limiting factor whose influence changes with the populationdensityDensityindependentfactorA limiting factor whose influence isunaffected by population densityBiotic potentialThe maximum ability to produceoffspring in ideal conditionsSKILL BUILDERReading StrategyAs you read the lesson, complete the main ideas and details chart.Main IdeasImportant factorsdetermine populationgrowth.DetailsAnswers will vary. Sample answers appear below.Natality and mortality of the population are factors in theincrease or decrease in growth.Survivorship curves show how the likelihood of death varies with age.Immigration and emigration of organisms contribute to thegrowth or decline of a population.Populations growexponentially orlogistically.Exponential growth occurs when a population increases by a fixedpercentage each year.Logistic growth occurs when the initial exponential growth isslowed or stopped by limiting factors.A population’s growth Limiting factors determine how much population growth isis regulated byslowed.limiting factors andbiotic potential.Limiting factors can be density-dependent or density-independent.Biotic potential is the maximum ability to produce offspring inideal conditions.Lesson 4.3 Study Workbook Copyright Pearson Education, Inc., or its affiliates. All Rights Reserved.66
NameClassDateFactors That Determine Population GrowthFor Questions 1 and 2, complete each statement by writing in the correct word.1. Populations increaseleave it.when more individuals enter the population than2. Populations decreasewhen more individuals leave the population thanenter it.3. Explain how a population would be affected when the birthrate is significantly higher thanthe death rate and there are no changes due to immigration or emigration.The size of the population will increase.4. Describe how emigration and immigration affect the size of a population.Emigration occurs when individuals depart from an area, causing the populationsize to decrease. Immigration occurs when individuals arrive, causing the populationsize to increase.5. Explain how migration causes population size to change cyclically over time.Migration occurs as organisms move in and out of an area in a seasonal pattern.The arrivals create an increase in population size and the exits cause a decrease. Inthis manner, the population size increases and decreases in a regular pattern.How Populations Grow6. Describe the shape of a graph curve indicating exponential growth and a graph indicatinglogistic growth.Exponential growth: J-shaped; logistic growth: S-shaped7. Explain how the availability of resources in the environment is linked to exponentialgrowth of a species.Exponential growth occurs when resources in the environment are abundantly available to a species.8. Describe how you can recognize where the carrying capacity for a population occurs on alogistic growth curve.It occurs where the line flattens out after curving upward.9. Compare and contrast exponential growth and logistic growth.Sample answer: Exponential growth usually is short lived and occurs when a population increases by a fixed percentage. In logistic growth, the population rises sharplyat first, then levels out as the effects of limiting factors get stronger.Lesson 4.3 Study Workbook Copyright Pearson Education, Inc., or its affiliates. All Rights Reserved.67
NameClassDate10. Explain how the carrying capacity for a population can change over time.Limiting factors in nature change constantly, so the carrying capacity also changes.As more resources or space become available, the carrying capacity can increase.As predators increase or resources become less available, carrying capacity candecrease.Limiting Factors and Biotic Potential11. Circle the factors below that are density-dependent.climate change disease flood predation12. Explain why a forest fire is considered to be a density-independent limiting factor.A forest fire causes a dramatic, sudden reduction in population size. It affects allpopulations in this way, regardless of whether they are big or small.13. Give two examples of organisms that differ greatly in their biotic potential.Organisms such as humans or orangutans have low biotic potential because they produce only one or a few offspring at a time and have a limited time span to produceoffspring. Organisms such as bacteria or scorpion fish have high biotic potential; theycan produce hundreds of thousands of offspring frequently and with short gestation.4.3SELF-CHECKAnswer the questions to test your knowledge of lesson concepts. You can check yourwork using the answers on the bottom of the page.14. List two factors that increase the growth rate of a population and two factors that decreasethe growth rate of a population.15. Describe the effects that limiting factors and biotic potential have on a population’sgrowth.14. Increase: high birthrates, immigration; decrease: high death rates, emigration 15. Limiting factors slowpopulation growth and determine the maximum amount of growth possible in a population. Biotic potentialdetermines the maximum ability to produce offspring under ideal conditions.Lesson 4.3 Study Workbook Copyright Pearson Education, Inc., or its affiliates. All Rights Reserved.68
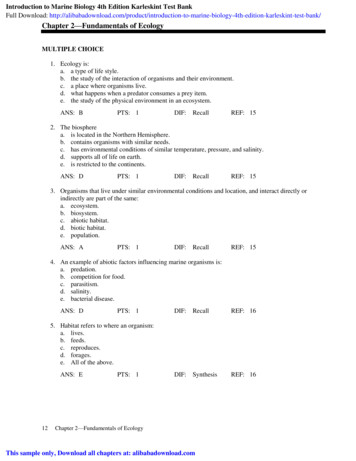
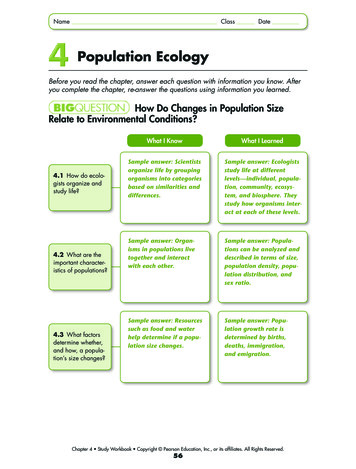
ClassNameDateReal DataTMA H0Turkey VulturesTurkey Vultures per Survey, 1992–2008Average Numberof Vultures per SurveyThe graph at the right shows theaverage number of turkey vulturesthat were counted on protectedlands at the Hawk MountainSanctuary in Pennsylvannia. Inthis activity, you will interpret thegraph by describing the trends thatit shows and drawing conclusionsabout the annual migration cycle ofturkey vultures.0PORTSUP4035302520151050Early monthLate monthJFMAMJJASONDMonthData from Hawk Mountain Data ArchivesInterpreting the GraphTo understand the information in a graph, the first step is to figure out the information thatit shows. Study the axes and note the trend shown by the graph.1. What do the x and y-axes show? X-axis: months in a year, y-axis: average number ofvultures per survey2. What do the two bars for each month represent? Light bars are the early part of eachmonth; dark bars are the late part.3. To describe the annual trend in the graph, look at the overall changes in the bar heightover the entire year. Describe what you see. The population is very small in winter. Itjumps in late February, then increases through August. In early September it jumps0133724751a303again.ck The population is larger in September and October.02.16.10Inferring From the GraphTurkey vultures migrate from the north onto the sanctuary lands and reside there for a whilebefore migrating south. You know that when the vultures migrate through the sanctuary, theywill increase the population size. Answer the questions below to help you identify when thevultures migrated through the sanctuary.4. In which two months is the turkey vulture population significantly greater than in theother months? September and October5. When would you conclude that the vultures migrating from the north arrive at thesanctuary? Early September6. When would you conclude that the vultures leave the sanctuary and begin to migratesouth? Early NovemberReal Data Math Support Study Workbook Copyright Pearson Education, Inc., or its affiliates. All Rights Reserved.69
NameClassDateChapter Vocabulary ReviewMatch each term with its definition.d1. immigrationg2. sex ratiok3. populatione4. habitatl5. population distributionh6. limiting factori7. communitya8. ecosystemc9. carrying capacityf10. exponential growthb11. population densityj12. speciesa. all the living things and their physicalenvironments within a particular areab. the number of individuals within apopulation per unit areac. the largest population size that anenvironment can sustainably supportd. the arrival of individuals from outside anareae. the specific environment in which anorganism livesf. occurs when a population increases by afixed percentage each yearg. the proportion of males to females in apopulationh. characteristic of the environment thatrestricts population growthi. all the populations in a particular areaj. a group of individuals that interbreed andproduce fertile offspringk. members of a species that live in thesame areal. how organisms are arranged within anareaUse each vocabulary term in a sentence.13. abiotic factor Sample answer: Some of the abiotic factors in my environment are thewarm temperatures, the sandy soils, and the river that flows by my house.14. age structure Sample answer: The age structure of the population of rabbits showedthat the population was mostly made up of young rabbits.15. density-dependent factor Sample answer: Competition is a density-dependent factorin a population because its influence changes with the population density.EXTENSION On a separate sheet of paper, create a simple illustration of an ecosystem.Choose five or more vocabulary terms from the chapter to include as labels in yourillustration. Check students’ work.Vocabulary Review Study Workbook Copyright Pearson Education, Inc., or its affiliates. All Rights Reserved.70
NameClassDateFinding Gold in a CostaRican CLOUD FORESTThe Disappearance of the Golden ToadWhat can cause a thriving population ofanimals to disappear in the span of one ortwo years? In the case of the golden toadof Monteverde in Costa Rica, thousandsof toads were initially observed during themating season each year. Then one year,there were only a few toads. Two years later,only a single toad was observed, and thenthe toads disappeared completely.Environmental Changesin altitude. This caused a decrease in themoisture provided by mist in the forests. Asthis misty cloud atmosphere rose and waslost, the environment suffered—as plantsand animals died off due to the drier climate.This series of events can occur repeatedly.Many scientists link such series ofevents to global warming. Others state thatthe rising cloud base could be caused bydeforestation and other human activities.New information also points to anotherpossible scenario that may have killed offthe toad. The years following 1986–1987were exceptionally dry, due to changes inatmospheric and oceanic patterns relatedto a phenomenon known as El Niño. Theexceptional climate conditions duringthat period could have contributed to thegrowth and spread of a deadly pathogen—the chytrid fungus—to which the toadwas susceptible. The chytrid fungusgrows rapidly in warm, dry climates. Thefungus has caused declines in amphibiansthroughout Costa Rica and may havewiped out the golden toad as the weatherin the region became warmer and drier.Scientists warn that although amphibiansin this ecosystem are the first organisms todisappear when environmental conditionschange, other species of organisms andplants may follow.How the golden toads could disappear soquickly is puzzling, but the case is even moremysterious because the habitat of the goldentoad was within a large nature preserve.Often, animal populations are devastatedas humans or natural disasters destroy theirhabitats. But this was not the case in theprotected Monteverde Cloud Forest Reserve.Although the toad’s environment was notbeing visibly destroyed, it was changing insubtle ways. For instance, when scientistsgathered data on the toad’s environment,they noticed a significant increase inthe number of “dry days.” A “dry day” isdesignated as a run of five or more dayswithout measurable rain. These dry daysresulted in a decrease of available moisture.Because toads and other amphibiansreproduce and live parts of their livesin water, the amount of moisture in theenvironment affects them to a greater degreethan it affects many other species. Of the 50species of frogs and toads in the study area,20—including the golden toad—disappearedduring the same time frame.The Lifting Cloud Base Hypothesishas been proposed to explain thiswidespread amphibian loss in the cloudforest. According to the hypothesis, as thenumber of “dry days” increased, the baseof the clouds that hung over an area roseCentral Case Activity Support Study Workbook Copyright Pearson Education, Inc., or its affiliates. All Rights Reserved.71
NameClassDateUse the information in The Disappearance of the Golden Toad to answer the questions below.1. How many golden toads could be observed during mating season when the toad’spopulation was thriving? Thousands2. Based on the golden toad population’s habitat, why was extinction of the golden toadpuzzling? Sample answer: The habitat of the golden toad population was in aprotected environment. There was no development or destruction of the habitat.3. Explain why it was significant that large numbers of other frogs and toads became extinctat the same time the golden toads disappeared.Sample answer: The extinction of other frog and toad species would seem to indicate that an essential factor common to amphibians was responsible.4. Explain what happens to cloud mist as the number of “dry days” increases.As the number of “dry days” increases, the cloud mist that hangs over an area rises.5. Assuming the Lifting Cloud Base Hypothesis to be correct, which part of the Monteverdecloud forest would likely be the least affected by the decrease in moisture? Explain.Sample answer: The upper area that is still surrounded by the cloud base wouldlikely be the least affected, as it would hold more moisture than the area below.6.Relate this case to the Big Question: “How do changes in population sizerelate to environmental conditions?” Describe the sequence of events that could have ledto the extinction of the golden toad, according to the Lifting Cloud Base Hypothesis.Sample answer: As global temperatures increased, the climate became drier inthe cloud forest. As the climate became drier, the cloud mist shrank and retreatedupward. As the cloud mist retreated upward, the habitat of the golden toad becameless hospitable, and it began to die out.Find out more about other extinctions that occurred in the Monteverde region during thistime period. Work in small groups to use the Internet and other resources to learn more aboutwhat caused the extinctions you have been studying. Each group should create a poster orpresentation to share with the class.The 21st Century Skills used in this activity include Communication and Collaboration,Information Literacy, and Productivity and Accountability.Log on for more information and activities on the CentralCase, Finding Gold in a Costa Rican Cloud Forest.Central Case Activity Support Study Workbook Copyright Pearson E
A biotic factor is something that is living or used to be living. A fallen, rotting tree would therefore be considered a biotic factor because it was once living. Habitat For Questions 7 and 8, complete each statement by writing in the correct word. 7. A cloud forest's soil, rocks, leaf litter, humidity, plant life, and seasonal pools of .