Transcription
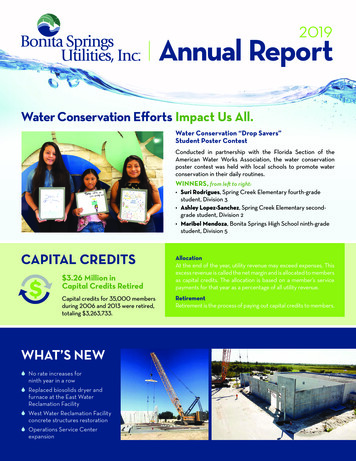
2019Annual ReportWater Conservation Efforts Impact Us All.Water Conservation “Drop Savers”Student Poster ContestConducted in partnership with the Florida Section of theAmerican Water Works Association, the water conservationposter contest was held with local schools to promote waterconservation in their daily routines.WINNERS, from left to right: Suri Rodrigues, Spring Creek Elementary fourth-gradestudent, Division 3 Ashley Lopez-Sanchez, Spring Creek Elementary secondgrade student, Division 2 Maribel Mendoza, Bonita Springs High School ninth-gradestudent, Division 5CAPITAL CREDITS 3.26 Million inCapital Credits RetiredCapital credits for 35,000 membersduring 2006 and 2013 were retired,totaling 3,263,733.WHAT’S NEWS No rate increases forninth year in a rowS Replaced biosolids dryer andfurnace at the East WaterReclamation FacilityS West Water Reclamation Facilityconcrete structures restorationS Operations Service CenterexpansionAllocationAt the end of the year, utility revenue may exceed expenses. Thisexcess revenue is called the net margin and is allocated to membersas capital credits. The allocation is based on a member’s servicepayments for that year as a percentage of all utility revenue.RetirementRetirement is the process of paying out capital credits to members.
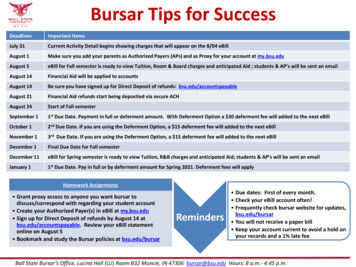
MESSAGE FROM PRESIDENTBrian FarrarI’m proud to report that BSU has had another strong year. Excellent customer service, award-winning operationsand solid financial performance all indicate the position we’re in. We continue to hold the line on rates for ourmembers – something that continues to be an important focus for the board.The board approved the second-ever capital credit retirement in the utility’s history. 3.26 million in capitalcredits were retired for 35,000 members during 2016 and 2013. This is an important initiative that we intendto continue in future years to bring capital credit retirements current.We’re also in the process of refinancing the utility’s Series 2010 revenue bonds. Once the refinancing is completein 2020, we’ll be able to realize significant savings over the remaining term of the bond – approximately 10million.The Board of Directors represents members’ interests – your interests – in this utility. As we move into the nextdecade, I am fully confident that this utility will continue to deliver high-quality water and wastewater servicethat our members expect and appreciate.It’s been a privilege to serve as your board president for the past year.Thank you.FROM EXECUTIVE DIRECTORJohn R. JenkinsThe South Florida Water Management District is the state agency responsible for safeguarding and restoringSouth Florida's water resources and ecosystems, protecting our communities from flooding, and meeting theregion's water needs. A few years ago, the District updated its Lower West Coast Water Supply Plan.The plan tells us that South Florida is particularly vulnerable to the effects of potential changes in climate andsea level because of its location, hydrology, coastal population and other factors. Sea level rise may push saltwaterfarther inland and threaten the water quality in our surficial aquifer system. This is an important water sourcefor many utilities, including BSU. At the same time, warmer air temperatures and changes in rainfall patterns mayincrease irrigation demand by both agricultural and urban users.Simply put, we can expect increasing pressure on our water supply. Our ability and willingness to respond, onboth the supply side by BSU and on the demand side by our customers, will determine the ultimate impact onour quality of life. For example, as much as 50% of potable water use can be attributed to lawn and ornamentalirrigation. Increased use of xeriscape and landscape design requiring little irrigation offers a ready solution.Each of us can and should act to protect our precious water resource.The 2019-2020Board of DirectorsStanding, left to right: Vice President Vicent Marchesani,Secretary Paul Attwood, Ben Nelson, Frank Liles,President Brian FarrarSeated, left to right: Robert Bachman, James Strecansky,Treasurer Mike Malloy, Robert SharkeyTHANK YOU to James Strecansky and Robert Sharkey for their yearsof Board Service. They will be missed.James served on the Board for 12 years, with terms as president and vice president.JamesRobert served on the Board for 11 years and recently served as secretary.Strecansky2RobertSharkey
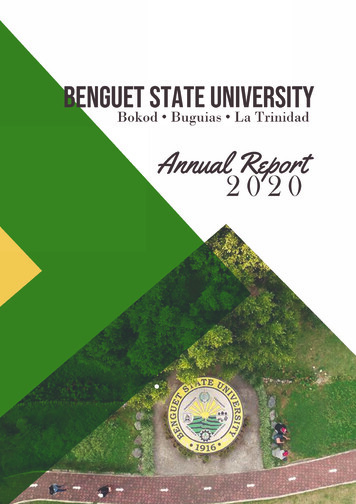
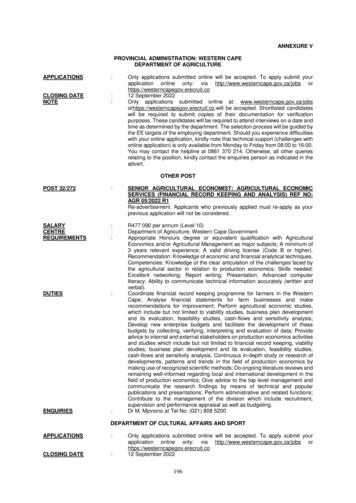
AWARDING EXCELLENCEBSU received two awards for outstanding accomplishmentsfrom the Florida Water Environment Association.Our wastewater treatment team received the 2019 Earle B. çPhelps Award in the secondary wastewater treatment plantscategory, which recognizes wastewater treatment facilities thathave maintained the highest removal of major pollution-causingconstituents prior to discharging treated effluent for irrigationreuse.ç East Water Reclamation Facility LeadOperator Jake Hepokoski receivedthe prestigious 2019 Leroy H. ScottAward for exceptional contribution toFWEA operators and did the best jobof managing a plant.BSU was awarded the 2018 Safety Award for Utility of the çYear from the Florida Water and Pollution Control OperatorsAssociation for its outstanding safety record.BSU by the Numbers 29,950 Members served by 130 employees 66,000 Phone calls received by Customer Service 30,000 Service ordersè Lisa Karnow, Customer Service20192018Total Water Production3.64 billion gallons3.68 billion gallonsAverage Daily Water Production9.97 million gallons10.08 million gallons(March 27) 13.97 million gallons(Oct. 24) 13.3 million gallons1.7 billion gallons1.65 billion gallons4.67 million gallons4.53 million gallons(Jan. 22) 6.84 million gallons(March 10) 6.17 million gallonsPeak Day Water ProductionWastewater EffluentAverage Daily Wastewater EffluentPeak Day Wastewater Effluent Flow3
FINANCIAL Report Steven Richards, CPA Director of FinanceThe following pages summarize the financial position, results of operations, changes in members’ equityand cash flows for Bonita Springs Utilities, Inc. for the years ended December 31, 2019 and 2018.The utility’s total assets increased 3.9 million (1.1%) to 370.6 million from 2018 to 2019. The utility’s total liabilities decreased 4.2 million (4.9%) to 82.4 million, mainly due to the regularly scheduled principal payments on revenue bonds. Members’equity increased 2.9% to 288.2 million as a result of the net margin totaling 1.5 million, 9.8 million of capital contributions and 3.3 million of capital credit retirements.The utility’s operating revenues increased approximately 675,000 (1.7%) from 2018 to 2019. Total operating expensesincreased 1.7 million (4.4%) from 2018 to 2019, due in part to increased chemical cost and usage, increased labor costs, and anincrease in depreciation expense totaling approximately 775,000 due to the completion of several large construction projects.The net margin totaled 1.5 million for 2019, as compared to the 1.8 million net margin in 2018. This change was due to a decreasein the operating margin totaling approximately 983,000, an increase in debt expense of approximately 117,000 and an increasein other income totaling approximately 800,000, due in part to increased earnings on the utility’s investment portfolio.Pursuant to Internal Revenue Code requirements, the utility continued its capital credit retirement program during 2019.Capital credits retired totaled 3.3 million. These credits were allocated to members for qualifying years 2006 and 2013.Current members received a credit on their account, while former members have payment made available to them by check.In 2019, the Company entered into an agreement to refinance its Series 2010 revenue bonds. The bonds will be refinancedin August 2020, reducing the interest rate to 2.04% while saving the utility approximately 10 million in cash over the remainingterm of the bond.With its strong financial position, strong debt service coverage and solid credit ratings (Standard & Poor’s/AA, Moody’s/Aa3),the utility remains well-positioned to continue the same high level of service our members expect.The summary financial statement balances presented in this annual report are in agreement with the financial statementsaudited by Nichols, Cauley & Associates, LLC, Certified Public Accountants, which are contained in the utility’s 2019 audit report.The complete audit report, including Notes to Financial Statements and Supplemental Information, is available upon request.BalanceSheetsDecember 31, 2019and 2018ASSETS20192018Utility Plant, Property, and Equipment, at CostNet of Accumulated Depreciation 279,809,370 280,640,785Restricted Cash and InvestmentsCash and Cash Equivalents6,302,3186,176,348Total Restricted Cash and Investments6,302,318 6,176,348Current AssetsCash and Cash Equivalents29,091,264 23,583,645Investments40,792,071 40,598,467Accounts Receivable, Net2,271,3122,376,433Unbilled Accounts Receivable1,467,1581,284,794Material and Supplies Inventory563,497536,761Prepaid Expenses404,561509,543Prepaid Bond Issuance Costs43,919Interest Receivable172,199197,687Special Service Charges Receivable - Current606,300594,125Other Receivables14,00616,421Total Current Assets75,426,287 69,697,876Other AssetsUtility Deposits25,20524,947Capital Deposits64,444450,781Special Service Charges Receivable - Noncurrent8,942,187 9,728,500Total Other Assets9,031,836 10,204,228Total Assets 370,569,811 366,719,2374
MEMBERS’ EQUITY AND LIABILITIES20192018Members' EquityMembers' Investment Certificates 4,205,271 4,205,271Contributed Capital145,512,804 135,671,974Retained Earnings138,495,764 140,272,474BalanceSheetsDecember 31, 2019and 2018Total Members' Equity288,213,839 280,149,719Long-Term LiabilitiesRevenue Bonds, Series 201046,102,285 48,645,306Revenue Bond, Series 2012B5,384,7687,115,961Revenue Bond, Series 20146,443,1607,980,193Deferred Special Service Charge Income - Noncurrent8,942,1879,728,500Injection Well Retirement Obligation466,327377,278Total Long-Term Liabilities67,338,727 73,847,238Current Liabilities Payable FromRestricted AssetsAccrued Bond Interest407,910431,675Long-Term Liabilities - Current Portion5,700,000 4,825,000Total Payments Payable from Restricted Assets6,107,910Current LiabilitiesAccounts Payable2,215,401Retainage Payable442,812Members' Capital Credit Payable1,759,455Customer Deposits2,897,642Other Current Liabilities987,725Deferred Special Service Charge Income - 54,469808,854594,125Total Current Liabilities8,909,335 7,465,605Total Liabilities82,355,972 86,569,518Total Members' Equity and Liabilities 370,569,811 366,719,2375
Statements ofRevenuesandExpensesYears EndedDecember 31, 2019and 201820192018Operating RevenuesWater Sales 17,259,626 16,873,650Wastewater Sales22,406,373 21,837,676Other Fees1,417,525 1,697,298Total Operating Revenues41,083,524 40,408,624Operating ExpensesPlant:Distribution and Collection System Costs4,043,788 4,025,579Plant Operating Costs8,095,842 7,814,419Engineering1,105,445 1,221,227Depreciation17,230,973 16,455,951Total Plant30,476,048 29,517,176General and Administrative:Management and Office Costs2,464,903 2,249,762Administrative and Personnel6,559,759 6,075,824Total General and Administrative9,024,662 8,325,586Total Operating Expenses39,500,710 37,842,762Operating Margin1,582,814 2,565,862Other Income (Expenses)Investment Earnings2,152,723 1,051,719Other Non-Operating Income243,856 638,772Gain (Loss) on Sale of Fixed Assets(119,851) (212,711)Total Other Income2,276,728 1,477,780Debt ExpenseInterest, Amortization and Other2,372,519 2,255,324Net Margin 1,487,023 1,788,318Statements ofChanges inMembers’EquityYears EndedDecember 31, 2019and 2018Members’ InvestmentCertificatesContributedCapital 4,205,271 123,789,591 141,456,681 269,451,543Net Margin--1,788,3181,788,318Contributed Capital-11,882,383Members’ Capital Credits 4140,272,474280,149,719Net Margin--1,487,0231,487,023Contributed Capital-9,840,830Members’ Capital Credits Retired--(3,263,733)(3,263,733) 4,205,271 145,512,804 138,495,764 288,213,839Balance, January 1, 2018Balance, December 31, 2018Balance, December 31, 20196RetainedEarningsTotal--11,882,3839,840,830
20192018Cash Flows From Operating ActivitiesNet Margin 1,487,023 1,788,318Adjustments to Reconcile Net Margin toNet Cash Provided By Operating Activities:Depreciation 17,230,973 16,455,951Amortization, Bond Costs and Other(22,198) (92,385)Loss on Disposal of Fixed Assets119,851212,711Unrealized/Realized (Gain) Loss on Investments(740,133)12,141(Increase) Decrease in Accounts Receivable(1,931,787) (970,497)(Increase) Decrease in Unbilled Accounts Receivable(182,364) 143,347(Increase) Decrease in Materials and Supplies Inventory(26,736)(1,704)(Increase) Decrease in Prepaid Expenses104,982 (58,561)(Increase) Decrease in Interest Receivable25,488 (55,360)(Increase) Decrease in Other Receivables2,41528,014(Increase) Decrease in Utility Deposits(258)(615)Increase (Decrease) in Interest Payable(23,765) (17,985)Increase (Decrease) in Accounts Payable(412,987) 176,451Increase (Decrease) in Customer Deposits(156,827) 54,009Increase (Decrease) in Other Current Liabilities185,48482,159Cash Provided by Operating Activities15,659,161 17,755,994Cash Flows From Investing ActivitiesPurchases of Investment Securities (29,301,644) (22,785,304)Proceeds from Sale of Investment Securities29,848,173 23,066,415Proceeds from Sale of Fixed Assets2,55076,140Capital Expenditures (11,079,490) (20,883,973)Cash Received for Capital Expenditures6,171,255 7,698,289Cash Used in Investing Activities (4,359,156) (12,828,433)Cash Flows From Financing ActivitiesPrincipal Paid on Long-Term Debt (4,825,000) (6,100,000)Cash Paid for Bond Issuance Costs(43,919)Cash Paid for Capital Credit Retirement(797,497) (493,235)Cash Used in Financing Activities(5,666,416) (6,593,235)Net Increase (Decrease) In Cash, Cash Equivalents and Restricted Cash 5,633,589 (1,665,674)Cash, Cash Equivalents and Restricted Cash - Beginning of Year29,759,993 31,425,667Cash, Cash Equivalents And Restricted Cash - End of Year 35,393,582 29,759,993Statements ofCash FlowsYears EndedDecember 31, 2019and 2018Reconciliation Of Cash, Cash Equivalents And Restricted CashPer Statement Of Cash Flows To The Balance Sheet:Cash, Cash Equivalents and Restricted Cash, Beginning:Current 23,583,645 25,056,443Restricted6,176,348 6,369,224Total29,759,993 31,425,667Net Increase (Decrease):Current5,507,619 (1,472,798)Restricted125,970 (192,876)Total5,633,589 (1,665,674)Cash, Cash Equivalents and Restricted Cash, Ending:Current29,091,264 23,583,645Restricted 6,302,318 6,176,348Total 35,393,582 29,759,993Supplemental Schedule of Noncash ActivitiesUtility Plant, Property and Equipmentthrough Accounts Payable and Retainages Payable 1,374,168 433,135Return of Capital to Members through Accounts Receivable Credits 2,130,190 Capital Credit Retirement through Accounts PayableContributed Assets1,149,163 680,073 1,330,127 3,669,575 4,184,094Net New Deferred Special Service Charges Receivable (774,138) (944,288)Supplemental DisclosuresInterest Paid 2,590,722 2,698,6297
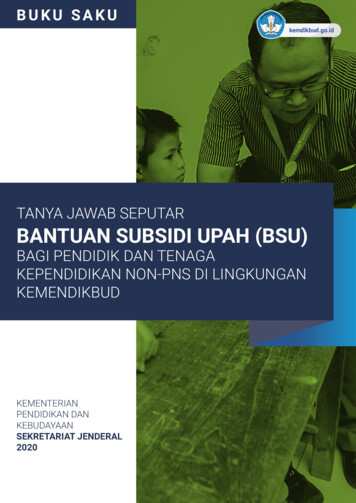
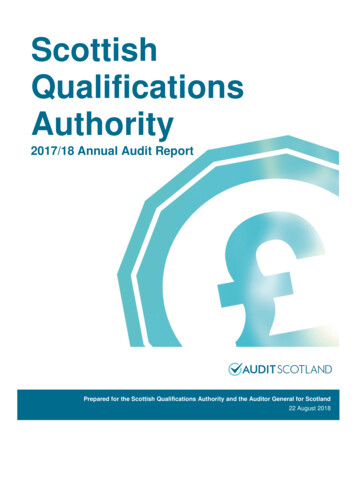
FAREWELL,Hickory Boulevard Water Tower11900 East Terry StreetBonita Springs,Florida 34135239-992-0711800-583-1496www.BSU.usThe 151-foot water storage tank was dismantled and removedfrom Hickory Boulevard in March 2019. The 500,000-gallon waterstorage tank was constructed in 1982 to aid in delivering waterservice to thousands of Bonita Springs residents.In 2006, BSU replaced the aging water main along HickoryBoulevard and established a water interconnect with Fort MyersBeach in 2009, both of which reduced the water tank’s need. Thewater tank was taken out of service in 2014, which helped reduceflushing and improve water quality.OUR MISSIONTo provide safe, reliablepotable water andwastewater treatment,emphasizing responsibleprotection of ourresources at the mosteffective cost to allmembers.Tours & TalksThis report is printedon recyclable paper.Please recycle!We’re onFacebook!Estero High School Leadership students toured theEast Water Reclamation Facility.Follow us for all thelatest news and updates.IN THECall 239-992-0711 to request aBSU tour or presentation for your group.COMMUNITYMember Appreciation Day8Community ExpoBSU-sponsoredwater fountain bottle fillerat theBonita Springs AreaChamber of CommerceCustomer Service CenterRibbon Cutting
3 AWARDING EXCELLENCE BSU by the Numbers 29,950 Members served by 130 employees 66,000 Phone calls received by Customer Service 30,000 Service orders Lisa Karnow, Customer Service 20192018 Total Water Production 3.64 billion gallons 3.68 billion gallons Average Daily Water Production 9.97 million gallons 10.08 million gallons Peak Day Water Production (March 27) 13.97 million gallons (Oct. 24 .