Transcription
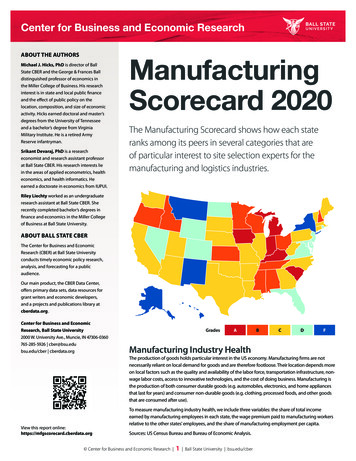
Center for Business and Economic ResearchABOUT THE AUTHORSMichael J. Hicks, PhD is director of BallState CBER and the George & Frances Balldistinguished professor of economics inthe Miller College of Business. His researchinterest is in state and local public financeand the effect of public policy on thelocation, composition, and size of economicactivity. Hicks earned doctoral and master’sdegrees from the University of Tennesseeand a bachelor’s degree from VirginiaMilitary Institute. He is a retired ArmyReserve infantryman.Srikant Devaraj, PhD is a researcheconomist and research assistant professorat Ball State CBER. His research interests liein the areas of applied econometrics, healtheconomics, and health informatics. Heearned a doctorate in economics from IUPUI.ManufacturingScorecard 2020The Manufacturing Scorecard shows how each stateranks among its peers in several categories that areof particular interest to site selection experts for themanufacturing and logistics industries.Riley Liechty worked as an undergraduateresearch assistant at Ball State CBER. Sherecently completed bachelor’s degrees infinance and economics in the Miller Collegeof Business at Ball State University.ABOUT BALL STATE CBERThe Center for Business and EconomicResearch (CBER) at Ball State Universityconducts timely economic policy research,analysis, and forecasting for a publicaudience.Our main product, the CBER Data Center,offers primary data sets, data resources forgrant writers and economic developers,and a projects and publications library atcberdata.org.Center for Business and EconomicResearch, Ball State University2000 W. University Ave., Muncie, IN 47306-0360765-285-5926 cber@bsu.edubsu.edu/cber cberdata.orgGradesABCDFManufacturing Industry HealthThe production of goods holds particular interest in the US economy. Manufacturing firms are notnecessarily reliant on local demand for goods and are therefore footloose. Their location depends moreon local factors such as the quality and availability of the labor force, transportation infrastructure, nonwage labor costs, access to innovative technologies, and the cost of doing business. Manufacturing isthe production of both consumer durable goods (e.g. automobiles, electronics, and home appliancesthat last for years) and consumer non-durable goods (e.g. clothing, processed foods, and other goodsthat are consumed after use).View this report online:https://mfgscorecard.cberdata.orgTo measure manufacturing industry health, we include three variables: the share of total incomeearned by manufacturing employees in each state, the wage premium paid to manufacturing workersrelative to the other states’ employees, and the share of manufacturing employment per capita.Sources: US Census Bureau and Bureau of Economic Analysis. Center for Business and Economic Research 1 Ball State University bsu.edu/cber
About the GradesThe categories in this report were chosen as those most likely to be considered by siteselection experts for manufacturing and logistics firms, and by the prevailing researchon economic growth.Each category included multiple variables for each state that were aggregated andthen ranked 1st through 50th, with 1st being the most desirable. Within each category,the lowest aggregate score assigned provided the overall rank. Grades were assignedA through F using a normal distribution of grades commonly known as a bell curve.Plus and minus scores were not assigned to A or F grades.GradesABCDFLogistics Industry HealthHuman CapitalThe movement of goods is of central importance to the production ofgoods. Without a robust logistics industry, manufacturing and commodityproduction will not occur. Logistics comprises not merely the capacityto move goods, but to store inventory and manage the distribution andprocessing of manufactured goods. Logistics firms depend upon manyof the same factors as manufacturing firms in their location decision, butthere is a more complex interplay between local conditions and the existingor planned transportation networks of roads, railroads, waterways, andairports.No factor matters more to businesses than the quality and availability oflabor. Workers represent the largest single cost of doing business, but,more importantly, they are the source of most innovation and processimprovements that distinguish successful firms from those that arenot successful. Because produced goods have a high degree of valuedependent on each individual worker in a production line or transportationleg or hub, a uniformly high quality of workers is required. These workersmust possess the ability to understand increasingly complex productionprocesses that today are mostly managed by computers with specializedsoftware. The factories, rail yards, distribution facilities, and machine shopsof today are highly technical and complex, and they are dependent onworkers who can work successfully in this environment. Human capital(especially education) is the most important factor in firm locationdecisions.To measure the health of the logistics industry, we include the share oftotal logistics industry income as a share of total state income, and theemployment per capita. We also include commodity flows data by bothrail and road. To this we measure infrastructure spending as the per capitaexpenditure on highway construction.Our human capital measurements include rankings of educationalattainment at the high school and collegiate level, the first-year retentionrate of adults in community and technical colleges, the number ofassociates degrees awarded annually on a per capita basis, and the share ofadults enrolled in adult basic education.Sources: US Census Bureau, Bureau of Economic Analysis, and USDepartment of Transportation Center for Transportation Statistics.Sources: National Center for Educational Statistics and US Census Bureau. Center for Business and Economic Research 2 Ball State University bsu.edu/cber
Worker Benefit CostsNon-wage labor costs represent an increasingly important part of totalbusiness costs. These are affected by local and state public policy (laws), aswell as worker demographics and condition of health, and the performanceof firms and industry. Benefits range from a variety of health care issues toliability and casualty insurance, workers’ compensation, and other costsincluding retirement and other fringe benefits.To measure benefit costs, we include data on health care premiums andlong-term health care costs, workers’ compensation costs per worker, andfringe benefits of all kinds as a share of worker costs.Sources: American Association of Retired Persons (AARP), Bureau ofEconomic Analysis, IMPLAN, and authors’ calculations.Tax ClimateExpected Fiscal Liability GapFew factors garner as much policy interest as do state and local taxes. Forfirms that may operate virtually anywhere, tax rates (along with the qualityof local public goods) matter a great deal in location decisions. Businesstaxes, individual income taxes (both on workers and small business), sales,unemployment, insurance and property taxes all play a role in assessingregions for a potential employer location.State and local governments throughout the US purchase bonds forinfrastructure improvement and provide pensions and health care forworkers. Typically these bonds are paid for by a dedicated revenue streamfrom local or state finances. Pension obligations are typically funded in anactuarially evaluated fund. However, many states have failed to provide adirect funding stream to bond obligations or fully fund pension plans. Thisleads to unfunded bond and pension liabilities. These unfunded liabilitiesrepresent an expected state fiscal liability gap, which is a good indicator ofthe direction of future taxes and public services.To measure the tax climate, we use data on corporate taxes, income andsales and use taxes, property and unemployment insurance tax datacollected by the Tax Foundation.To measure the expected fiscal liability gap, we include data on unfundedliability per capita and percentage of GDP, average benefits, and bondrankings.Sources: Tax Foundation and US Internal Revenue Service.GradesABCDSources: Boston College Center for Retirement Research, US Census BureauStatistical Abstract, and Bureau of Economic Analysis.FMore OnlineVisit the Manufacturing Scorecard project website to view the performance history for each state and anarchive of past reports with insight into the manufacturing industry: mfgscorecard.cberdata.org Center for Business and Economic Research 3 Ball State University bsu.edu/cber
Global ReachThe level of international trade (in both imports and exports) is a robustmeasure of the region’s competitiveness in the production, movementand distribution of consumer durable and non-durable goods. Both firmsand regional governments focus considerable effort at improving tieswith foreign firms, but for different reasons. Governments seek foreigninvestment in plant and equipment, while firms care about supplierrelationships on both commodities and finished goods. Of course,manufacturers want to make goods with a global market appeal. Howwell this is done is an important predictor of the health of state-levelmanufacturing and logistics sectors into the future.To measure global reach, we include the export-related measures of percapita exported manufacturing goods and the growth of manufacturingexports. We also include the foreign-direct investment measures of theamount of manufacturing income received annually from foreign-ownedfirms in a state, the level of adaptability of the state’s exporters to changingdemand, as well as the reach of foreign direct investment.GradesABCDSources: US Department of Commerce International Trade Administrationand Bureau of Economic Analysis.FSector DiversificationProductivity and InnovationThere are both risks and rewards to economic diversification. States thatconcentrate their manufacturing activity in a single sector typically sufferhigher volatility in employment and incomes over a business cycle and arealso more likely to experience greater effects of structural changes to theeconomy involving a single sector. One potential benefit of low levels ofeconomic diversification is that the resulting agglomeration economiesoften emerge in highly specialized regions. As a consequence, policies thatseek to diversify the economy are typically pursued in concert with effortsto strengthen the supply chain of existing industries.The value of manufactured goods per worker—productivity—as wellas firm access to inventions and innovations is critical to the long-termperformance of a firm and the industry as a whole. Though innovationsand inventions are aggressively sought from across the globe, the presenceof local talent in these areas through access to university laboratories andnon-profit research activities plays an important role in location decisionsby manufacturers.To measure productivity and innovation, we use manufacturingproductivity growth, industry R&D expenditures on a per capita basis, andthe per capita number of patents issued annually.We calculate each state’s diversification of manufacturing activity using theHerfindahl-Hirschman Index. We then rank each state from the most diverse(1st) to the least diverse (50th).Sources: Census of Manufacturers, National Science Foundation, and USPatent Office.Sources: Bureau of Economic Analysis, North American IndustrialClassification System (NAICS), and authors’ calculations. Center for Business and Economic Research 4 Ball State University bsu.edu/cber
2020 Manufacturing ScorecardVisit mfgscorecard.cberdata.org to view past scorecards for each state.k Score improved from last year g Score same as last year m Score declined from last yearStateManufacturingIndustry Health2019 to 2020Logistics IndustryHealth2019 to 2020Human Capital2019 to 2020Worker BenefitCosts2019 to 2020Expected FiscalLiability2019 to 2020Tax Climate2019 to 2020SectorDiversification2019 to 2020Global Reach2019 to 2020Productivity andInnovation2019 to C-gC-C-kCD-gD-B-gB-ArkansasCgCCgCDgDAgAFkD-CgCD mDCgCFgFCaliforniaC mCB-gB-C-gC-DgDD mDD-kDC-kCFgFAgAColoradoDgDD kC-C kBCkBCgCCgCDmD-CgCC gC Conn.C gC DgDC kBDkC-D-kDFkD-AgADmFBkB DCkC C kBBmC AgABgBDgDBmB-CgCGeorgiaC-gC-BgBDgDBmC CmC-AmB CgCAmB CgCHawaiiFgFFgFCgCD-kD CgCDgDFgFDgDFgFIdahoBgBDgDC-kCC gC CgCBgBD-mFFgFCkC IllinoisC gC AgAB-gB-D mDD-kDFgFB mC C gC B-gB-IndianaAgAAmB CgCBmB-AgAC gC AmB CgCCgCIowaAgABgBAmB C-mD FgFB-gB-C-gC-C-gC-C-gC-KansasB gB C gC CgCC-kCCgCDgDB-mC C-kACkC KentuckyAgAAgADkD B-mC C-kCFgFB kACmC-C-mDLouisianaCkC BgBFgFC mCD mDCgCCgCDgDD mDMaineC-gC-D-gD-BgBDmD-CmD CgCFgFCgCD-gD-MarylandDgDDgDCgCCgCDmD-C gC DkD C-mD BgBMass.CmC-DgDBmB-CgCDgDCgCBgBD kC-AgAMichiganAgACgCDgDCgCB-kB C-kCBgBDgDAgAMinnesotaB-gB-B gB AgAAmB D-mFC kBB-gB-CgCBgBMississippiB gB CgCFkD-BgBC gC DgDCgCAgAFgFMissouriCgCCgCC-kCBgBAgABgBD kC-BgBC-gC-MontanaD-mFC-gC-CkC C-gC-AmB FgFDgDCgCDkD NebraskaC-kCBgBAmB CgCC gC AgACmD DgDDmD-NevadaFkD-DgDD kC-B gB CgCC-kCCmC-CgCC-mD New Hamp.BgBFgFB kACmC-C-gC-C-gC-BgBC-mDB gB New JerseyD gD C gC CgCD-mFFgFFgFCgCFgFAgANew Mex.FgFFgFFgFC kBBgBD gD FkC-D-kD CgCNew YorkD-mFCgCCmC-DgDD-mFCgCC-mDBgBC mCN. CarolinaC mCCgCCgCCgCB mBAgAC gC B gB AgAN. C-mDCgCCgCBgBB-gB-CgCOklahomaCgCB-gB-DgDCgCBgBC mCDkC-CkC FgFOregonB-kBC-mD C-mD D mDCgCCgCCkBDmD-AmB Penn.CgCAgACgCD kC-DkD D-gD-CgCB mBCgCRhode Is.DkD FgFC-gC-C-gC-DmD-DkD FgFAgAC-gC-S. CarolinaAgAC-gC-FgFCgCC-kCCmC-AgABgBCgCS. DakotaCgCCgCB mBB mBBgBAgADgDCgCDgDTenn.BmB-C mCDgDAgACgCBgBBmB-B-mC CgCTexasCgCAgAD mDB-gB-D kC-B gB AgAC mCC gC UtahCgCC-gC-BgBAgAAgAAgAC kBBgBBgBVermontCgCD-mFBmCFgFDgDC-gC-BkB CgCCgCVirginiaD-gD-CgCB-mC C mCAgABgBW. VirginiaCgCD kC-FgFFgFC gC DgDCgCD kC-DgDWisconsinBgBBgBB kACgCC-kCB kACgCC mCC-gC-WyomingD gD CgCBmB-FgFB kACmC-CgCFkDD-kC- Center for Business and Economic Research 5 Ball State University bsu.edu/cber
Our main product, the CBER Data Center, offers primary data sets, data resources for grant writers and economic developers, and a projects and publications library at cberdata.org. Center for Business and Economic Research, Ball State University 2000 W. University Ave., Muncie, IN 47306-0360 765-285-5926 cber@bsu.edu bsu.edu/cber cberdata.org