Transcription
ValuationFree Cash FlowsKatharina LewellenFinance Theory IIApril 2, 2003
Valuation Tools A key task of managers is to undertake valuation exercises inorder to allocate capital between mutually exclusive projects:¾ Is project A better than doing nothing?¾ Is project A better than project B?¾ Is the project’s version A than its modified version A’? The process of valuation and ultimately of capital budgetinggenerally involves many factors, some formal, some not(experience, hard-to-formalize information, politics, etc.). We will focus on financial tools for valuation.2
Valuation Tools (cont.) These tools provide managers with numerical techniques to“keep score” and assist in the decision-making process. They build on modern finance theory and deal with cash flows,time, and risk. All rely on (often highly) simplified models of the business:¾ Technical limitations (less now with computers)¾ Versatility¾ Understandable and discussible3
How to Value a Project/Firm? Calculate NPV¾ Estimate the expected cash-flows¾ Estimate the appropriate discount rate for each cash flow¾ Calculate NPV Look up the price of a comparable project Use alternative criteria (e.g., IRR, payback method)¾ You need to be an educated user of these4
Comparables method Suppose you want to value a private company going public¾ EBITDA 100 million¾ For a similar public company P/E 10¾ You value the IPO company at 1,000 million What are the implicit assumptions?¾ Suppose that P E / (r – g)¾ Then, P/E 1 / (r – g)¾ Thus, we assume that Earnings are expected to grow in perpetuity at a constant rate Growth rates and discount rates are the same for both firms5
Internal Rate of Return (IRR) One-period project¾ Investment 100 at time 0Payoff 150 at time 1Rate of return 150/100 – 1 50%NPV -100 150/discount rate 0Discount rate 150/100 50%¾ Rate of return is the discount rate that makes NPV 0 Multiple period projects¾ IRR is the discount rate that makes NPV 0NPV I o C1C2CT . 02T1 IRR (1 IRR )(1 IRR )Basic rule: Chose projects with IRR opportunity costs of capital6
Internal Rate of Return (IRR), cont. Suppose you choose among two mutually exclusive projects¾ E.g., alternative ways to use a particular piece of landProject 1:Project 2:cash flowscash flows:-10-20 20 35IRR 100%IRR 75%¾ Which project would you choose? (costs of capital 10%) Project 2 because it has a higher NPV Other pitfalls (BM, Chapter 5)¾ E.g., multiple IRR, lending vs. borrowing. Bottom line¾ NPV is easier to use than IRR¾ If used properly, IRR should give you the same answer as NPV7
1. Calculating Cash Flows
The Free Cash Flow (FCF) Approach FCF: The expected after tax cash flows of an all equity firm¾ These cash flows ignore the tax savings the firm gets from debtfinancing (the deductibility of interest expense) Plan of Attack:¾ Step 1: Estimating the Free Cash Flows¾ Step 2: Account for the effect of financing on value Preview: Two ways to account for tax shield:¾ Adjust the discount rate (WACC method).¾ Adjust the cash-flow estimate (APV method).9
Count all incremental, after-tax cash flowsallowing for reasonable inflation. All:¾ Don’t just look at operating profits in the out years.¾ If project requires follow-on CAPX or additional working capital, takethese into account. After-tax: The rest goes to the IRS. Be consistent in your treatment of inflation:¾ Discount nominal cash flows at nominal discount rates.¾ Reasons: Nominal rates reflect inflation in overall economy, but inflation in cashflows may be different. In fact, some items in cash flows, e.g., depreciation, may have no inflation.10
Treatment of Inflation - Example T-Bill rate (nominal) 8%Expected inflation rate 6%Expected real rate 1.08/1.06 1.9% Sales of widgets next year 100 measured in today’s dollarsYou expect that the price of the widgets will go up by 6%What’s the PV of the widgets?nominal cash flows:PV 100*(1.06)/1.08 98.2real cash flows:PV 100/(1.08/1.06) 98.211
Equivalent Expressions for Free Cash Flows(see Finance Theory I)FCF (1 t) EBIT Depreciation - CAPX - Change in NWCFCF (1 t) EBITD t Depreciation - CAPX - Change in NWCFCF (1 t) EBIT - Change in Net AssetsNote:EBIT Earnings before interest and taxesEBITD Earnings before interest and taxes and depreciation EBIT DepreciationChange in NWC is sometimes called Investment in NWC.12
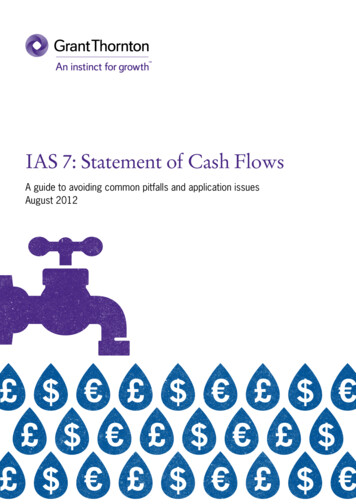
Example of Free Cash Flow CalculationSalesCost of Goods SoldDepreciationInterest ExpenseTaxes (38%)Profit After taxesCapital ExpendituresAccounts ReceivableInventoriesAccounts 509017540606025In 1999: FCF EBIT*(1-t) Depreciation - CAPX - Change in NWCEBIT 1,200 - 850 - 35 315; Ch. NWC (60 60-25) - (50 50-20) 15FCF 315 * (1-.38) 35 - 40 - 15 175.313
Beware! Note:¾ We ignored interest payments¾ We computed taxes on EBIT Do not take the effect of financing (e.g., interest) into account atthis stage. Remember our plan:¾ First, determine the expected cash-flows as if the project were100% equity financed.¾ Later, we will adjust for financing. If you count financing costs in cash-flow, you count them twice.14
TW Example XYZ, a profitable widget producer ( 100M annual after-tax profit) contemplatesintroducing new Turbo Widgets (TWs), developed in its labs at an R&D cost of 1Mover the past 3 years. New plant to produce TW would¾¾¾ TWs need painting: Use 40% of the capacity of a painting machine¾¾ cost 20M todaylast 10 years with salvage value of 5Mbe depreciated to 0 over 5 years using straight-linecurrently owned and used by XYZ at 30% capacitywith maintenance costs of 100,000 (regardless of capacity used)Annual¾ operating costs: 400,000¾ operating income generated: 42M¾ operating income of regular widgets would decrease by 2M Working capital (WC): 2M needed over the life of the project Corporate tax rate 36%15
TW Example (cont.) Ignore the 100M after-tax profit and focus on incremental cash-flows R&D cost of 1M over the past three years: Sunk cost Ignore it The plant’s 20M cost: It’s a CAPX Count it Machine’s 100K maintenance cost: Not incremental Ignore it¾ Incurred with or without TW production¾ True even if accounting charges TW production a fraction of these Op. income of regular widgets decrease by 2M due to cannibalization¾ Would not occur without TW production¾ It is an opportunity cost Count itYearCAPXRW Inc. decrease0200120230240250260270280290210020216
Use Incremental Cash Flows Compare firm value with and without the projectV(project) V(firm w/ project) - V(firm w/o project) Use only cash flows (in and out) attributable to the project¾ Sunk costs should be ignored They are spent w/ or w/o the project (bygones are bygones).¾ Opportunity costs should be accounted for A project might exclude good alternatives (e.g., use of land).¾ Accounting illusions should be avoided e.g. the project might be “charged” for a fraction of expenses that wouldbe incurred anyway.17
Use After-tax Cash Flows These are what you have left after paying capital suppliersMake sure to count the benefits of expensing, depreciation, etc.CAPX and Depreciation:¾ CAPX are not directly subtracted from taxable income¾ Instead, a fraction of CAPX (depreciation) is subtracted over a number ofyears18
TW Example (cont.) Depreciation:¾ Straight line depreciation: Flat annual depreciation¾ Accelerated depreciation: Decreasing 20M CAPX is depreciated linearly over 5 years, down to zero.D (20 - 0) / 5 4M Salvage value 5M is fully taxable since book value is zero.YearCAPXDepreciationSalvage 519
TW Example (cont.)Year0CAPX20.0IncomeRW Inc. decr.Incr. incomeIncr. costSalvage valueIncr. profitDepreciationEBITIncr. taxes (36%)Incremental CF 042.02.040.00.45.044.644.616.128.5Note: We do as if entire EBIT is taxable We ignore (for now) the factthat interest payments are not taxable.20
So far (but we’re not done yet):CF Incr. Profit – Taxes – CAPX Incr. Profit – t * (Incr. Profit – Depr.) – CAPX (1 – t) * Incr. Profit t * Depr. – CAPXExample: We could have computed the CF in year 1 as(1 - 36%) * 39.6 36% * 4 - 0 26.8M21
Changes in (Net) Working CapitalRemark 1: Many projects need some capital to be tied up (working capital) whichconstitutes an opportunity cost.We need the Change in Working Capital implied by the project.Remark 2: Accounting measure of earningsSales - Cost of Goods SoldIncome and expense are reported when a sale is declared.¾ COGS in 2000 includes the costs of items sold in 2000 even if the cost wasincurred in 1999 or hasn’t been incurred yet.¾ Sales in 2000 include the income from items sold in 2000 even if thepayment has not been received yet.Working Capital Inventory A/R - A/P22
TW Example (cont.)YearCAPXIncr. profitIncr. taxes (36%)NWCChange in NWCTotal01234567891020.039.6 39.6 39.6 39.6 39.6 39.6 39.6 39.6 39.6 44.612.8 12.8 12.8 12.8 12.8 14.3 14.3 14.3 14.3 16.12.02.02.02.02.02.02.02.02.02.02.0-2.0-22.0 26.8 26.8 26.8 26.8 26.8 25.3 25.3 25.3 25.3 30.523
Putting It All TogetherFCF (1 – t) * Incr. Profit t * Depr. – CAPX – NWCThis can also be rewritten asFCF (1 – t) * EBIT Depr. – CAPX – NWC24
Finding the Value of the Cash Flows Decision Rule¾ Accept any project with positive NPV. The NPV tells you how muchvalue the project creates.NPV CF0 E[CF1 ] E[CF2 ] E[CF3 ] E[CF4 ] .234(1 r) (1 r)(1 r) (1 r) We know how to find the expected free cash flows We need to find the appropriate discount rate for a project We need to account for the tax benefits of interest payments¾ Ignore this for now, and assume that the project is 100% equityfinanced25
What is the appropriate discount rate for aproject? The discount rate is the opportunity cost of capital for theproject. It answers the question: What rate can investors earn onan investments with comparable risk? What does comparable risk mean?26
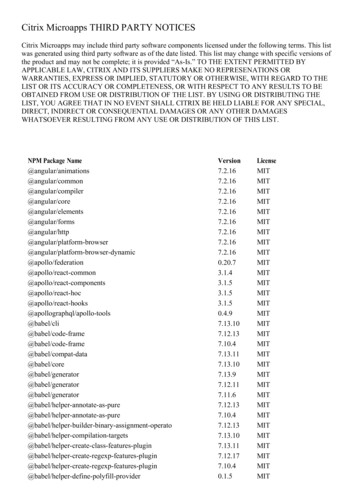
Using the CAPM What does ‘comparable risk’ mean?¾ CAPM: risk β How does risk translate into a discount rate?¾ CAPM: E[rE] rf βE E[RM – rf] Practical issues¾ Estimating betas¾ Estimating the market risk premium¾ Leverage27
Beta regression 8
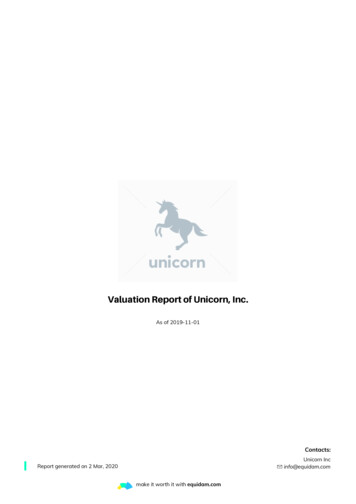
Leverage, returns, and riskFirm is a portfolio of debt and equityAssetsLiab & EqDebtAssetsEquityTherefore DEr rErA DAAandDEβ βEβA DAA29
Estimating Betas Equity Beta¾ Simply regress past stock returns on the market return Asset Beta¾ For an all-equity firm, equity beta asset beta¾ How about levered firms?¾ Hint: You can view the firm as a portfolio of debt and equity Recall: portfolio beta weighted average of individual asset betas Question: What are the appropriate weights? You can assume that debt is risk-free or that debt beta is between 0.1and 0.3 (based on empirical studies)30
The Free Cash Flow (FCF) Approach FCF: The expected after tax cash flows of an all equity firm ¾These cash flows ignore the tax savings the firm gets from debt financing (the deductibility of interest expense) Plan of Attack: ¾Step 1: Estimating the Free Cash Flows ¾Step 2: Account for the effect of financing on value