Transcription
Digital Customer ExperienceAn Emerging Theme in Customer Service ExcellenceGrønholdt, LarsDocument VersionFinal published versionPublication date:2019LicenseCC BY-NC-NDCitation for published version (APA):Grønholdt, L. (2019). Digital Customer Experience: An Emerging Theme in Customer Service Excellence. Paperpresented at 22nd QMOD-ICQSS International Conference on Quality and Service Sciences, Krakow, Poland.Link to publication in CBS Research PortalGeneral rightsCopyright and moral rights for the publications made accessible in the public portal are retained by the authors and/or other copyright ownersand it is a condition of accessing publications that users recognise and abide by the legal requirements associated with these rights.Take down policyIf you believe that this document breaches copyright please contact us (research.lib@cbs.dk) providing details, and we will remove access tothe work immediately and investigate your claim.Download date: 18. Jul. 2022
Research Paper presented at the 22nd QMOD-ICQSS (International Conference onQuality and Service Sciences) Conference, Krakow, Poland, October 2019Digital customer experience: An emerging theme incustomer service excellenceLars GrønholdtProfessor, Department of MarketingCopenhagen Business School, Denmarklg.marktg@cbs.dkAbstractPurpose – The purpose of the paper is to examine how essential dimensions of digital customerexperience (DCE) drive business performance.Methodology/approach – An empirical study is conducted to investigate the relationshipsbetween seven DCE dimensions and business performance. The conceptual model isoperationalized by a structural equation model, and the model is estimated and tested by usingthe partial least squares method. A survey of 756 companies in Denmark forms the empiricalbasis for the study.Findings – The findings provide evidence that the seven DCE dimensions influence businessperformance. All seven DCE dimensions are essential in producing total customer experience,market performance, and financial performance.Research limitations – The study is limited to the seven identified DCE dimensions in Danishcompanies.Practical implications – The study has clear implications in terms of identifying andmeasuring the importance of essential DCE dimensions which influence business performance.Interesting differences appear between the seven indexes for DCE dimensions. The results canhelp companies to understand DCE and develop DCE strategies.Originality/value – The paper provides insight into DCE and how DCE works.Key wordsDigital customer experience, market performance, financial performancePaper typeResearch paper
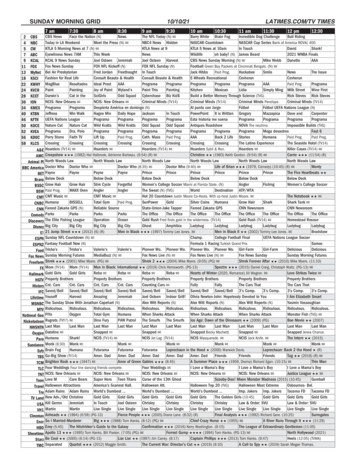
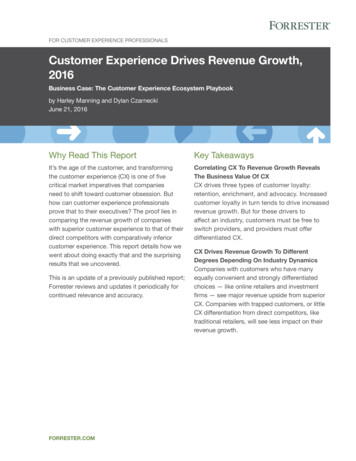
IntroductionIn recent years, creating and managing digital customer experiences seems to be a key area formany companies on “leveraging digital advancement for the growth of organizations andachieving sustained commercial success” (Bones and Hammersly, 2017, p. 128). Digitaladvancements has attracted great attention from marketing academics and practitioners(Borowski, 2015; Cliff, 2018; Lywood et al., 2009; Palmer, 2008, 2010; Verhoef et al., 2009).Sharma and Chaubey (2014, p. 18) claim that “the customer experience has emerged as thesingle most important aspect in achieving success for companies across all industries”.The literature on customer experience is growing fast, and the debate among scholars andpractitioners is very lively. However, “the greatest challenge for customer experiencemanagement lies in the difficulty of measuring the concept, which is specific to a situationaland emotional context” (Palmer, 2008). Moreover, Brakes et al. (2009, p. 52) state that“research has largely ignored the exact nature and dimensional structure of brand experiences”.The present study addresses these challenges and examines how digital customer experience(DCE) can be measured and how different dimensions of DCE influence business performance.The present study is initiated and conducted as a research project between CopenhagenBusiness School, Denmark (CBS, www.cbs.dk) and House of Loyalty, Denmark(www.sj@stigjorgensen.as) with the support of several Danish data, insights and consultingcompanies.The structure of the paper is as follows. Firstly, the essential dimensions of DCE are identifiedand discussed. Secondly, a conceptual model of the relationships between the DCE dimensionsand business performance is developed. Thirdly, the research methodology is presented:measures development, data collection, and the modelling approach. Fourthly, data analysesresults are presented and discussed. And fifthly, concluding remarks are provided in the closingsection of the paper.Linking DCE to business performanceBased on literature reviews (i.a., McColl-Kennedy et al., 2015; Gupta, 2018), case studies fromthe literature (i.a., Frow and Payne, 2007; Gupta, 2018), and practical work with DCE an initialframe of reference of DCE was developed. This outlined a set of characteristics of DCEdescribing relevant areas of actions in the company: Top management anchoring and digitalstrategy, culture, customer journey, customer insight and data, innovation, organization, andcompetences (see the conceptual model in Figure 1).For each of the areas, survey questions are developed based on Shaw (2017) and practical workwith DCE surveys. An empirical study (see next section) suggest that it would be appropriateto organize the initial DCE characteristics in seven DCE dimensions. Hence, analyzing surveyresponses from 484 companies using factor analysis (see next section) gave new insight intohow to structure and describe the DCE concept with good sense. The seven dimensions(factors) are shown on the left-hand side of the conceptual model (see Figure 1).Figure 1. The conceptual DCE model1
The conceptual model in Figure 1 shows the links between DCE dimensions, DCE, totalcustomer experience, market performance, and subsequently financial performance.MethodologyMeasures developmentThe conceptual model’s eleven variables are viewed as latent variables, which are measured by2-6 measurement variables or items (measured by survey questions). The seven dimensions ofDCE have been deduced from literature studies and confirmative and explorative factoranalysis. The model structure is at this moment supported by data which in turn makes goodsense to the model (face validity).The survey questions which have been used to measure the seven DCE dimensions are partlyinspired by Shaw’s work with customer experience in general (Shaw, 2017), partly based onpractical work with measuring DCE and customer experience, and partly developed for the thisstudy explicitly.Measurements of market performance and financial performance have been done by usingestablished scales from academic literature: Desphandé et al. (1993), Homburg and Pflesser(2000), Moorman and Rust (1999), and Zhou et al. (2009).All questions are generic which means they are formulated in such a flexible manner that theycan be used across companies and industries. At this moment, the estimation results can becompared across companies and industries which allow using the results in benchmarkingstudies. It is a distinct advantage for this model and the attached measurement system. Thedeveloped questionnaire consists of 44 questions regarding DCE and total customer experience,and 10 questions regarding the two business performance variables.2
The respondent answers all questions on a 7-point scale. Questions regarding DCE and totalcustomer experience concern the respondent’s company. The respondent is asked to mark from‘strongly disagree’ to ‘strongly agree’ on the statements provided. Answers to questionsregarding market and financial performance are to be scaled from ‘much worse’ to ‘muchbetter’ compared to competitors.Data collectionIn 2019 we conducted an online survey across several industry and service sectors in Denmarkto capture a broad variety of market settings. Our unit of analysis is the company, and the datacontains 484 useable interviews with company managers in Denmark. Most of the managersheld top management positions such as marketing manager, director (responsible for marketingand sales activities within the company) or member of the executive.A structural equation modeling approachThe conceptual model in Figure 1 is operationalized as a structural equation model which linkseach latent variable with the corresponding measurement variables (the measurement model)and links the latent variables through causal relationships (the structural model) symbolized bythe arrows in Figure 1.The structural equation model is estimated and tested by using partial least squares (PLS) dueto this method’s advantages: PLS is distribution-free and it is robust (against skew distributionsfor measurement variables and multicollinearity) (Cassell et al., 1999; Chin, 1998; Fornell andBookstein, 1982; Hulland, 1999; Tenenhaus et al., 2005). Furthermore, PLS is a powerfulmethod for predictive applications, as PLS aims at explaining variances (Fornell and Cha,1994).We follow the recommended two-stage analytical procedure for the PLS approach to structuralequation modeling (Fornell and Larcker, 1981; Hair et al., 2012; Hulland, 1999): Firstly, themeasurement model was evaluated, and then the structural model including estimation andtesting of the model. In both stages, the software SmartPLS (Ringle et al., 2019) was used.Data analysis resultsMeasurement model evaluationInitially, several analyses were carried out to assess the measurement variables (items) and thelatent variables in the model.The reliability and validity of the scales were examined. Firstly, item reliability was measuredby Cronbachs’ alfa factor loading. We found from the SmartPLS output that the lowest loadingwas 0.72, indicating that item reliability of the scale measures was acceptable. It is recomended,that Cronbach’s alpha of an item is 0.7 or more (Carmines and Zeller, 1979; Hulland, 1999).Secondly, composite reliability (internal consistency) was assessed using the compositereliability coefficient recommended by PLS researchers, and an acceptable level is said to be0.7 or higher (Baumgartner and Homburg, 1996; Chin, 1998; Fornell and Larcker, 1981;Hulland, 1999). We found that all composite reliability coefficients were higher than 0.85 and3
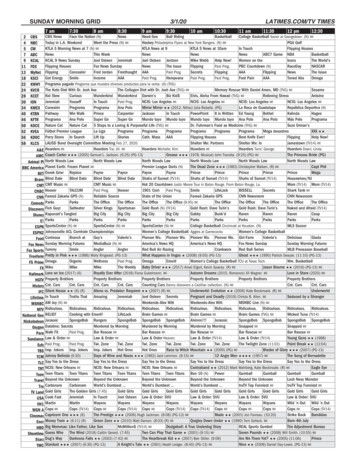
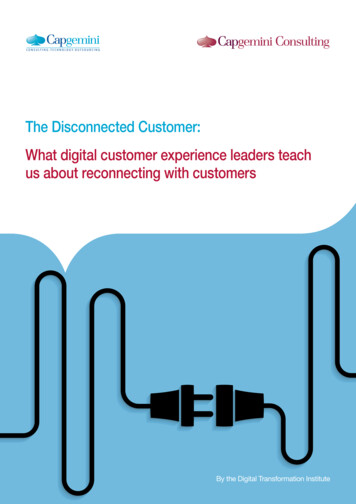
exceeded the recommended threshold. Also, we used the average variance extracted (AVE),which should be higher than 0.5 (Chin, 1998; Fornell and Cha, 1994; Fornell and Larcker,1981). The AVE for all latent variables clearly exceeds this condition, since the lowest reportedAVE value is 0.60, demonstrating composite reliability for all latent variables also in that way.Thirdly, discriminant validity is present if the square root of AVE of a latent variable is moreextensive than its correlations with the other latent variables (Chin, 1998; Fornell and Larcker,1981; Hulland, 1999). The criterion is met for all latent variables, which indicates that the latentvariables in the model are distinct. Thus, with acceptable reliability and validity assessments,our measures were considered to be appropriate for subsequent estimation and test of the causalmodel.Estimation of the DCE modelThe results of the PLS estimation of the model are shown in Figure 2. The estimates of theimpacts (path coefficients) between the latent variables in the model are displayed by thearrows, and DCE indexes, total customer experience and performance indexes are shown insidethe variables in the figure. As expected, all estimated impacts are positive. The estimatedindexes for each variable - from 0 (poor) to 100 (excellent) - indicate the average level amongthe participating companies in the study. The impact scores are effects of a one-point increasein a variables’ index on the following variable.To test the significance of the path coefficients the bootstrap resampling procedure is applied,and all relationships in the model are statistically significant (all t values 17.6, all p values 0.001).By estimating the model an explanatory power of R2 0.61 for financial performance isachieved, i.e., the model explains 61 % of the variation in financial performance. For marketperformance and total customer experience, the explanatory power is respectively R2 0.53and R2 0.56. These R2 values indicate a good overall model fit.In conclusion, the quality of the model is good with strong explanatory power. Thus, there is ahigh certainty and precision in the results and conclusions to be drawn from the study.Results and discussionClear evidence of the relationship between DCE and financial performanceThe model estimation results show that there is a strong relationship between DCE and financialperformance as illustrated in Figure 2. All DCE dimensions have a positive influence on digitalcustomer experience, which in turn has a positive and significant influence on both marketperformance and financial performance. Moreover, as expected, market performanceinfluences financial performance.Figure 2. The estimated DCE model4
Differences between the DCE dimensionsInteresting differences can be observed between the seven indexes for DCE dimensions. Thethree lowest indexes is for innovation, organization, and competences. It is noticeable that thesethree DCE dimensions have the largest impact on DCE. Against this background, companiesin general should generally focus on improving innovation, organization and competences witha view to increasing DCE, total customer experience, market performance, and finally financialperformance.ConclusionThe present paper has investigated DCE and its influence on business performance. Thedeveloped DCE model provides a comprehensive means of covering important dimensions ofDCE as well as a better understanding of these dimensions’ link to business performance. Theseven DCE dimensions make good sense to Danish managers. The model has been empiricallyvalidated, and all relationships in the model are statistically significant indicating a solid model.The quality of the model is good with strong explanatory power, and the conclusions drawnfrom the study reflect high confidence and precision.The data analyses presented in the paper provide evidence that all seven DCE dimensionsinfluence business performance.The presented model is limited to seven identified DCE dimensions. It is possible that analternative structure of the dimensions or new dimensions – cf. the introductory remarks on thegrowing literature and debate on DCE – may provide even more convincing conclusions.The study is the second of a yearly DCE index that measures DCE based on the same surveyset-up and modeling approach as presented in this paper. Some survey questions are added in2019 to reveal actual DCE themes and trends.5
ReferencesBaumgartner, H., and Homburg, C. (1996), “Applications of structural equation modeling inmarketing and consumer research: A review”, International Journal of Research inMarketing, Vol. 13, pp. 139-161.Bones, C., and Hammersley, J. (2017), “Leading digital strategy: Driving digital strategy:Driving business growth through effective e-commerce”, The Journal of Decision Makers,Vol. 42, No. 2, pp. 128-132.Borowski, C. (2015). “What a great digital customer customer experience actually looks like”,Harvard Business Review, Vol. 11, No. 9, pp. 2-5.Carmines, E.G., and Zeller, R.A. (1979), Reliability and Validity Assessment, Sage UniversityPaper Series on Quantitative Applications in the Social Sciences, No. 07-017. Sage, BeverlyHills, California.Cassel, C., Hackl, P., and Westlund, A.H. (1999). “Robustness of partial least-squares methodfor estimating latent variable quality structures”, Journal of Applied Statistics, Vol. 26, No.4, pp. 435-46.Chin, W.W. (1998), ”The partial least squares approach to structural equation modeling”, in:Marcoulides, G.A. (Ed.), Modern Methods for Business Research (pp. 295-336). LawrenceErlbaum Associates, Mahwah, New Jersey.Cliff, S. (2018), “Why the digital customer experience reguires a business transformation”,Computer Weekly, No. 3, Vol. 20, pp. 28-32.Deshpandé, R., Farley, J.U., & Webster Jr., F. (1993), ”Corporate culture, customer orientation,and innovativeness in Japanese firms: A Quadrad analysis”, Journal of Marketing, Vol. 57,No. 1, pp. 23-37.Fornell, C. and Bookstein, F.L (1982), “Two structural equation models: LISREL and PLSapplied to consumer exit-voice theory”, Journal of Marketing Research, Vol. 19, No. 4, pp.440-452.Fornell, C. and Cha, J. (1994), “Partial least squares”, in: R.P. Bagozzi (Ed.), AdvancedMethods of Marketing Research (pp. 52-78). Blackwell, Cambridge, Massachusetts.Fornell, C. and Larcker, D.F. (1981), “Evaluating structural equation models with unobservablevariables and measurement error”, Journal of Marketing Research, Vol. 18, No. 1, pp. 3950.Gupta, S. (2018), Driving Digital Strategy, Harvard Business Review Press, Boston,Massachusetts.Hair, J.F., Sarstedt, M., Pieper, T.M., and Ringle, C.M. (2012), “The use of partial least squaresstructural equation modeling in strategic management research: A review of past practicesand recommendations for future applications”, Long Range Planning, Vol. 45, No. 5/6, pp.320-340.Homburg, C. and Pflesser, C. (2000), ”A multiple-layer model of market-orientedorganizational culture: Measurement issues and performance outcomes”, Journal ofMarketing, Vol. 37, No. 4, pp. 449-462.Hulland, J. (1999), “Use of partial least squares (PLS) in strategic management research: Areview of four recent studies”, Strategic Management Journal, Vol. 20, No. 2, pp. 195-204.Hwang, J. and Seo (1999), “A critical review of research on customer experiencemanagement”, International Journal of Contemporary Hospitality Management, Vol. 28,No. 10, pp. 2218-2246.Lywood, J., Stone, M., and Ekinci, Y. (2009), “Customer experience and profitability: Anapplication of the empathy rating index (ERIC) in UK call centres”, Journal of DatabaseMarketing and Customer Strategy Management, Vol. 16, No. 3, pp. 207-214.6
Moorman, C. and Rust, R.T. (1999). ”The role of marketing”, Journal of Marketing, Vol. 63,No. 4, pp. 180–197.Palmer, A. (2008), ”The role of the ’customer experience manager’ – Hope or hype?”,Proceedings of the 10th International Research Seminar in Services Management, LaLonde, France, 27-30 May 2008.Palmer, A. (2010), ”Customer experience management: a critical review of an emerging idea”,Journal of Services Marketing, Vol. 24, No. 3, pp. 196-208.Pine, B.J. and Gilmore, J.H. (1998), The Experience Economy, Harvard Business School Press,Boston, Massachusetts.Ringle, C.M., Wende, S., and Will, A. (2019), SmartPLS, University of Hamburg, available at:www.smartpls.comSchmitt, B. (1999). Experimental Marketing: How to Get Customers to Sense, Feel, Think, Actand Relate to Your Company and Brands, The Free Press, New York, NY.Sharma, M. and Chaubey, D.S. (2014). “An empirical study of customer experience and itsrelationship with customer satisfaction towards the services of banking sector”, Journal ofMarketing & Communication, Vol. 9, No 3, pp. 18-27.Shaw, J.D. (2017). “From the editors: Advantages of starting with theory”, Academy ofManagement Journal, Vol. 60, No. 3, pp. 819-822.Tenenhaus, M., Vinzi, V.E., Chatelin, Y.-M., and Lauro, C. (2005). “PLS path modeling”,Computational Statistics and Data Analysis, Vol. 48, pp. 159-205.Verhoef, P.C., Lemon, K.N., Parasuraman, A., Roggeveen, A., Tsiros, M., and Schlesinger,L.A. (2009), “Customer experience creation: Determinants, dynamics and managementstrategies”, Journal of Retailing, Vol. 85, No 1, pp. 31-41.Zhou, K.Z., Brown, J.R., and Dev, C.S. (2009), ”Market orientation, competitive advantage,and performance: A demand-based perspective”, Journal of Business Research, Vol. 62, No.11, pp. 1063-1070.7
Business School, Denmark (CBS, www.cbs.dk) and House of Loyalty, Denmark (www.sj@stigjorgensen.as) with the support of several Danish data, insights and consulting . McColl-Kennedy et al., 2015; Gupta, 2018), case studies from the literature (i.a., Frow and Payne, 2007; Gupta, 2018) , and practical work with DCE an initial