Transcription
Scaling Up SimCalc ProjectDesign and Development of CurriculumUnits and Professional DevelopmentTechnical Report 07 June 2010Jennifer KnudsenReport Series Published by SRI InternationalResearch collaborators:University of Massachusetts, Dartmouth; Virginia Polytechnic Institute and State University;The University of Texas at Austin; and the Charles A. Dana Center at the University of Texas at Austin
Authorization to reproduce this publication in whole or in part is granted. While permission to reprint thispublication is not necessary, the citation should be: Knudsen, J. (2010) Design and Development of CurriculumUnits and Professional Development (SimCalc Technical Report 07). Menlo Park, CA: SRI International.SRI InternationalCenter for Technology in Learning333 Ravenswood AvenueMenlo Park, CA 94025-3493650.859.2000
Design and Development of Curriculum Unitsand Professional DevelopmentPrepared by:Jennifer Knudsen, SRI InternationalAcknowledgmentsThis report is based on work supported by the National Science Foundation under Grant No. 0437861. Anyopinions, findings, and conclusions or recommendations expressed in this report are those of the authors and do notnecessarily reflect the views of the National Science Foundation.We thank J., Roschelle, N. Shechtman, G. Estrella, G. Haertel, K. Rafanan, P. Vahey, S. Carriere, L. Gallagher,H. Javitz, T. Lara-Meloy, M. Robidoux, S. Empson, S. Hull, L. Hedges, S. Goldman, H. Becker, J. Sowder,G. Harel, P. Callahan, F. Sloane, B. Fishman, K. Maier, J. Earle, R. Schorr, and B. McNemar for theircontributions to this research. We thank the participating teachers and Texas Educational Service Centerleaders from regions 1, 6, 9, 10, 11, 13, 17 and 18; this project could not have happened without them.We thank and remember Jim Kaput, who pioneered SimCalc as part of his commitment to democratizingmathematics education.
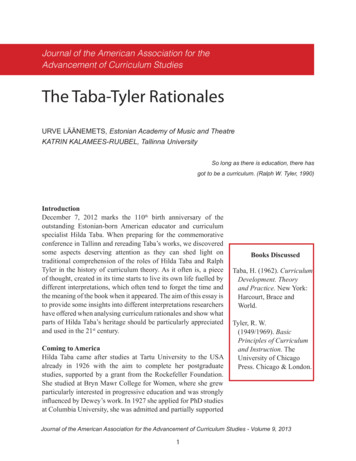
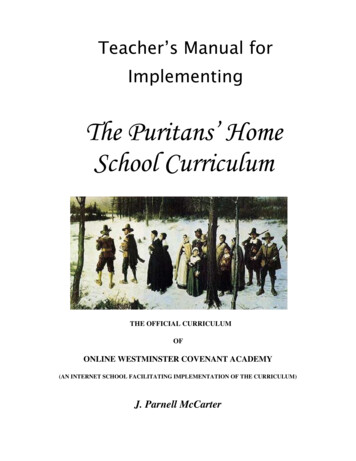
Design and Development of Curriculum Units andProfessional DevelopmentThe SimCalc research team conducted two experiments to test whether a combination ofprofessional development and SimCalc-based curriculum materials could be used by a widevariety of teachers to support their students’ learning of conceptually complex mathematics. Theexperiments were conducted with about 150 seventh- and eighth-grade teachers from across thestate of Texas. This technical report describes the content of the units, their features, the trainingthat accompanied the units and issues in its development.Unit ContentTwo curriculum units were designed for theseexperiments, one for seventh-graders and one foreighth-graders. Each of the curriculum units addressesTexas state standards and also includes topics that weremore challenging than those in the standards. Managingthe Soccer Team addresses seventh-grade standardson rate and proportionality and includes multirate functions and the meaning of slope. DesigningCell Phone Games targets eighth-grade standards forlinear function and introduces average rate throughfurther exploration of multi-rate functions. A detaileddescription of each unit—the storyline, the activities,the main mathematical ideas, and the learning goals—isappended. What follows is a more compact description.Both units follow a similar progression. Each beginswith simple analyses of motion at a constant speed,and follows a learning progression that culminates inthe more complex topics. Moving from qualitativeto quantitative analyses, the unit develops graphical,tabular and symbolic forms of linear functions. Inthe seventh grade units, the functions are directlyproportional, so that each point represents the samerate of change. In the eighth grade units, proportionaland non-proportional functions are distinguished. Each4of these topics is found in the Texas state standards.The progression then continues in each unit to addressmulti-rate functions—piecewise linear functions. Theeighth grade unit continues on to explore average rate.Each of these topics is developed in contexts that canbe represented in the SimCalc MathWorlds ’ “world”window, a place where motion or growth can be shownwith characters and other representations of realworld phenomena. Motion and non-motion contextsare important in both units: both to help studentsgeneralize across contexts and to provide anotheropportunity to learn complex content.A tour through Managing the Soccer Team will illustrateone of the progressions in some detail:Early in the soccer team unit, students observea simple line graph and a simulation of a soccerplayer running along a straight line (Exhibit 1).The graph and simulation are linked so that as therunner moves forward, the graph of that motionbuilds. In the graph window, the x-axis representstime and the y-axis represents distance traveled. Atfirst, students just identify the starting and endingtime of the runner, correlating the runner’s positionin the world window and the graph window. Aseries of questions in the student workbook guides 2010 SRI International — Design and Development of Curriculum Units and Professional Development
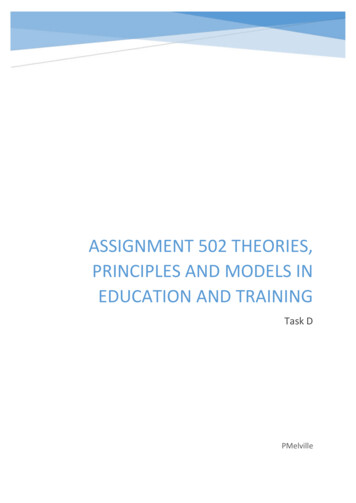
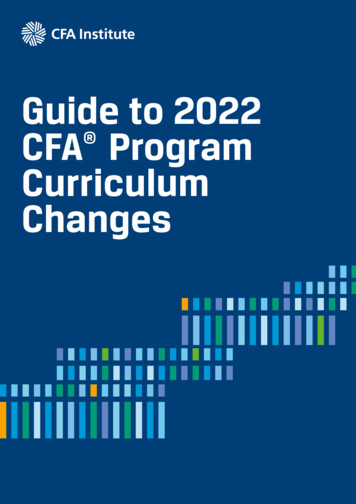
students from this initial interpretation of thegraph to the understanding that the entire linerepresents the speed of the runner, the ratio ofdistance to time.In the middle of the unit, Run, Jace, Run introducessymbolic algebraic notation to represent the same typeof motion (Exhibit 2). Students express the relationshipbetween time and distance first in a graph, then in atable, then in words, and finally in an equation. Bothtable and language representations of motion enablestudents to write the equation of the line. Throughmore activities, students develop facility in connectingrepresentations and translating from one to another.Exhibit 1. Activity from Early in the UnitTechnical Report 07June 20105
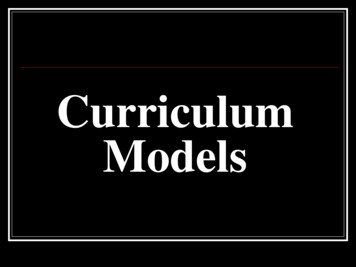
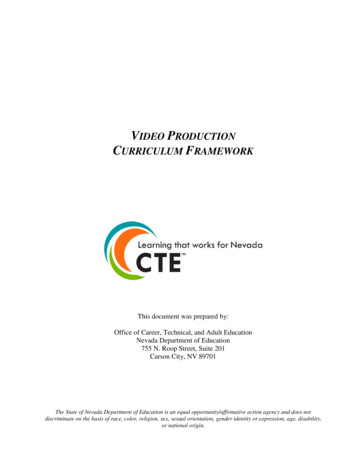
Back to the Office is an activity that parallels Run,Jace, Run: it presents the same content in a nonmotion context. Students solve problems involving,for example, best buys on soccer cones and settingticket prices for the team’s games. Back to the Office reintroduces content in a non-motion context, allowingstudents to generalize but also to learn what they mayhave missed the first time around. There are a numberof these activities throughout the unit.On the Road consists of a series of stories about thetroubled history of the team’s trips from its hometownto Dallas. In each trip, a bus and a van traveled betweenthe two cities, stopping, slowing and speeding up—andsometimes turning around and going the other way.The activity allows students to build correspondencesbetween multi-rate, piecewise linear graphs and verbaldescriptions of motion. Slope is dealt with qualitatively.This activity is where the unit starts to move beyondstate standards for seventh grade. But the unit’sstoryline and contexts remain familiar, as does the coreconcept of rate.Exhibit 2. Activity Midway through the Soccer Unit6 2010 SRI International — Design and Development of Curriculum Units and Professional Development
Unit FeaturesIn addition to detailing the mathematics learningprogression, the unit designers used a set of features tosupport teachers and students in their use of the unit.Both the teacher notes and the student materialswere designed to be helpful to teachers in planningand implementing each unit. Teachers who mightnever open their teacher notes could instead use thestudent workbook as a kind of default guide or lessonplan. Important questions for the class to consider arewritten into the student book—in fact, every importantquestion that the developers could think of was treatedthis way. On the other hand, the workbook is not aprescriptive script—teachers were free to write theirown lesson plans, augmenting or highlighting differentparts of the student workbook. A third option was touse the teachers’ notes to adapt premade day-by-daylesson plans. These plans provided extra questions toask students, and included sample student responses.A suggested pacing chart helped teachers plan for howto complete the unit in whatever amount of time theymight have—with the recommended time being 10days.Other features of the units were designed to helpstudents directly. SimCalc MathWorlds softwareallows animated versions of objects and people inmotion in contexts. The theme of each unit providescontinuity across these contexts and the storylineprovides detail that the software could not capture.Exhibit 3. Activity from Second Half of UnitTechnical Report 07June 20107
Realistic numbers are used so that students couldcheck speeds, prices and other rates against theirknowledge of how expensive uniforms are or how fastpeople run. The text uses simple sentence structureand consistent vocabulary, never going beyond a fifthgrade reading level, in order to accommodate thosewith low-level reading skills and those just learningto read English in making sense of the context andthe math. To help guide and organize students’ work,the workbook uses graphical conventions to indicatevarious kinds of activities and content. For example,definitions appeared inside boxes on the page, as didother critical content information. The amount ofwhite space left after a question indicated the type andlength of an expected answer. Simple graphics served asimplicit indices for the activities. Even the fact that theworkbook contained all the student activities physicallybound together provided another organizational aidto students. The workbooks contained as much coloras the budget would allow, appealing to media-savvystudents who are used to plentiful use of color.Professional DevelopmentThe seventh-grade and eighth-grade experiments usedtwo different professional development (PD) models.The first was designed to best ensure that the researchers’and developers’ intentions were reflected in the PD andtherefore reached teachers. The second was designedto be better aligned with professional developmentpractices in Texas. The workshops offered in the PDwere less than a week long, about as much as couldbe expected from teachers for training in teaching areplacement unit.For Managing the Soccer Team, the goals of the 5 daysof training were to Provide teachers with a mental image of the unit as awhole, as well as direct experience with most activities. Improve teachers’ content knowledge, both in termsof the mathematics in the unit—going deeper—and the mathematics that might come after theunit—going farther.8 Allow teachers to develop comfort with the software Model teaching strategies consistent with a SimCalcapproach. Show how the unit fit in with local customs andaddressed state standards.The workshop had three parts. In the first part, a wellknown local expert in math professional developmentled the teachers in transitioning from a view ofproportionality as a/b c/d—a relationship among fournumbers—to a broader view of proportionality as alinear function of the form y kx—relating an infinitenumber of pairs of numbers. This understanding waskey to considering rate and proportionality in theSimCalc context, where functions are the primary objectof study. Additionally, this transition was advocated byinfluential state education groups; materials similar totheirs were used in the workshops. For the next twodays, a member of the SRI team led teachers throughthe Managing the Soccer Team unit, using theirworkbooks and the software. The leader modeled a smallset of SimCalc strategies such as “predict, check, explain,”in which teachers were encouraged to predict what wouldhappen in SimCalc MathWorlds simulations beforerunning them and then explain the differences betweenwhat they predicted and what actually happened. Toboost teachers’ comfort with the software, the leader gavedemonstrations and encouraged teachers to play with thesoftware, as well as use it in the unit activities. In the thirdpart of the workshop, teachers used additional activitiesand the software to explore calculus concepts, learningabout the relationship between graphs of velocity andspeed. Teachers learned this more advanced mathematicscore to SimCalc, both so that they could understand wherethe mathematics in the soccer unit could lead and so thatthey could experience new content, in the same way thatManaging the Soccer Team is likely to be for their students.The eighth grade experiment used a two-tiered systemof training—a “train the trainers” approach. The samepair of professional developers led a 2-day trainingfor local professional development experts, who thendelivered a 3-day training session for teachers in the 2010 SRI International — Design and Development of Curriculum Units and Professional Development
regions of Texas that they served. These local expertswere provided with curriculum, teacher notes andpresentation slides. They were asked to do a trainingmuch like that described for the second two parts of theseventh-grade study.Balancing ConstraintsEvery curriculum is designed within constraints—which might be about the people, the resources or thepolitics in a given situation. Designing the Scaling UpSimCalc units was no different—but with the addedconstraint of the experimental setting in which thematerials were used.Designing for the experiment and for other constraintswas a balancing act. The units, of course, needed towell represent the SimCalc approach to teachingand learning—that is what the experiments weredesigned to test. Typically, SimCalc is used to helpyoung students, middle through high school, learnthe fundamental ideas of calculus by providing reallife interpretations for differentiation and integration(hence the same SimCalc). But these topics were moreadvanced that those in the middle school mathematicsstandards in Texas, where the experiments took place.The teachers, administrators and policymakers associatedwith the experiment wanted to ensure that materialsused by thousands of students would address the mostimportant topics in their standards. Finding a balancebetween typical SimCalc topics and state standardsbased content resulted in the content described in thisreport. By inching past the standards, with multi-ratefunctions, we managed to stay within the comfort zoneof local education leaders as well as many teachers, whilestill pushing into the “precalculus” territory of SimCalc.Another part of the experimental design was recruitinga wide variety of teachers in terms of background,experience, pedagogical style, and mathematicsknowledge. In designing the teacher supports described,this wide variety was considered. The materials neededto meet the needs of teachers who struggled withthe math, without over-constraining teachers withadvanced content knowledge. The teachers withadvanced content knowledge, though, might be stilldeveloping pedagogical skills, and so both the skillfulquestioner and the teacher struggling to keep order inclass needed to be supported. Finally, other work hadrevealed that many of today’s teachers do little writtenplanning before delivering their lessons. So the trainingincluded time and structure to help teachers do thatplanning, an important part of teaching particularly fornovice teachers.Pedagogy is often embedded in curriculum and madeexplicit during training. Traditionally, SimCalc materialspresented fairly complex and open-ended problemsituations in which students could gradually developmathematical insights. This was not the commonlyendorsed pedagogy at the time, and not many teacherswould have had exposure to such methods. So theexperiment’s units were more highly structured thancustomary SimCalc materials, and the PD leaders did notpush teachers to adopt wholly new practices.ConclusionThis report described several aspects of the curriculumand professional development used in two scalingup experiments. Paper materials and software servedto guide students in an exploration of real-worldcontexts and associated mathematics representations,focusing on rate, proportionality, and linear function.Developers of the unit took into account not only themathematics that could be learned using a SimCalcapproach, but also state standards that were essentialto address. Teachers were supported in their classroomuse of the materials through a set of teacher notes andprofessional development that focused on teachers’mathematics learning and effective implementationof the unit. The developers took into considerationthen-current state standards and assessments in theircurriculum and PD design.Technical Report 07June 20109
10 2010 SRI International — Design and Development of Curriculum Units and Professional Development21Lesson Practice Runs Faster Than Max Isabella Improves Info Quest Another Race Day A Race Day Managing theSoccer TeamActivitiesSteeper lines represent fasterspeeds.2. Describe patterns in a graph.If distance is constant, as theamount of time decreases, the speedincreases.5. Draw time/distance graphs for two movingobjects (each at a constant rate), given sufficientinformation. (e.g.; time, end points, relativetimes)4. Have a qualitative understanding that greaterslopes (informally, steeper) represent fastermotion, in time/distance graphs.3. Given a time/distance graph of the motion of twoobjects (single rate only each), determine thedistance between objects at a given time.1. Understand relationships among speed, time,and distance, as represented by graphs andnumbers or described in words.2. Identify the x-axis, y-axis, line graph, and givenmeaning for them in specific context.1. Find the speed of an object moving at a constantrate, starting at 0 time and 0 distance, bycalculating from the endpoints and later from anypoint on the line.Goals(students will be able to)For graphs of objects in motion ata constant speed (following theconventions above):In a graph of objects in motion ata constant speed in the coordinateplane, the x-axis typically representstime; the y-axis, distance; andthe speed can be found from anypoint on the line relating time anddistance.Mainmathematical ideasTable A1. Managing the Soccer TeamStudents explore the relationshipsamong lines of dashes of differentspeeds and duration.Students also find informationabout the real-life speed ofrunners and other objects andcreatures.Students are appointed astemporary team managers whenthe current manager mysteriouslyleaves town. The first task is totime players making dashes,straight-line runs designed toimprove players’ speed.Story lineAppendix AMath Content in the Managing the Soccer Team and Designing Cell Phone Games
Technical Report 07June 20101143Lesson Back At the Office Run, Jace, Run,Revisited Run, Jace, RunActivitiesThe same ideas as in lesson 2 aredeveloped in the context of moneyand objects.In previous lessons, speed couldbe calculated using the time anddistance at the endpoint of a graph.Now speed is a rate that relateseach time to a distance and can beexpressed as an equation with twovariables.1. Assuming a constant speed (proportionalrelationship), complete entries in a time/distancetable by a variety of valid methods reasoningacross and down table columns.Given an object moving at aconstant speed and a graph andtable representing related distancesand times, entries in the table canbe found given the numbers in tworows. Each row in the table can beused to calculate the speed. Everypoint on the associated line graphcan be used to calculate the constantspeed/steepness of the line. Fromthe table or the graph, it is possibleto write an equation that is also arepresentation of the constant speedand that can be used to find thedistance at any time.4. Identify graphs, equations, and tablesrepresenting the same proportional relationship.3. Describe a situation that could be representedby a given equation (using discrete, nonmotioncontext).2. Use the table to write an equation that relatesthe two variables.1. Assuming a constant rate relating two variables(proportional relationship), complete entries ina table by a variety of valid methods reasoningacross and down table columns.3. Identify graphs, equations, and tablesrepresenting the same proportional relationship.2. Use the table to write an equation that relatestime to distance.Goals(students will be able to)Mainmathematical ideasTable A1. Managing the Soccer Team (Continued)Managing the team includes offfield activities, too. This lessonuses problems about buyingsoccer cones and uniforms,for example, to develop thesame ideas of proportionalityand functions as in the earlieractivities. This also generalizesthe ideas presented earlier;they apply in more than motioncontexts.One student’s running is usedto explore and unite tables,equations, and graphs.Story line
12 2010 SRI International — Design and Development of Curriculum Units and Professional Development7 On the Road6 Graphs and Motion Road Trips Slope and RateActivities5Lesson Standing stillThis activity provides practice inmotion contexts, including singleand multiple-rate motions andthe coordination of graphs andnarratives. It also helps studentslearn to interpret “on sight” certaintypical multirate linear graphs. Going forward and then backward at the same rate Going one rate, then going at a slower rate for thesame amount of time Going one rate, then going at a faster rate for thesame amount of timeRecognize typical graph shapes for: The length of the 0 slope line indicates how longstanding still. 0 slope means standing still. Negative slope means going back. P ositive slope means moving ahead.2. Make these connections/ interpretations:1. Interpret graphs representing moving objectswith two or more rates; give contextual storyassociated with each graph. Given story, creategraph.2. Connect unit rate to slope. Understand slopeas a numerical description of the relationshipbetween any two points on a line.1. Understand and use definition of unit rate.Goals(students will be able to)No new mathematics content The length of the 0 slope linesegment gives the period of timethe object is standing still. When the slope is 0, therepresented object is not moving. Negative slope representsmoving backward (in the negativedirection.) Positive slope represents movingahead (in the positive direction.)Graphs with connected linesegments at different slopes canrepresent an object moving atdifferent speeds (with x-axis as time,y as distance)The definitions of rate, unit rate,and slope can be connectedto the previous contexts andrepresentations. A traditional wayto calculate slope is by creatingtriangles based on rise/run as relatedto a line graph.Mainmathematical ideasTable A1. Managing the Soccer Team (Continued)The team has a mysteriouslybad history of making trips tothe state championships. Thetrips are taken with both a busand a van. Students explore andcreate stories that match graphsrepresenting these trips.This activity is a pure mathematicstime-out to give mathematicalvocabulary for the conceptsexplored more informally earlier.Story line
Technical Report 07June 201013 MathematicallySpeaking Suiting Up How Far On owMuch? MPG All About MPG Summer Job Advice Salary NegotiationsActivitiesA unit rate tells how many y you getfor one x.If you can write a formula y kxwhere k is a real number and y andx represent varying quantities, witha single y value for each x, then wecan say that the quantities x and yvary proportionally.No new mathematics concepts.Exercises and problem solving useconcepts introduced earlier.Mainmathematical ideas1Lesson Our First CellPhone Game Yari, the YellowSchool Bus Cell Phone Gamesand Design Working at TexStarGamesActivities1. Find the distance that an object moves, its speed,and for how much time it travels given a time/distance graph of that motion represented as a line.Motion can be represented on atime/distance graph. Lines canrepresent idealized motion (withoutchanges in speed).3. Compare the graph of the motion of an object“idealized” as a line with a graph that is more accurate.2. Calculate speed from time and distance—fromthe endpoints of the graph and from any point onthe graph (beginning level).Goals(students will be able to)Use the definitions of unit rate and proportionality toidentify these concepts in the curriculum.Goals(students will be able to)Mainmathematical ideasTable A2. Designing Cell Phone Games108-9LessonTable A1. Managing the Soccer Team (Continued)Students are hired at the cellphone design firm TexStar Gamesto use math to improve thebusiness. The students use mathto design how the games wouldwork.Story lineStudents have done so well asinterim manager that they areoffered the job, with two choicesof salary. After they decide whichchoice is best, they then adviseother students who are facingsimilar issues in making summerjob choices.Story line
14 2010 SRI International — Design and Development of Curriculum Units and Professional Development5 ControllingCharacters withEquations3–4 Wendella’s Journey Better Games One to Another ControllingCharacters withGraphsActivities2LessonLines that are slanted downward(informal version of negative slope)represent moving backward.Flat (informal slope 0) lines representstanding still.You can tell a story to explain themotion of an object over time tomatch such a graph.Multisegment graphs can representan object moving at different speeds.One can translate among graphs,tables, and equations.Tables can help us write equations.The equation y kx b is a commonform for writing linear functions,where y and x are variables and kand b are constants. If x is time andy is distance, k usually representsspeed and b is the starting point ofthe objects.Equations are another form ofmathematical representation used torepresent functions (word used onlyinformally), as are tables.Graphs can be mathematicalrepresentations of motion, fromwhich students can comparepositions, speeds, and startingplaces of moving objects. For aposition/time graph, steeper linesrepresent faster speeds.Mainmathematical ideasTable A2. Designing Cell Phone Games (Continued)2. Create stories that match such graphs. Creategraphs that match stories about motion.1. Create graphs that represent forward motion atslower and faster speeds, backward motion andno motion.3. Complete tables, equations, and graphs basedon sufficient information across all three.2. Write equations of the form y kx b for movingobjects that start at different non-zero positions1. Write equations of the form y kx for movingobjects starting from a fixed origin (time 0,position 0).4. Interpret word problems about speeds, start, andend times using graphs.3. Understand the connection between informalslope and speed.2. Use math knowledge to change the speed ofobjects in the software by changing the graph.1. Find speed using multiple methods in a graph—unit rate, “slanty-ness” (informal version ofslope), and end points.Goals(students will be able to)Students create journeys for agame character that is a dogfeatured in a game about motion.Students use equations to controlthe motion of characters in cellphone games, including those withthree characters.Students use graphs to control thespeeds of cars in designing a roadrally game.Story line
Technical Report 07June 20101510 Secrets of AverageRate Revealed9 TexStar Games:Going Full Time LinearRelationships:Proportional andNon-propor-tional Problems from theTexStar Lunchroom Problem SolvingProportional relationships canbe expressed as y kx, linearrelationships can be expressed asy kx b. Therefore, proportionalrelationships are linear relationshipswhere b 0. When b is not to 0,then the linear relationship is nonproportional. All functions that are notlinear are also non-proportional.For example, if an object is travelingat several rates then the average rateis a single rate that will get the objectto the same place at the same time.Average rate is the single rate thatcould “stand in” for the rates to beaveraged; it would accomplish thesame thing.No matter how characters move, iftheir motion graphs have the sameendpoint then they meet at the sametime in the same place. Wolf and RedRiding Hood8 Crab VelocityVelocity is speed with direction.Negative rates indicate backwardmotion. Position can be negative,where 0 is a defined starting pointthat objects can be on either side of. MathematicallySpeaking: Graphsto Know7Multisegment graphs can be used toshow other kinds of accumulation overtime, such as money in a bank account.Mainmathematical ideas Money MattersActivities6LessonTable A2. Designing Cell Phone Games (Continued)Distinguish between proportional and nonproportional equations using graphs or equations orfrom situations expressed in words.3. Use graphs to estimate or calculate average rates.2. Solve problems involving average rates—to findaverage rates, missing rates, and to accountfor different amounts of time for various rates incalculating their average.1. Understand the connection between rates andtheir average.2. Use equations to represent a single rate that getsan object to the same place at the same time as anobject that is moving at two different rates.1. Make qualitative predictions of a single rate thatgets an object to the same place at the sametime as an object that is moving at two differentrates.2. Represent backward motion with negative ratesand do this in equations.1. Sketch graphs that show, for example,increasing and then decreasing rates of motion,increasing and then decreasing rates of savings.2. Predict using multisegment graphs.1. Interpret multisegment graphs in a time/moneysituation.Goals(students will be able to)Students explain to TexStar whythe work they have done in thepast 2 weeks qualifies them fora position; both mathematicaland nonmathematical work areincluded.Students solve problems from thebulletin board and conversation inthe lunchroom at work.Students analyze a game in whichplayers try to keep Red RidingHood from being ea
Design and Development of Curriculum Units . and Professional Development. Prepared by: Jennifer Knudsen, SRI International. Acknowledgments. This report is based on work supported by