Transcription
NPS National Transit Inventoryand Performance Report, 2015National Park ServiceWashington Support Office
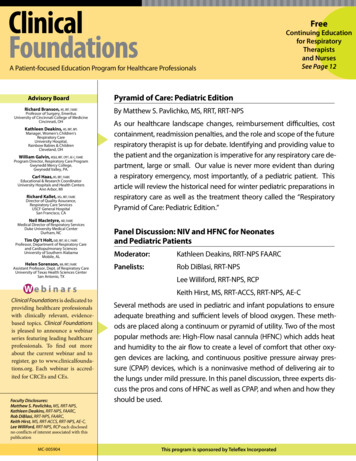
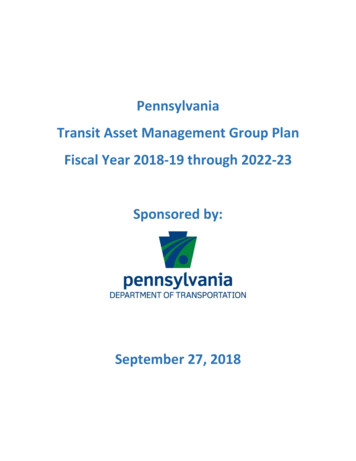
2015NPS National Transit Inventory and Performance ReportThis is a summary of the 4th annual NationalPark Service Transit Inventory and PerformanceReport. This effort:1) identifies NPS transit systems across thecountry,2) tracks the operational performance(boardings, runs, etc.) of each system, and3) inventories NPS and non-NPS owned transitvehicles and collects detailed vehicleinformation.64 ParksAnnual NPS Transit System Passenger Boardings50Represented42.9TransitSystems12742.9 MillionPassenger Boardings1,022 VehiclesPassenger Boardings 142015 In 2015, 127 transit systems operated in 64 of the 413 National Park Service units. Total passenger boardings across all systems were 42.9 million. NPS transit systems can mitigate emissions if NPS transit vehicles are, on average, at least 40 percentoccupied. Of the 127 systems, NPS owned and operated 20 systems with 275 vehicles. NPS transit vehicles have anestimated 39 million in recapitalization needs between 2016 and 2027.Business ModelMode(by # of transit systems)(by # of transit systems)Service Contract 9%Train, Trolley 3%Snowcoach 2%Plane 12%CooperativeAgreement12%NPS Owned& Operated16%Purpose(by # of transit systems)TransportationFeature 5%Special Needs 2%CriticalAccess26%ConcessionContract63%Boat, Ferry32%Shuttle, Bus, Van,Tram 51%Mobility to orWithin Park 28%InterpretiveTour 39%
NPS National Transit Inventory and Performance ReportPerformance MeasuresNPS leverages the private sector to provide themajority of transit services. 107 (84%) of NPStransit systems are operated by a non-NPS entityunder an agreement or contract. These systemsaccount for almost 99% of passenger boardingsservice-wide. The remaining 20 (16%) of transitsystems are owned and operated by NPS andaccount for the remaining 1% of boardings.2015NPS continues partnerships with local transitagencies. 13 systems are operated by a localtransit agency under a specific agreement withNPS. NPS shares the operations and maintenancecosts of several of these systems. This is anincrease of one system compared to 2014.The majority of the NPS-owned transit system vehicles are accessible for people withmobility impairments. A total of 68.7% NPS-owned vehicles are accessible to people withmobility impairments (e.g. require wheelchair lift), while 31.3% are not accessible.A higher percentage of NPS-owned vehicles operate on alternative fuel compared tonon-NPS transit vehicles. 60.4% of NPS-owned vehicles operate on alternative fuel, while16.8% of non-NPS-owned vehicles operate on alternative fuel.NPS transit systems mitigate vehicle emissions. Vehicle data was available for 54shuttle/bus/van systems to calculate emissions. If NPS transit vehicles are on average at least40% occupied, then NPS transit systems mitigate—rather than contribute—greenhouse gasemissions.NPS faces nearly 40 million in vehicle recapitalization needs in the next ten years.NPS-owned shuttle/bus/van/tram vehicles have an estimated 3.9 million in overduerecapitalization costs and 38.7 million in recapitalization needs between 2016 and 2027.Parks with estimated transit vehicle replacement costs over 1 million during the next ten yearsare: Adams National Historical Park, Glacier National Park, Grand Canyon National Park,Harpers Ferry National Historical Park, Yosemite National Park, and Zion National Park.
Table of ContentsList of Figures . iiiList of Tables . iiiAcronyms . ivIntroduction . 5Data Collection and Methodology . 5Inventory Results . 7Inventory Base-Data . 7System Characteristics . 9Passenger Boardings . 11Vehicles . 19Performance Measures. 23Visitor Experience . 23Operations . 24Environmental Impact . 25Asset Management . 27Next Steps . 30Appendix. 31Appendix A – Acknowledgments. 31Appendix B – Definition of Transit . 34Appendix C – NPS Alternative Transportation Program Goals and Objectives. 37Appendix D – 2015 NPS National Inventory System List . 39Appendix E – Estimated CO2 Emissions Methodology . 47Appendix F – Vehicle Replacement Assumptions . 49NPS National Transit Inventory and Performance Report, 2015ii
List of FiguresFigure 1: Systems by primary purpose . 9Figure 2: Systems by mode . 10Figure 3: Systems by business model . 11Figure 4: System locations and passenger boardings . 14Figure 5: Passenger boardings by NPS region. 15Figure 6: Systems by passenger boardings . 16Figure 7: Passenger boardings by mode . 17Figure 8: Passenger boardings by business model . 18Figure 9: Fleet ownership by business model . 19Figure 10: Fleet: conventional vs. alternative fuel vehicles by ownership . 20Figure 11: Number of vehicles by fuel type . 21Figure 12: Number of systems by fleet size . 21Figure 13: All vehicles by age class (years) . 22Figure 14: NPS-owned vehicle accessibility . 23Figure 15: Percent change in boardings from 2012 to 2015 . 24Figure 16: Estimated net CO2 emissions at various occupancy levels . 26List of TablesTable 1: NPS transit systems changes between 2012 and 2015 inventories . 7Table 2: Count methodology . 12Table 3: Passenger boardings for the 10 highest use transit systems . 12Table 4: Distribution of miles and CO2 emissions (metric tons) by vehicle ownership . 25Table 5: Estimated net CO2 emissions (metric tons) by vehicle ownership . 26Table 6: Vehicle age for NPS transit vehicle types . 27Table 7: Estimated NPS-owned shuttle/bus/tram/van overdue recapitalization needs, up to 2015 . 28Table 8: Estimated NPS-owned shuttle/bus/tram/van rolling stock capital needs, 2016-2027 . 29NPS National Transit Inventory and Performance Report, 2015iii
AcronymsThe following acronyms are used in this RVMTYOSEAlaska RegionAlternative Transportation ProgramAlternative Transportation Systems Lifecycle Asset ManagementBiscayne National ParkBoston Harbor Islands National Recreation AreaChannel Islands National ParkCarbon DioxideEverglades National ParkFinancial and Business Management SystemGlacier Bay National ParkGlen Canyon National Recreation AreaIntermountain RegionMarsh-Billings-Rockefeller National Historic ParkMoving Ahead for Progress in the 21st CenturyMidwest RegionNational Mall and Memorial ParksNational Capital RegionNortheast RegionNational Park ServicePacific West RegionSoutheast RegionSustainable Operations and Climate ChangeTall Grass Prairie National PreservePaul S. Sarbanes Transit in Parks ProgramValor in the Pacific National MonumentVehicle Miles TraveledYosemite National ParkNPS National Transit Inventory and Performance Report, 2015iv
IntroductionThe fourth annual National Park Service (NPS) Transit Inventory and Performance Reportcommunicates the service-wide outcomes and status of NPS transit systems (see Appendix A foracknowledgements). The 2012 inventory 1 was the first comprehensive listing of these systems since 1998,covering surface, waterborne, and air systems. The 2012 inventory established a working definition ofNPS transit systems for the purpose of this document; helped NPS comply with 23 U.S Code 203(c), 2which requires “a comprehensive national inventory of public Federal lands transportation facilities;”and, fulfilled other internal needs.The 2015 inventory is meant to assist the NPS: Advance NPS transit performance measurement;Capture asset management and operational information not captured by current NPS systems ofrecord;Supports the Green Parks Plan, the National Long Range Transportation Plan, Regional LongRange Transportation Plans, A Call to Action, and the Capital Investment Strategy by providingkey transit statistics, which can also be used to track progress towards goals;Integrate transit data with NPS systems of record, including asset management data in the Facilityand Business Management System for NPS-owned vehicles;Comply with Executive Order 13514, which requires federal agencies to measure, manage, andreduce greenhouse gas emissions; andCommunicate program information and projected vehicle (but not infrastructure)recapitalization needs internally and externally.Data Collection and MethodologyThe NPS has used the same objective definition of NPS transit systems for the transit inventory since 2012to ensure consistent data collection across the nation and over time. Only units with systems that meeteach of the following three criteria are included in this effort (see Appendix B for more information):1.2.3.1Moves people by motorized vehicle on a regularly scheduled service; 3Operates under one of the following business models: concessions contract; service contract;partner agreement including memorandum of understanding, memorandum of agreement, orcooperative agreement (commercial use authorizations are not included); or NPS-owned andoperated; 4 andAll routes and services at a given unit that are operated under the same business model by the sameoperator are considered a single NPS transit system.NPS National Transit Inventory, 2012. http://ntl.bts.gov/lib/47000/47800/47871/NPS WASO 2013 Transit Inventory.pdf223 U.S. Code 203 Federal lands transportation program: pdf/USCODE2014-title23-chap2-sec203.pdf3Services with a posted schedule that have standard operating seasons/days of week/hours. Services which do not operate on afixed route, or exist for the sole purpose of providing access to persons with disabilities, are not included.4For the purposes of the NPS transit inventories, no distinction is drawn between memorandum of understanding, memorandumof agreement, and cooperative agreement. All are recorded as “cooperative agreement.”NPS National Transit Inventory and Performance Report, 20155
The 2015 NPS Transit Inventory is limited to systems in which the NPS either has a direct financial stakeor has committed resources to develop a formal contract or agreement.The majority of systems tend to collect information on a calendar year cycle (January through December),therefore the following information was collected for the 2015 calendar year: Transit system name and description;Passenger boardings;Business model;System purpose;System type/mode;Vehicle information including fuel type, capacity, service miles, accessibility, and age (individualvehicle information for NPS-owned vehicles and system-level information for non-NPS vehicles);Vehicle information that is mandatory in the NPS’s Financial and Business Management System(FBMS);Owner and operator type (NPS or non-NPS) and contact information; andParticipation of a local transit agency in the service.The following steps were taken to update the inventory: Using the 2014 National NPS Transit Inventory as a starting point, regional transportationprogram coordinators identified new, closed, or consolidated systems, and updated unit contactinformation.64 park units were contacted to collect information, primarily using an online form, or throughemail or phone. Some parks reported incomplete information because they do not track therequested service information or they could not provide the information before the end of thedata call. All units responded except for two, 5 although some units did not report data for all oftheir systems. 6Data collection efforts were coordinated with known data sources, such as FBMS and the 15Transportation Fee Parks, to avoid duplicate data calls for park staff.Appendix D includes a full list of surveyed transit systems by region.5Wolf Trap National Park for the Performing Arts did not provide data for the Fairfax Connectors Wolf Trap Express. Glacier BayNational Park (GLBA) did not report data for the airport shuttle or day boat tour.6Several units provided data for some systems at their park, but not all. These non-reporting systems include: Sailors Haven Ferryat Fire Island National Sea Shore and the Yellowstone National Park snow coach system operated by Gary Fales Outfitting Inc.NPS National Transit Inventory and Performance Report, 20156
Inventory ResultsDetailed findings of the 2015 inventory are presented in the following sections: Inventory Base-DataSystem CharacteristicsPassenger BoardingsVehicle DataPerformance MeasuresInventory Base-DataTable 1 summarizes the differences in key findings of the NPS National Transit Inventory andPerformance Report results from 2012 through 2015.Table 1: NPS transit systems changes between 2012 and 2015 inventoriesSource: 2012 - 2015 NPS National Transit Inventory dataKey FindingsNumber of Systems20122013201420151471311211276866636433.2 million26.9 million36.5 million42.9 million6.1 million5.9 million5.6 million7.2 6765170874712121213Number of Parks RepresentedPassenger BoardingsExcluding 10 highest ridership systemsNumber of VehiclesSystems operated by Local Transit AgencyThree systems were not active or discontinued in 2015. The Biscayne (BISC) National Underwater ParkTour was not active due to contracting issues, and may commence service in 2017 under a newconcessions contract. The Yosemite National Park (YOSE) Big Trees Tram Tour (Mariposa Grove Tram)was discontinued at the end of 2014 due to the rehabilitation of the Mariposa Grove. The Marsh-BillingsRockefeller National Historical Park (MABI) Full Circle Trolley was a pilot project and was discontinuedat the end of 2014.Two new systems were added to the inventory in 2015, the DC Circulator at the National Mall andMemorial Parks (NAMA), and the Key West Sea Plane Adventures at Everglades National Park (EVER).Three systems resumed service in 2015: the Boston Lighthouse Tour at the Boston Harbor IslandsNational Recreation Area (BOHA); the Antelope Point ferry at the Glen Canyon National RecreationArea (GLCA); and the Tall Grass Prairie National Preserve (TAPR) shuttle bus. Additionally, existingsystems at Yellowstone (YELL) were reclassified, accounting for four additional systems in 2015.There was an approximately 17.5 percent increase in passenger boardings between 2014 and 2015. Thisincrease was led by boarding increases on the Zion National Park Canyon Shuttle (1.3 million additionalboardings) and on the Word War II Valor in the Pacific National Monument’s (VALR) USS ArizonaNPS National Transit Inventory and Performance Report, 20157
Memorial Tour (1.6 million additional boardings). It is important to note that more accurate passengerboarding data may have contributed to the increase as well. 7Five systems did not provide updated 2015 data. Those systems are excluded from any operations-relatedinformation presented (e.g. passenger boardings, service miles), but are included in general inventorydata, since the vehicle type, system purpose, and business model did not change.7Due to a discrepancy, Channel Islands National Park (CHIS) underreported its 2014 passenger boarding data.NPS National Transit Inventory and Performance Report, 20158
System CharacteristicsThe 2015 inventory identified 127 discrete transit systems throughout 64 of the total 413 NPS units.Figure 1, Figure 2, and Figure 3 place these systems in the context of primary system purpose, mode, andbusiness model. Results for system characteristics in 2015 are similar to the results reported previously in2014.System Purpose & ModeThere are five purposes identified for transit systems and unit staff identified which one was the primarypurpose for each system. Although transit systems often provide multiple purposes, unit staff identifiedthe primary purpose of each system. System purposes are described below and depicted in Figure 1. 49 systems are guided interpretive tours; 836 systems provide mobility to or within a park as a supplement to private automobile access;33 systems provide critical access to an NPS unit or site that is not readily accessible to the publicdue to geographic constraints, park resource management decisions, or parking lot congestion;6 systems are considered a transportation feature (a primary attraction of the park unit); and,3 systems meet the accessibility needs of visitors with special needs.Figure 1: Systems by primary purpose(N 127 systems)Source: 2015 NPS National Transit Inventory dataTransportationFeature65%Critical Access3326%Special Needs32%Interpretive Tour4939%Mobility to orWithin Park3628%8In 2016, the definition of interpretative tours will be further refined to determine if all systems fit within the definition of transitused for the report.NPS National Transit Inventory and Performance Report, 20159
The majority of the transit systems are shuttle/bus/van/tram systems (51 percent), followed by boat/ferry(32 percent), plane (12 percent), trains/trolley (3 percent), and snowcoach (2 percent) (see Figure 2).Figure 2: Systems by mode(N 127 systems)Source: 2015 NPS National Transit Inventory ry4132%Shuttle/Bus/Van/Tram6451%Business ModelsThere are four types of business models under which the 127 NPS transit systems operate, as shown inFigure 3. Concession Contracts: The majority of identified transit systems, 80 systems, operate throughconcession contracts under which a private concessioner pays the NPS a franchise fee to operateinside a unit. Seven concession contract systems utilize vehicle fleets owned by the NPS.Service Contracts: Transit systems that are primarily owned and operated by a private firm fallunder service contracts. In 2015, 12 transit systems operated under a service contract. Five servicecontract systems utilize vehicle fleets owned by the NPS.Cooperative Agreement: A local government agency or nonprofit operated 15 of the transitsystems under a cooperative agreement.NPS Owned and Operated: The NPS owned and operated 20 of the park transit systems. 9 Thesesystems tend to be small and provide critical access to a park or park site, are interpretive tours,9In total, the NPS owns vehicle fleets for 34 systems, operating 20 of those systems. The remaining systems are operated throughconcessions agreements (7), cooperative agreements (2), and service contracts (5).NPS National Transit Inventory and Performance Report, 201510
provide service for special needs visitors, or are a park transportation feature not easily providedby a private operator.Figure 3: Systems by business model(N 127 systems)Source: 2015 NPS National Transit Inventory dataService Contract129%CooperativeAgreement1512%NPS Owned andOperated2016%Concession Contract8063%Passenger BoardingsIn 2015, there were 42.9 million passenger boardings across all NPS transit systems. 10 If the 127 identifiedsystems were considered one enterprise compared to transit agencies across the country in the NationalTransit Database, that enterprise would rank 34th in the country in terms of passenger boardings. 11.Excluding concession contracts and cooperative agreements, NPS owned and operated systems andservice contract systems reported 15.5 million trips in 2015.Table 2 summarizes the methodologies park units use to count boardings. Systems indirectly record mostpassenger boardings through ticket sales (19.5 million) and manual counts (18.7 million). Estimated andautomated counter methodologies comprised approximately 4.0 million passenger boardings.10A “passenger boarding” or “unlinked trip” occurs each time a passenger boards a vehicle. This is an industry standard measureused in the Federal Transit Administration’s National Transit Database.11Federal Transit Administration National Transit Database, 2015 data. http://www.ntdprogram.gov/ntdprogram/NPS National Transit Inventory and Performance Report, 201511
Table 2: Count methodology(N 122 systems 12)Source: 2015 NPS National Transit Inventory dataNumber of SystemsPassenger Boardings(Millions)Ticket Sales5019.5Manual Counts5818.7Estimated63.9Automated Counter20.1Other60.7Count MethodologyApproximately 83.3 percent (35.7 million) of boardings on NPS transit systems in 2015 are attributable tothe 10 highest use transit systems (by boardings). Table 3 summarizes these systems and shows passengerboardings for 2015. Passenger boardings increased in 2015 for all of the top 10 systems.Table 3: Passenger boardings for the 10 highest use transit systemsSource: 2015 NPS National Transit Inventory dataRank12ParkSystem Name2015 Boardings1STLI/ELISStatue of Liberty Ferries10,343,6342GRCASouth Rim Shuttle Service7,419,9613ZIONZion Canyon Shuttle5,297,8604YOSEYosemite Valley Shuttle3,620,6235GOGA/ALCAAlcatraz Cruises ferry3,390,8506VALRUSS Arizona Memorial Tour2,673,8967NAMABig Bus Tours Washington DC 131,092,0498SAJUSan Juan Trolley739,8919ROMOBear Lake & Moraine Park shuttle,Hiker Shuttle to Estes Park577,02910VALRFord Island eContractCriticalAccessMobility to orwithin parkCriticalAccessMobility to orWithin Mobility to orWithin ParkCriticalAccessInterpretiveTourAn N of 122 is used to exclude the five systems that did not provide boarding information for 201513In 2014, the Volpe Center completed a study on passenger boardings for NAMA Big Bus Tours Washington, DC. Using themultiplier found in the study, the corrected 2014 boardings are 1,292,372. The multiplier was used to calculate 2015 boardings.NPS National Transit Inventory and Performance Report, 201512
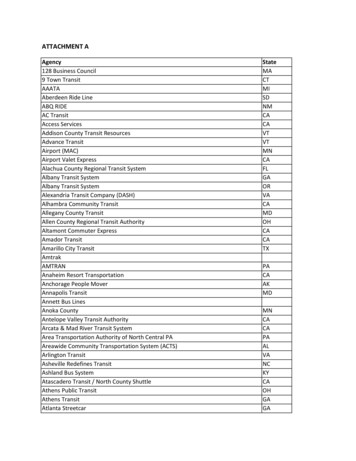
High-ridership shuttle systems are primarily provided via service contracts, while a greater proportion ofthe high-ridership water-based systems are provided through concession contracts. This likely reflects agreater business case for bidding out specialized water-based systems to concessioners. In many cases,these systems provide critical access to parks and park sites. High-ridership systems are located primarilyin the NPS Intermountain, Northeast, and Pacific West Regions.The number of cooperative agreements with local transit agencies increased from 12 systems in 2014 to 13systems in 2015 with the introduction of DC Circulator service to the National Mall. Those partnershipsaccounted for 5.7 million passenger boardings in 2015. Passenger boardings among NPS owned andoperated systems (20 systems) accounted for approximately 636,000 passenger boardings. Most of thesesystems either provide critical access to a unit/site or an interpretive experience for visitors.The Intermountain and Northeast NPS regions each reported slightly more than 13 million passengerboardings in 2015, far exceeding other regions; however, if one were to remove the ten highest usesystems from consideration, each region ranged from 400,000 to 1.8 million passenger boardings in 2015Figure 4 shows the geographic distribution of the systems, along with the passenger boardings, and Figure5 shows passenger boardings by region.NPS National Transit Inventory and Performance Report, 201513
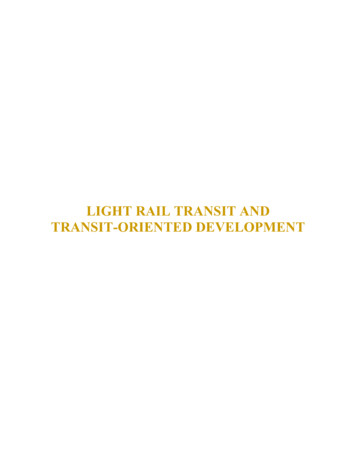
Figure 4: System locations and passenger boardings(N 121 systems)Source: 2015 NPS National Transit Inventory dataNPS National Transit Inventory and Performance Report, 201514
Figure 5: Passenger boardings by NPS region(N 122 systems)Source: 2015 NPS National Transit Inventory dataPassenger Boardings (Millions)16Top Ten13.314All Other R1.1NCRNPS National Transit Inventory and Performance Report, 20150.60.40.4AKRMWR15
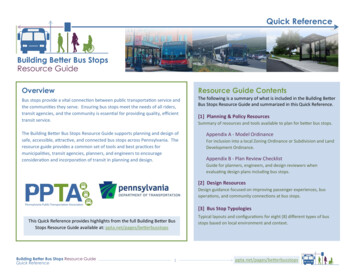
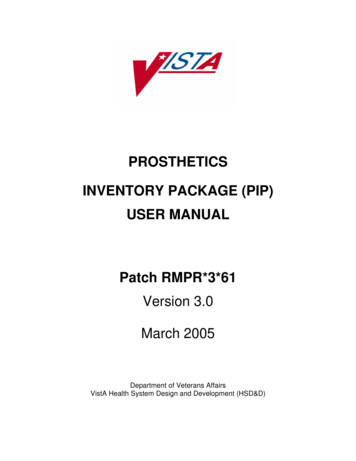
Figure 6 depicts the number of systems and the cumulative total number of passenger boardings atdifferent ranges of passenger boardings. The chart illustrates that while only 12 transit systems have over500,000 passenger boardings, these systems comprise the largest increase in the cumulative total numberof passenger boardings. Furthermore, 88 of the NPS transit systems had fewer than 100,000 passengerboardings, comprising 1.6 million of the total passenger boardings in 2015.Figure 6: Systems by passenger boardings(N 127 systems)Source: 2015 NPS National Transit Inventory data80Number of Systems40Number of Systems704535Passenger 04.325.66.14121100-200 200-300 300-400 400-500Passenger Boardings (Thousands)NPS National Transit Inventory and Performance Report, 2015Morethan 500105Passenger Boardings (Millions)42.98890016
Over half of passenger boardings were on shuttles/buses/vans/trams systems (56 percent) and just underhalf were on boats/ferries (42 percent). Trains/trollies, planes, and snowcoaches accounted for only abouttwo percent of all passenger boardings (see Figure 7).Figure 7: Passenger boardings by mode(N 122 systems)Source: 2015 NPS National Transit Inventory dataPassenger Boardings (Millions)3025Top Ten19M(44.3%)All Other %)NPS National Transit Inventory and Performance Report, 201544K(0.1%)8K(0.01%)17
Half of passenger boardings (50.4 percent) took place on systems operated under concession contracts.Service contracts carried 34.8 percent of passenger boardings, 13.1 percent under cooperativeagreements, and 1.4 percent under NPS owned and operated systems (see Figure 8). Excluding the 10highest use systems, concession contracts and cooperative agreements accounted for the majority ofboardings.Figure 8: Passenger boardings by business modelPassenger Boardings (Millions)(N 122 systems)Source: 2015 NPS National Transit Inventory data25Top Ten18.4All Other iceContract2.20.6Cooperative NPS OwnedAgreement and OperatedNPS National Transit Inventory and Performance Report, 201518
VehiclesVehicle FleetsOver half of the identified transit systems (80 systems, or 63 percent) operate under concession contracts,of which seven systems utilize vehicle fleets owned exclusively by the NPS. 14 These seven fleets are amongthe 34 total fleets owned by the NPS. The NPS owned and operated 20 of the transit systems (16 percent).These systems te
1. Moves people by motorized vehicle on a regularly scheduled service; 3 2. Operates under one of the following business models: concessions contract; service contract; partner agreement including memorandum of understanding, memorandum of agreement, or cooperative agreement (commercial use authorizations are not included); or NPS -owned and .