Transcription
The following slides are not contractual in nature andare for information purposes only as of June 2015.1 2015, Lockheed Martin Corporation. All Rights Reserved.
Corrective ActionRoot Cause Analysis and CorrectiveAction2 2015, Lockheed Martin Corporation. All Rights Reserved.
Overview Webinar 6: Root Cause Analysisand Corrective Action What is Root Cause Analysis (RCA)?Why is RCA important?When is RCA required?Overview of the Corrective Action ProcessRoot Cause Analysis Tools: The 5-Whys Ishikawa Cause & Effect (Fishbone) Diagrams Cause Mapping Failure Modes & Effects Analysis Design of Experiments3
What is Root Cause Analysis (RCA)?Root Cause Analysis (RCA): The process of identifying allthe causes (root causes and contributing causes) that haveor may have generated an undesirable condition, situation,nonconformity, or failure.» IAQG – Root Cause Analysis and Problem SolvingApril 2014.4
Root Cause Analysis (RCA)CAUSE ROOT(not obvious)CausePROBLEM Weed(obvious)Cause5
Why Root Cause Analysis (RCA)? Helps prevent problems from repeating or occurring. Focus on Continuous Improvement throughout theEnterprise. Drives Breakthrough Performance. Focus on improving processes that actually effectorganization performance metrics.6
When is RCA required? Undesirable condition, defect, or failure is detectedSafetyProduct strength, performance, reliabilityHigh impact on OperationsRepetitive ProblemsCustomer RequestSignificant Quality Management System (QMS) issues» IAQG – Root Cause Analysis and Problem Solving,April 20147
The Corrective Action (CA) ProcessIdentify Problem Objective: Identify the cause(s) of problems andinitiate actions to prevent recurrence. Extent of corrective actions shall beproportional to the effects of the relatedproblems. Corrective action is applicable to theenterprise and not limited to themanufacturing environment. Problems may originate and/or be identifiedwithin a product, process, and/or capability inany business area, function, or program.Define ProblemInvestigate ProblemAnalyze Problem and Identify Cause(s)Generate and Implement SolutionsVerify Results and DocumentMonitor and Meausure8
The Corrective Action ProcessIdentify Problem Increased focus on Problem Definition Requirement for Evidence-Based Causes Requirement to always look for MultipleCauses A Corrective Action end state that includes– Verified successful mistake proofedsolutions– Goal of 0% Chance of RecurrenceDefine ProblemInvestigate ProblemAnalyze Problem and Identify Cause(s)Generate and Implement SolutionsVerify Results and DocumentMonitor and Meausure9
Overview of the Corrective Action Process Step 1: Identify the Problem Step 2: Define the Problem Step 3: Investigate the Problem (Complete ContainmentActions) Step 4: Analyze the Problem & Identify Root Cause (s) Step 5: Generate, Select and Implement Solutions (CA) Step 6: Verify the Results and Document Step 7: Monitor and Measure Corrective Actions10
Corrective Action Process Flow:Inputs:NonconformingProducts or ServicesNoncompliantProcesses orCapabilitiesAudit FindingsCustomer ComplaintsManagementDirectivesProgram Monitoring orReviewIdentify ProblemDefine ProblemInvestigate ProblemAnalyze Problem and Identify Cause(s)Generate and Implement SolutionsVerify Results and DocumentMonitor and MeausureOutputs:Implemented/VerifiedCA PlanImprovedCapabilities/ProductsCosts ReducedSchedule ImprovedQuality ImprovedCustomer SatisfactionRecord of CorrectiveAction and Verification11
Corrective Action Process 7 tools to determine root cause:– The 5 Why's– Cause & Effect Diagram (Fishbone)– Cause Mapping– FMEA: Failure Modes & Effects Analysis– Fault Tree Analysis– DOE: Design Of Experiments– Statistical Process Control Perform a Cause/Failure Analysis to determine the cause(s) of the problem.The appropriate root cause analysis tool will be used. The RCA tools are utilized and retained/attached as objective evidence tosupport root cause validation.12
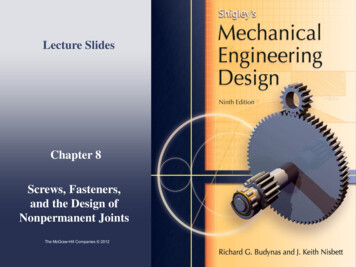
Occurrence Likelihood of the Event Recurring Severity/Impact Based RCA ApproachHigh Future failures with this andsimilar processes are inevitableLevel 3 RCALevel 4 RCAHighest Risk ItemsMost RCA Efforts100% at Level 5 RCALevel 2 RCALevel 3 RCALevel 4 RCALowest Risk ItemsLevel 1 RCALevel 2 RCALevel 3 RCALowMediumHigh Minor disruption to process Output may have to be sorted anda portion reworked Fit and finish does not conform Noticeable to some customers Minor disruption to process Portion may have to be scrapped Operable but without allconveniences Fit and finish does not conform Concerned customer DCMA Level II CARMedium Likely to find future failures withthis and similar processesLow May find future isolated failuresInstructions:1. Use the description of Low,Medium, High to assess issue’sSeverity and Likelihood ofRecurrence2. Based on the issue’s Severity andLikelihood of Recurrence, map tothe corresponding Level of RCA3. Using the color of the RCA Levelas a guide, assess therequirements for that RCA toolSeverity Significance of Impact Major disruption to process 100% may have to be scrapped Inoperable, loss of primaryfunction Dissatisfied customer DCMA Level III CAR
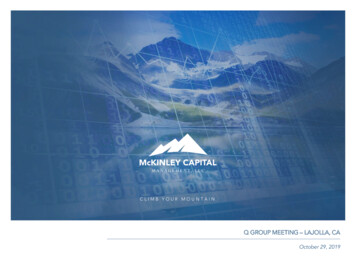
What RCA Tool Should I Use?RCALevel543ImpactRCA RequirementsRecommendedRCA LeadHigh-High Apollo RCA usingRealityCharting Tool Experienced andCertified Apollo RCAFacilitatorHigh-MediumMedium-High RCA using ThinkReliability Tool Apollo RCA usingRealityCharting Tool Experienced andCertified Apollo or ThinkReliability RCAFacilitator FMEA - Failure ModesEffects AnalysisHigh-LowMedium-Medium Apollo Methodology Apollo RealityChartingLow-High Think Reliability FMEA TrainedEmployee Apollo or ThinkReliability RCA TrainedFacilitator or 5 Whys Fishbone Diagram FMEA - Failure ModesEffects Analysis Trained Employee Green Belt / Black Belt 5 Whys Fishbone Diagram All Trained sisSpan*Output Templates2 – 6 Weeks1. Summary including Problem Statement2. RCA Findings and Conclusions3. RCA Corrective Action Solutions andMeasurement Strategy4. Illustration of Apollo RCA TemplateOR 1.Illustration of ApolloRCA Template1– 4 Weeks1. Summary including Problem Statement2. RCA Findings and Conclusions3. RCA Corrective Action Solutions andMeasurement Strategy4. Applicable Illustration of RCA TemplateOR 1.Applicable Illustrationof RCA Template1.2.1 day – 3 weeks 3.4.Summary including Problem StatementRCA Findings and ConclusionsRCA Corrective Action Solutions andMeasurement StrategyApplicable Illustration of RCA Template1 day – 2 weeks1.2.Summary including Problem StatementApplicable Illustration of RCA Template1 – 8 hours1.2.Summary including Problem StatementApplicable Illustration of RCA TemplateOR 1.Applicable Illustrationof RCA Template* Analysis Span Time for completion of an effective RCA is dependent upon:1) Scope of problem; 2) Quality of preparation; and 3) Resources allocated to RCA and problem resolution
Selecting a RCA Leader BasicAdvancedProblem ComplexityData type and availabilityType analyses requiredIndividual or team basedapproach RCA Severity of issue/impact tobusiness Internal/externalengagement15
Root Cause Analysis Tools The 5-Whys Cause & Effect (Fishbone/Ishikawa Diagrams) Cause Mapping Failure Modes & Effects Analysis Design of Experiments16
The 5 Why’s What is a 5 Why?– A question based technique used to explore cause-and-effect relationships– Determine root cause of a problem– Ask Why? As many times as needed! AdvantagesWhy?– Easy to use and teach– Identifies more than one cause– Useful for minor problems– Used to generate causes for use in other RCA methodsWhy?Why?Why?Why? Limitations– Linear thinking ignores additional causes– Not appropriate for formal investigations– Perpetuates the myth of single root cause– Does not provide guidance for solutions Supporting Tools– 5 Why Template - this is a text only approach17
5 Whys TemplateInstructions: Start with your focused problem and then ask WHY five times.Focused Problem Statement:Problem: High reject rate of parts used by downstream aircraft assembly processWhyThere is bare material exposedWhyThe primer paint coating does not cover the whole partWhyThe priming process does not ensure full coverageWhySolution: Create a standardwork method that definesthe exact sequence andtools for priming the parts.This will significantlyimprove the process yield.The priming process is never done the same way twiceWhyThe priming process has always relied on word-of-mouthtraining and has no standard process defined18
A New Look at 5 Why TemplatesTHE SINGLE CAUSE TEMPLATEPROBLEM STATEMENT:WHY?WHY?WHY?WHY?This example is a typical format for narrow problem statements where one cause-path exists. Forproblem statements with multiple causes, use the template below.MULTIPLE CAUSES TEMPLATEPROBLEM STATEMENT:WHY?WHY?WHY?WHY?% of Pareto12% of Pareto19
Proposed Operating Instruction for alternate 5Why Template20
Ishikawa Cause & Effect Diagram (Fishbone)What is A Cause and Effect Diagram? A– tool used to illustrate the relationship between an effect andthe causes that influence the effectWhen to Use It? Identify causes of a problem (Effect) Can be used to prevent future NTABSENTEEISMSOLDERTRAININGINSERTIONESDDEBRISP. C. BoardYield Too LowINCORRECTGAGEAUTO TESTSHORTAGEWRONG 21
Ishikawa Cause & Effect Diagram (Fishbone)Advantages–Encourages brainstorming–Can be used when time is very limited–Helps organize many potential causesLimitations–Categories may cause investigations to stop at "categorical causes”–Creates the illusion of equal weight among causes–No guidance for prioritizing causes or developing solutions–Usually stops at 1 or 2 levels of causes (stops too BSENTEEISMSOLDERTRAININGINSERTIONESDDEBRISP. C. BoardYield Too LowINCORRECTGAGEAUTO TESTSHORTAGEWRONG 22
Ishikawa Cause & Effect Diagram (Fishbone)– every Effect there are likely to be several Major Causes For Major Causes include: People, Measurements, Machines, Methods,Materials, Environment Any major category that helps people think creatively can be SENTEEISMSOLDERTRAININGINSERTIONESDDEBRISP. C. BoardYield Too LowINCORRECTGAGEAUTO TESTSHORTAGEWRONG 23
Ishikawa Cause & Effect Diagram (Fishbone) Methods work instructions, procedures, test methodsMaterial components and raw materialsMeasurements standards, calibration, gages, data collectionPeople training and staffingMachines tools, equipment, fixturesEnvironment temperature, humidity, lighting, noiseGoal is to discover all possible Causes related to the TABSENTEEISMSOLDERTRAININGINSERTIONESDDEBRISP. C. BoardYield Too LowINCORRECTGAGEAUTO TESTSHORTAGEWRONG 24
Ishikawa Cause & Effect Diagram (Fishbone)How to Construct a Cause & Effect Diagram: Brainstorm – include Subject Matter Experts (SME) Add the problem to the EFFECT box. Add the Major Cause categories Place the potential causes in the Major Cause category. For each Cause ask, “Why does it happen?” List the responses as branches off the Major ENTABSENTEEISMSOLDERTRAININGINSERTIONESDDEBRISP. C. BoardYield Too LowINCORRECTGAGEAUTO TESTSHORTAGEWRONG 25
Ishikawa Cause & Effect Diagram (Fishbone)How to Interpret?– Look for causes that appear frequently.– Reach a team consensus.– Determine the relative frequencies of the different TABSENTEEISMSOLDERTRAININGINSERTIONESDDEBRISP. C. BoardYield Too LowINCORRECTGAGEAUTO TESTSHORTAGEWRONG 26
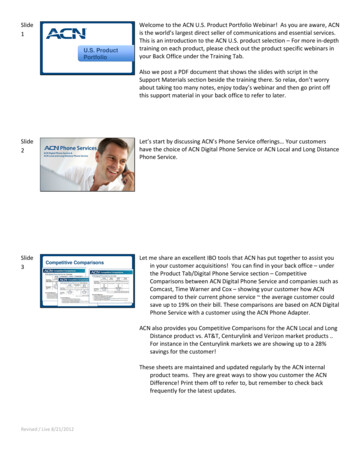
Example of Cause & Effect DiagramMaterialsMachinesMeasurementGas Gauge BrokenStarter BrokenLost the KeysBattery DeadOut of GasEngine OverheatedBattery Cables CorrodedCar Will Not StartNot Pressing AcceleratorLack of TrainingToo ColdUsing Wrong KeyLocked Out of CarNo Preventive MaintenanceForgot Code to Start CarMethodsPeopleEnvironment27
Example C&E Diagram - Canopy Leakage28
What is a Cause Map? A visual explanation of why an incident occurred Connects single cause-and-effect relationships to a systemof causes A Cause Map can be basic or very detailed29
Cause Mapping for Root CauseStep 1: Problem Statement Identify/Outline the Problem (What, When, Where, Goal) The Outline explains why time is spent on an issueStep 2: Analysis Identify/Breakdown the Causes This step is where the Cause Map is builtStep 3: Solutions Identify Possibilities Select the most appropriate Solution Implement specific Corrective Action Verify/Validate Effectiveness Document with Objective Evidence30
Cause Mapping - How to read a Cause MapState the ProblemAsk Why Questions - "Why did this effect happen?"Record Response Cause (or causes)31
Cause Map ExamplePushing cartStandard procedure forpicking up/deliveringitems to work areaEvidence:Safety GoalsImpactedPossibleSolutions:MelissaInjured RightshoulderHeavy load oncartThere is notcurrent loadlimitStandard loadlimit can notbe definedEvidence:Cart was notrolling rightPossibleSolutions:Wheel wasjammedPossibleSolutions:Twig/stickstuck in wheelCarts are alsoused outsideEvidence:32
Cause Mapping When to Use It:– Use to develop an effective solutions to prevent recurrence of undesired effects– Use when you want to fully understand causes of success– Use to reveal the entire system of causes– Use it when you need to dive deeper into a problem Advantages:– R
The appropriate root cause analysis tool will be used. The RCA tools are utilized and retained/attached as objective evidence to support root cause validation. Severity/Impact Based RCA Approach High Future failures with this and similar processes are inevitable Level 3 RCA . Level 4 RCA. Highest Risk Items Most RCA Efforts 100% at Level 5 RCA: MediumOccurrence Likely to find .