Transcription
Minnesota State Colleges and Universities#RealCollege Survey ReportMarch 20201FOR COLLEGE,C O M M U N I T Y,AND JUSTICE
Executive SummaryNow in its fifth year, the #RealCollege survey is the nation’s largest, longest-running annualassessment of basic needs security among college students. In the absence of any federal data onthe subject, The Hope Center for College, Community, and Justice created the survey to evaluateaccess to affordable food and housing among college students.This report describes the results of the #RealCollege survey administered in the fall of 2018and 2019 at 28 of the 37 public two-year and four-year colleges and universities in Minnesota, asubset of the 227 institutions surveyed across the United States.In 2018 and 2019, approximately 9,812 students from 25 two-year and three four-year collegesin Minnesota responded to the #RealCollege survey. The results indicate: 37% of respondents were food insecure in the prior 30 days 48% of respondents were housing insecure in the previous year 18% of respondents were homeless in the previous yearCompared to students attending two-year colleges elsewhere in the country, students surveyedin Minnesota’s two-year colleges experience somewhat lower rates of food insecurity and housinginsecurity, and a higher rate of homelessness. However, the rates of these challenges are stillsubstantial. In addition, among the four-year college students surveyed in Minnesota, rates ofhousing insecurity are higher, while rates of food insecurity and homelessness are lower whencompared to rates nationally.1There is wide variation in rates of basic needs insecurity across institutions in Minnesota. As istrue nationwide, basic needs insecurity continues to be more common for students attendingtwo-year colleges than those attending four-year colleges. For example, housing insecurity ratesfor two-year colleges generally range between 38% and 58%. Students often marginalized inhigher education are at greater risk of basic needs insecurity while attending Minnesota Statecolleges and universities. These groups include students identifying as Indigenous, AmericanIndian or Alaskan Native, and Pacific Islander or Native Hawaiian; those identifying as nonbinary ortransgender; and those who are former foster youth or returning citizens.Minnesota State colleges and universities are taking steps to advance access to public benefitsfor their students. Our findings highlight the need for continued evolution of programmaticwork to advance cultural shifts on college campuses, increased engagement with communityorganizations and the private sector, more robust emergency aid programs, and a basic needs–centered approach to government policy at all levels.2FOR COLLEGE,C O M M U N I T Y,AND JUSTICE
IntroductionMost colleges and universities are striving to build enrollment and increase college completionrates. Their efforts include changes to student advising practices, the structure of academicprograms and teaching, and the strategic use of scholarships. But until recently, few institutionsidentified basic needs insecurity as a significant challenge keeping students from obtainingcredentials. In 2018, the U.S. Government Accountability Office (GAO) issued a report on foodinsecurity among college students stating that “increasing evidence indicates that some collegestudents are experiencing food insecurity, which can negatively impact their academic success.”The GAO concluded that the “substantial federal investment in higher education is at risk ifcollege students drop out because they cannot afford basic necessities like food.” 2The #RealCollege survey is one of 31 studies the GAO reviewed for its report. It assistscollege administrators, trustees, staff, faculty, and students, along with community partners,policymakers, and advocates, in understanding the prevalence and correlates of food andhousing insecurity on college campuses across the nation. The report provides the most up-todate evidence, and this year’s report includes other key factors affecting basic needs insecurity,including transportation and childcare. The data provide ample reason to center efforts to addressstudents’ basic needs as institutions seek to become “student-ready” colleges where degreecompletion is common.3Supporting students’ basic needs has many benefits for colleges and universities, especiallyin today’s difficult economic climate. Here are five key reasons why institutions are doing#RealCollege work. Addressing #RealCollege issues:1. Boosts academic performance, helping the institution and its students retain federal financialaid. It also promotes retention and degree completion, helping the institution generate moretuition dollars and improving outcomes about which legislators care.2. Reduces the barriers that returning adults face, boosting enrollment.3. Makes the jobs of faculty and staff easier, as students are more able to focus on learning.4. Creates bridges between the institution and community organizations, bringing newrelationships and resources to bear. It also creates a productive opportunity for the privatesector to engage with the institution to help create the graduates that everyone wants to hire.5. Generates new philanthropic giving and create opportunities to engage alumni who do nothave much but will happily contribute to emergency aid.There are many paths to implementing programs and policies to support students’ basicneeds, several of which are listed at the conclusion of this report. The Hope Center stronglyrecommends focusing on prevention, rather than only responding to emergencies, and finds thatsystemic reforms are far more effective than one-time solutions.3FOR COLLEGE,C O M M U N I T Y,AND JUSTICE
Minnesota has been making strides in addressing students’ basic needs. In 2019 Governor TimWalz signed a Hunger-Free Campus Act, which encourages campuses to establish food deliverysystems (like food pantries), have a campus hunger task force, hold a hunger awareness event,provide information to students on programs that reduce food insecurity, and establish anemergency assistance grant for students. He also declared a College Food Insecurity AwarenessDay in October 2019. In addition, the Minnesota Legislature established the EmergencyAssistance for Postsecondary Students Grant Program in May 2017. This program providesfunding and resources to Minnesota State colleges and universities with a demonstrable homelesspopulation. Grant funds are intended to meet immediate student needs related to housing, food,and transportation that would otherwise prevent students from completing their term. Studentadvocacy, including via LeadMN, has been essential to securing this support.Later this year, the federal government will—for the first time—begin assessing food andhousing insecurity among students with the National Postsecondary Student Aid Survey, a stepthe Hope Center has long advocated. In addition, numerous other organizations have begunincluding similar assessments in their surveys, including the Trellis Financial Wellness Survey, theCommunity College Survey of Student Engagement (survey questions now in the pilot stage),the ACHA-National College Health Assessment, and the CIRP Freshman Survey. In addition,some colleges and universities are integrating basic needs insecurity assessments into their earlywarning systems and institutional surveys. The Hope Center is heartened by this response andcontinues to provide technical support in several ways, including the publication of a guide forassessment tools.4FOR COLLEGE,C O M M U N I T Y,AND JUSTICE
2019 Findings OveriewThis report presents findings from the 2018 and 2019 #RealCollege surveys on basic needs ofstudents in Minnesota State colleges and universities. Section 1 presents the overall rates ofbasic needs insecurity across all survey respondents. Section 2 shows disparate rates of basicneeds insecurity by specific groups of students. Section 3 describes the work and academicexperiences of students with basic needs insecurity. Section 4 describes students’ utilizationof public assistance and on-campus supports. Section 5 contains concluding remarks andrecommendations.For more information on survey participants and methodologies used for this report, refer to the2019 web appendices and the 2018 report.THE DATAThe data elements in this report were gathered using an online survey fielded to all enrolledstudents at participating colleges and universities. Colleges distributed the online survey to morethan 93,900 enrolled students, yielding an estimated response rate of 10.5%, or approximately9,810 total student participants. In this report, we drew on data from the 2018 and 2019#RealCollege surveys for our key measures: rates of food insecurity, housing insecurity, andhomelessness. More detailed breakdowns were based solely on data from the 2019 #RealCollegesurvey. For more information on how the survey was fielded and a discussion of howrepresentative the results are, refer to the web appendices.The following Minnesota State colleges and universities participated in the fall 2018 & 2019 survey:Two-year colleges Alexandria Technical & Community College(2019) Anoka Technical College (2019) Anoka-Ramsey Community College (2019) Central Lakes College Brainerd (2019) Central Lakes College Staples (2019) Dakota County Technical College (2019) Fond du Lac Tribal and Community College(2019) Hennepin Technical College (2018) Hibbing Community College (2019) Inver Hills Community College (2018) Itasca Community College (2019) Mesabi Range College (2019) Minneapolis Community and TechnicalCollege (2019) Minnesota State College Southeast (2019) Minnesota State Community and TechnicalCollege (2018 & 2019)5 Normandale Community College (2018)North Hennepin Community College (2018)Northland Community and Technical College(2019)Northwest Technical College (2019)Rainy River Community College (2019)Ridgewater College (2019)Riverland Community College (2019)Rochester Community & Technical College(2019)Saint Paul College (2019)St. Cloud Technical and Community College(2018 & 2019)Four-year colleges Metropolitan State University (2018 & 2019) Minnesota State University Moorhead (2019) Southwest Minnesota State University(2019)FOR COLLEGE,C O M M U N I T Y,AND JUSTICE
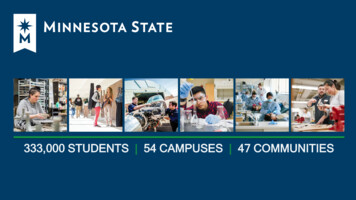
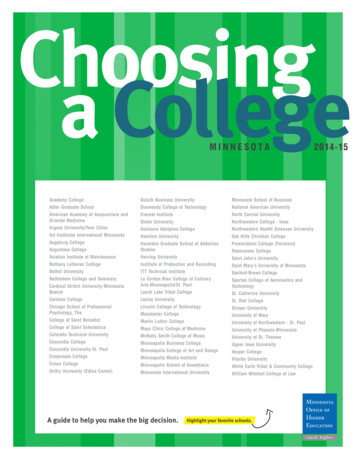
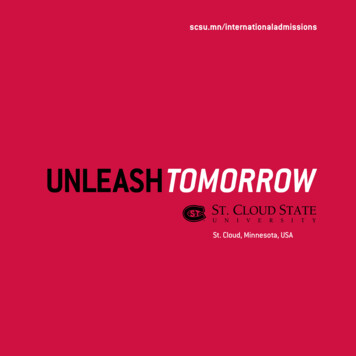
SECTION 1:Prevalence of Basic Needs InsecurityWhat fraction of students are affected by basic needs insecurity? This section examines theprevalence of food insecurity during the month prior to the survey, and the prevalence of housinginsecurity and homelessness during the previous year.FOOD INSECURITYFood insecurity is the limited or uncertain availability of nutritionally adequate and safe food, orthe ability to acquire such food in a socially acceptable manner. The most extreme form is oftenaccompanied by physiological sensations of hunger. The survey assesses food security amongstudents using the U.S. Department of Agriculture’s (USDA) 18-item set of questions.4How prevalent is food insecurity among survey respondents at Minnesota State colleges anduniversities? During the 30 days preceding the survey, approximately 39% of survey respondentsattending two-year institutions experienced food insecurity, with 23% assessed at the lowlevel and 16% at the very low level of food security (Figure 1). Approximately 33% of surveyrespondents attending four-year institutions experienced food insecurity, with 14% assessedat the low level and 19% at the very low level of food security. About one in three respondentsattending two-year institutions ran short on food, and 26% said that they went hungry, comparedto 25% and 20% of respondents at four-year institutions, respectively (Figure 2).52%6048%14%16%40Cumulative Percentage (%)80100FIGURE 1. Food Security Among Minnesota Survey RespondentsHighMarginalLowVery Low16%2014%023%Two Year19%Four YearSource: 2018 & 2019 #RealCollege surveysNotes: According to the USDA, students at either low or very low food security are termed “food insecure.” For moredetails on the food security module used in this report, refer to the web appendices. Cumulativepercentages may not add up to 100 percent due to rounding.6FOR COLLEGE,C O M M U N I T Y,AND JUSTICE
FIGURE 2. Food Security Among Minnesota Survey RespondentsTwo-Year42%40%32%33%31%26%24%15%9%6%I couldn't afford to eat balanced meals.I worried whether my food would run out before I gotmoney to buy more.The food that I bought did not last and I did not have themoney to buy more.I cut the size of meals or skipped meals because therewas not enough money for food.I ate less than I felt I should because there was notenough money for food.I was hungry but did not eat because there was notenough money for food.I cut the size of meals or skipped meals because therewas not enough money for food (3 or more times).I lost weight because there was not enough money forfood.I did not eat for a whole day because there was notenough money for food.I did not eat for a whole day because there was notenough money for food (3 or more : 2019 #RealCollege SurveyNotes: For more details on the food security module used in this report, refer to the web appendices.7FOR COLLEGE,C O M M U N I T Y,AND JUSTICE
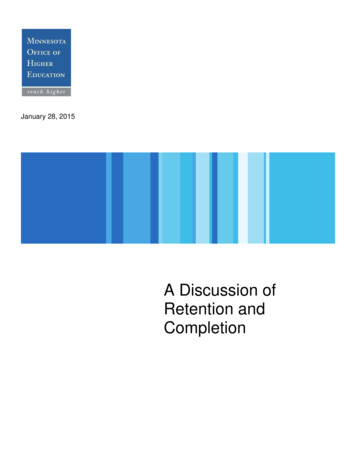
HOUSING INSECURITY AND HOMELESSNESSHousing insecurity includes a broad set of housing challenges that prevent someone from havinga safe, affordable, and consistent place to live. Housing insecurity among students was assessedwith a nine-item set of questions the Hope Center developed, which looks at factors such as theability to pay rent or utilities and the need to move frequently. The data show that many studentsare more likely to suffer some form of housing insecurity than to have all their needs met duringcollege.Among survey respondents at Minnesota State colleges and universities, 49% at two-yearinstitutions and 43% at four-year institutions experienced housing insecurity in the past 12months (Figure 3). The most commonly reported challenge is experiencing a rent or mortgageincrease that made it difficult to pay (19% of students at two-year institutions and 18% at four-yearinstitutions). Seven percent of survey respondents at two-year institutions and 5% at four-yearinstitutions left their household because they felt unsafe.FIGURE 3. Housing Insecurity Among Minnesota Survey RespondentsTwo-Year49%19%19%20%16%16%8%7%4%1%Any itemHad a rent or mortgage increase that made it difficult topayDid not pay full amount of rent or mortgageDid not pay full amount of utilitiesHad an account default or go into collectionsMoved in with people due to financial problemsLived with others beyond the expected capacity of thehousingLeft household because felt unsafeMoved three or more timesReceived a summons to appear in housing courtFour-Year43%18%15%13%11%13%8%5%4%1%Source: 2018 & 2019 #RealCollege surveysNotes: In the above graph, the top percentage, “Any item,” represents the rate of housing insecurity for all Minnesotasurvey respondents in 2018 and 2019. All other percentages represent 2019 rates. For more details on the housinginsecurity module used in this report, refer to the web appendices.8FOR COLLEGE,C O M M U N I T Y,AND JUSTICE
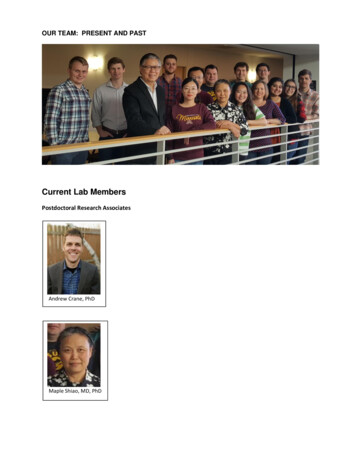
Homelessness means that a person does not have a fixed, regular, and adequate place to live.Students were identified as homeless if they responded affirmatively to a question asking if theyhad been homeless or they identified living conditions that are considered signs of homelessness.California State University researchers developed the tool used in this report to assesshomelessness. Using an inclusive definition of homelessness that lets respondents self-identifyboth their status and living condition allows more students to receive the support they need, aswell as aligning with the McKinney-Vento Homelessness Assistance Act.5 A recent BrookingsInstitution study of K-12 students found that “academic outcomes for doubled-up homelessstudents and other homeless students are almost indistinguishable from one another.”6How prevalent is homelessness? Homelessness affected 18% of survey respondents at two-yearinstitutions and 15% at four-year institutions in Minnesota (Figure 4). Five percent of respondentsat two-year institutions self-identified as homeless; 13% experienced homelessness but did notself-identify as homeless. Two percent of respondents at four-year institutions self-identified ashomeless; 13% experienced homelessness but did not self-identify as homeless. The vast majorityof students who experienced homelessness temporarily stayed with a relative or friend, or couchsurfed.9FOR COLLEGE,C O M M U N I T Y,AND JUSTICE
FIGURE 4. Homelessness Among Minnesota Survey RespondentsTwo YearAny itemFour Year18Self identified homeless5152Locations stayed overnight:Temporarily with relative,friend, or couch surfing12In a camper or RV845Temporarily at a hotel or motel withouta permanent home to return to22In closed area/space not meant for humanhabitation (such as a car or van)2121At a treatment center (suchas detox, hospital, etc.)21In transitional housing orindependent living10At a shelter1010At outdoor locationAt a group home such as halfway houseor residential program for mentalhealth or substance abuse0 10 203040 0 10 203040Percentage EndorsingStatement (%)Source: 2018 & 2019 #RealCollege surveysNotes: In the above graph, the top percentage, “Any item,” represents the rate of homelessness for all Minnesotasurvey respondents in 2018 and 2019. All other percentages represent 2019 rates. For more details on thehomelessness module used in this report, refer to the web appendices.10FOR COLLEGE,C O M M U N I T Y,AND JUSTICE
OVERLAPPING CHALLENGESStudents often experience basic needs insecurity in one or more forms, either simultaneously orover time. Students’ overlapping challenges in the data demonstrate that basic needs insecuritiesare fluid and interconnected.Among Minnesota students responding to the survey, 60% at two-year institutions experiencedfood insecurity, housing insecurity, or homelessness during the previous year, whereas 54% offour-year students did (Figure 5). Thirty percent of respondents from two-year institutions and23% from four-year institutions were both food and housing insecure in the past year.FIGURE 5. Intersections of Food Insecurity, Housing Insecurity, and HomelessnessAmong Minnesota Survey RespondentsTwo YearNo needs ("Secure")Four Year40Food Insecure, Housing Insecure,or Homeless ("Insecure")4660Food and Housing Insecure5430Housing Insecure and Homeless2314Food Insecure and Homeless11110208406080 100 020406080 100Percentage (%)Source: 2018 & 2019 #RealCollege surveysNotes: For more details on how each measure of basic needs insecurity was constructed, refer to the webappendices.11FOR COLLEGE,C O M M U N I T Y,AND JUSTICE
VARIATION BY INSTITUTIONRates of basic needs insecurity vary not only in type and severity among students, but acrossinstitutions as well (Figure 6). There is wide variation in rates of basic needs insecurity acrossMinnesota State colleges and universities. This variation could be attributed to a number offactors, including regional differences across the state. Institution-level rates of food insecurityrange between 27% and 53% at two-year institutions and between 23% and 42% at four-yearinstitutions. Rates of housing insecurity vary widely across institutions as well: 20% to 65% ofstudents attending two-year institutions experienced housing insecurity, as did 31% to 58% ofstudents attending four-year institutions. Institution-level of rates of student homelessness rangefrom 10% to 28% at two-year institutions and from 14% to 16% at four-year institutions.Number ofInstitutions0 2 4 6 8 1012 14FIGURE 6. Variation in Institutional Rates of Food Insecurity, Housing Insecurity,and Homelessness Among Minnesota State Colleges and Universities200200204060Institutional Rate of Food Insecurity (%)80100406080Institutional Rate of Housing Insecurity (%)100Number ofInstitutions0 2 4 6 8 1012 14Number ofInstitutions0 2 4 6 8 1012 1404060Institutional Rate of Homelessness (%)Two Year80100Four YearSource: 2018 & 2019 #RealCollege surveysNotes: For more details on institutional rates shown in the figure above, refer to the web appendices.12FOR COLLEGE,C O M M U N I T Y,AND JUSTICE
SECTION 2:Disparities in Basic Needs InsecurityThe Hope Center’s prior work, as well as that of others, has consistently found that some studentsare at higher risk of basic needs insecurity than others.7 This section highlights disparities in basicneeds insecurity by student demographic, academic, or economic characteristics, as well as theirlife circumstances. Below we highlight several ways in which basic needs insecurity differs.For more on demographic disparities and additional tables with information on surveyparticipants, refer to the web appendices.Racial/ethnic disparities are evident. For example, White students have lower rates of foodinsecurity (32%) as compared to their peers; rates of food insecurity are higher among PacificIslander or Native Hawaiian (50%), Black (53%), and Indigenous (67%) students (Table 1). Ratesof housing insecurity are consistently higher than those of food insecurity and the patternsacross groups are similar (Table 1). Students who identify as Indigenous or as American Indian orAlaska Native have the highest rates of homelessness, followed closely by Hispanic or Latinx andBlack students; as with the other basic needs insecurities, White students have lower rates ofhomelessness than most of their peers.13FOR COLLEGE,C O M M U N I T Y,AND JUSTICE
TABLE 1: Disparities in Basic Needs Insecurities by Race and Ethnicity AmongMinnesota Survey RespondentsRacial or Ethnic BackgroundAmerican Indian or Alaska NativeBlackHispanic or LatinxIndigenousMiddle Eastern or North African orArab or Arab AmericanOther Asian or Asian AmericanPacific Islander or Native HawaiianSoutheast AsianWhiteOtherPrefer not to answerNumber 2111172034Source: 2019 #RealCollege SurveyNotes: The “Number of Students” column indicates the number of survey respondents to our measure ofhomelessness. The number of survey respondents for our measures of food insecurity and housing insecurity mayvary slightly. Classifications of racial/ethnic background are not mutually exclusive. Students could self-identify withmultiple classifications. For more details on how each measure of basic needs insecurity was constructed, see webappendices.14FOR COLLEGE,C O M M U N I T Y,AND JUSTICE
The rate of housing insecurity for students attending college full-time is 43%, while the housinginsecurity rate for students attending part-time is 51%. Students that have spent more than threeyears in college are more likely to experience housing insecurity than those who have been incollege for less than one year (Table 2).TABLE 2: Disparities in Basic Needs Insecurities by Enrollment Status AmongMinnesota Survey RespondentsCollege Enrollment StatusFull-time (at least 12 credits)Part-time (fewer than 12 credits)Level of StudyUndergraduateGraduateNon-degreeYears in CollegeLess than 11 to 2Three or morePrefer not to answerNumber 1634Source: 2019 #RealCollege SurveyNotes: The “Number of Students” column indicates the number of survey respondents to our measure ofhomelessness. The number of survey respondents for our measures of food insecurity and housing insecurity may varyslightly. For more details on how each measure of basic needs insecurity was constructed, see web appendices.15FOR COLLEGE,C O M M U N I T Y,AND JUSTICE
Students’ basic needs insecurity varies with respect to their gender identity and sexual orientation(Table 3). Food insecurity and housing insecurity are lowest for male students; non-binaryand transgender students have the highest rates of food and housing insecurity as well ashomelessness.TABLE 3: Disparities in Basic Needs Insecurities by Gender Identity and SexualOrientation Among Minnesota Survey RespondentsGender IndentityFemaleMaleNon-binary/Third genderTransgenderSelf-DescribeSexual OrientationHeterosexualGay or LesbianBisexualSelf-describeNumber ce: 2019 #RealCollege SurveyNotes: The Number of Students column indicates the number of survey respondents to our measure of homelessness.The number of survey respondents for our measures of food insecurity and housing insecurity may vary slightly.Classifications of gender identity are not mutually exclusive. Students could self-identify with multiple classifications.For more details on how each measure of basic needs insecurity was constructed, see web appendices.16FOR COLLEGE,C O M M U N I T Y,AND JUSTICE
In addition, particular life circumstances are associated with a higher-than-average risk of basicneeds insecurity. Parenting students, former foster youth, and returning citizens are more likelyto experience basic needs insecurity than their peers (Table 4). For example, 48% of parentingstudents experience food insecurity and 63% experience housing insecurity—rates of insecurityhigher than their peers without children (33% and 41%, respectively). Nearly one third ofreturning citizens and former foster youth experience homelessness, almost double the averagerate (18%).TABLE 4: Disparities in Basic Needs Insecurities by Student Experience AmongMinnesota Survey RespondentsParenting StudentYesNoStudent has Been in Foster CareYesNoStudent Served in the MilitaryYesNoStudent is a Returning CitizenYesNoNumber 3317 605,0553836524517182875,095533572443316Source: 2019 #RealCollege SurveyNotes: The Number of Students column indicates the number of survey respondents to our measure of homelessness.The number of survey respondents for our measures of food insecurity and housing insecurity may vary slightly.Classifications of gender identity are not mutually exclusive. Students could self-identify with multiple classifications.For more details on how each measure of basic needs insecurity was constructed, see web appendices.17FOR COLLEGE,C O M M U N I T Y,AND JUSTICE
SECTION 3:Employment and Academic PerformanceStudents who experience basic needs insecurity are overwhelmingly active participants in thelabor force. The majority (80%) of students who experience food insecurity, housing insecurity,and homelessness are employed (Figure 7). Among working students, those who experience basicfood or housing insecurity often work more hours than other students.100FIGURE 7. Employment Behavior by Basic Need Insecurity Status AmongMinnesota Survey 0Cumulative Percentage (%)1918172322Not working,looking for workWorking 1 to20 hoursWorking 21 to30 hoursWorking morethan 30 hours2017Not working, notlooking for NoYesHomelessSource: 2019 #RealCollege SurveyNotes: Cumulative percentages may not add up to 100 percent due to rounding. Survey questions about work statusand number of hours worked were administered to a subset of randomly selected respondents. For more details onhow each measure of basic needs insecurity was constructed, refer to the web appendices.18FOR COLLEGE,C O M M U N I T Y,AND JUSTICE
100FIGURE 8. Self-Reported Grades by Basic Need Insecurity Status AmongMinnesota Survey Respondents415141486052AB40Cumulative Percentage (%)8038C474638D or nsecure141011NoYesHomelessSource: 2019 #RealCollege SurveyNotes: Cumulative percentages may not add up to 100 percent due to rounding. For more details on how eachmeasure of basic needs insecurity was constructed, refer to the web appendices.19FOR COLLEGE,C O M M U N I T Y,AND JUSTICE
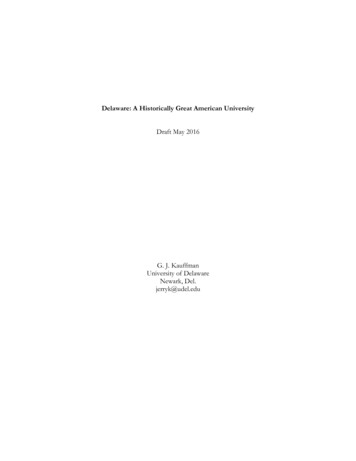
SECTION 4:Utilization of SupportsWhile supports for students exist on the federal, state, and college levels, results continue toshow that many students who experience basic needs insecurity do not access them (Figure 9).8Medicaid or public health insurance, SNAP, and tax refunds are the benefits used most oftenby students surveyed in Minnesota, though they remain quite low given the needs of studentsresponding. For example, 19% of food insecure students across two-year institutions receiveSNAP benefits, while only 9% of four-year students do. Likewise, only 9% of students attendingtwo-year institutions and 5% of four-year students who experience housing insecurity receivehousing assistance. Thirty percent of students attending two-year institutions who experiencehomelessness utilized Medicaid or public health insurance, while only 20% of four-year studentsdid. It is worth noting that across two and four-year institutions, students who are secure in theirbasic needs are still accessing public benefits, albeit at lower rates (30% and 25%, respectively)than students who are insecure.FIGURE 9. Use of Public Assistance According to Basic Needs Security AmongMinnesota Survey RespondentsTwo YearFour YearAny assistanceMedicaid or publichealth insuranceTax refunds(including EITC)SNAP (foodstamps)WIC (nutritionalassistance for childrenand pregnant women)Utility assistance (e.g.,help paying forheat or water)Housing assistance020406080100 020406080100Percentage Utilizing Assistance (%)Food InsecureHousing InsecureHomelessSecureSource: 2019 #RealCollege SurveyNotes: Not all types of public assistance are included in the figure above. See web appe
Community College Survey of Student Engagement (survey questions now in the pilot stage), the ACHA-National College Health Assessment, and the CIRP Freshman Survey. . Inver Hills Community College (2018) Itasca Community College (2019) Mesabi Range College (2019) Minneapolis Community and Technical