Transcription
NOVEMBER 20182018 FINANCIAL COMPENSATION SURVEY F I N D I N G S A N D R E S U LT S
2018 FINANCIAL COMPENSATION REPORTLETTER FROM SOCIETY LEADERSHIPDear Colleagues,As the premier professional organization for investment professionals in the Bay Area, CFA Society SanFrancisco is dedicated to delivering reliable and trustworthy information, thought leadership initiatives, andresources for career support and development to our members and stakeholders.Thus, we are pleased to announce the highly anticipated findings of the 2018 Financial Compensation Survey.The survey provides a unique, region-specific analysis of compensation levels for investment and financialprofessionals. The accompanying whitepaper captures the findings of the survey, providing an overview of thesurvey-wide results.We thank those of you who participated in the survey and contributed to this important market resource.We are confident the information contained in this document will be of value to you.Best Regards,Anne O’BrienExecutive Director, CFA Society San Francisco1
2018 FINANCIAL COMPENSATION REPORTEXECUTIVE SUMMARYExecutive summaryAccess to accurate and data-driven information plays a significant role in the ability of financial and investmentprofessionals to effectively perform in their careers. The same is true to successfully advance one’s career.The 2018 CFA Societies Financial Compensation Survey seeks to provide access to this vital information.This report is a compilation of the results from a survey on compensation practices in the San Francisco areaconducted earlier this year; 1,084 professionals completed the survey.Remaining true to the stated commitment to provide an accurate snapshot of the compensationlevels for the entire financial and investment industry, the survey findings are presented todemonstrate compensation based on the most popular positions and other demographics.The survey requested self-reported data on numerous aspects of compensation. In addition to covering basesalary and total compensation, the survey addressed the respondent’s CFA Charterholder status, level ofeducation, and occupation. Information on the type and size of the firm as well as the amount of assets undermanagement were included in the survey. The survey captured expected annual salary change data, plus therespondent’s view on the adequacy of compensation and the desire to explore other job opportunities.The 2018 Financial Compensation Survey data and exhibits are intended to provide general guidance forcomparing compensation levels with overall values for key categories. Note that actual compensation potentialmay vary relative to the numbers generated by the survey given the use of relatively broad category definitions.Also, the estimation of compensation based on any single factor may not predict reasonably accurate estimates.Details surrounding actual job responsibilities and the confluence of multiple factors may result in higher or lowercompensation levels.90%of respondents holding the CFA Charter report that the designationhas helped their career.2
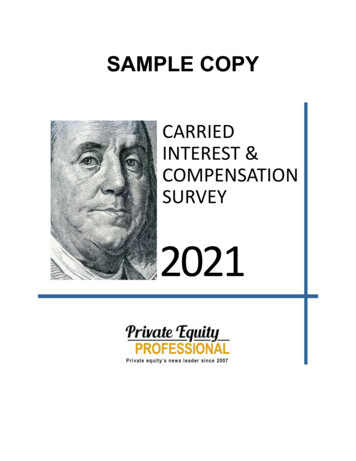
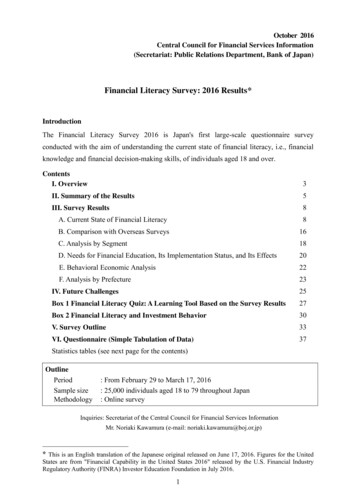
2018 FINANCIAL COMPENSATION REPORTRESPONDENT PROFILESYears of experienceEducation4.9%15.1%26.1%37.0%17.0% 2 years2 – 5 years5 –10 years10 – 20 years20 yearsBachelor degreeGraduate degreeDoctorateFeel valued by their company69.5% Yes27.0% NoCharterholder status3.6% N/A62.1% YesMedian total compensation*Bachelor degreeGraduate degree0.3%52.1%45.1%2.2%Associate degree19.1% Candidate18.8% NoFeel fairly compensated 137,750 224,125 180,000 273,00052.9%Yes47.1%NoNon-CharterholderCFA Charterholder* Median total compensation figures listed do not control for othervariables such as years of experience and job title.Our data show that professionalswho attain the CFA designationand/or a graduate degree tend tohave higher compensation levels.3
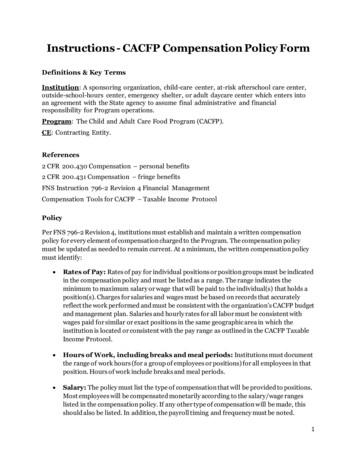
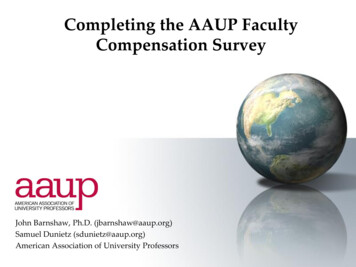
2018 FINANCIAL COMPENSATION REPORTRESPONDENT PROFILESEmployer size26.4%16.5%7.7%10.4%6.5%32.4% 5050 to 250250 to 500500 to 2,5002,500 to 5,000 5,000AUM of firm9.2%9.5%25.3%34.8%21.1% 500 million 500 million to 2 billion 2 billion to 50 billion 50 billionNot Applicable4
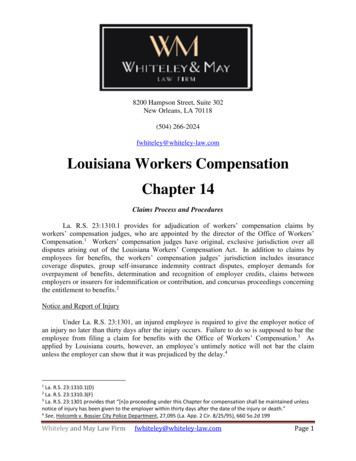
2018 FINANCIAL COMPENSATION REPORTRESPONDENT PROFILESFifteen most common occupationsOther*Financial advisor/brokerFinancial analyst (corporate)Buy-side research analyst (equity)ConsultantInstitutional sales representative/relationship managerPortfolio manager (equities)Bank/trust/private client portfolio managerManager of managers/director of investmentsRisk managerBuy-side research analyst (fixed income)Chief investment officerSell-side research analyst (equity)Accountant/auditorClient 0%2.8%2.6%2.5%2.5%*Respondents reported a wide variety of other occupations such as product management, software engineer, and data analyst/scientist.Organization typeInvestment management firmInvestment bank, commercial bank, brokerage firm, trust companyOtherConsulting, accounting, law firmHedge fund or fund of hedge fundsFamily officeInsurance companyGovernment agency/departmentCorporate plan sponsorEndowment, foundation, other not-for-profitEducational institutionRating 1.1%0.7%
2018 FINANCIAL COMPENSATION REPORTF I N D I N G S A N D R E S U LT SOpportunity for advancementwithin companyLikelihood of looking fora new role in 20183.1%N/A23.0%Not sure26.1%Likely52.6%Yes37.9%Unlikely14.5%Very unlikely21.4%21.3%Very likelyNoReason for looking for a new roleVery likelyLikelyBetter work/life balance3%3%Higher compensation14%22%More challenging work/career advancement19%23%Other2%2%Poor culture/lack of respect7%5%Recently completed degree/obtained certification0%0%The most commonly cited reasonsfor looking for a new role werepursuing more challenging work/career advancement followed byhigher compensation.6
2018 FINANCIAL COMPENSATION REPORTF I N D I N G S A N D R E S U LT STypes of compensation in addition to base salary84%63%21%20%11%7%6%Cash/bonus performanceEmployer 401(k) contributionsRestricted stock awards/phantom sharesProfit sharingDeferred /multi-year earningsStock optionsCommission/ a sales bonusPrimary Determinant of Overall firm performanceBusiness unit/division performanceOther factors related to individual performanceIndividual investment performanceIndividual financial contributionCommissions generatedExpected change in total compensationDecline45.0%Increased 0–10%3.7%Stay the same17.2%Increased 10–20%22.0%Increased 20%12.2%Discretionary and overall firmperformance were the top twodeterminants of bonus.7
2018 FINANCIAL COMPENSATION REPORTF I N D I N G S A N D R E S U LT SHow respondents wish their compensation was structuredOccupationOther64.4% / 23.8% / 9.9% / 1.8%Financial analyst (corporate)74.9% / 17.1% / 6.9% / 1.2%Financial advisor/broker53.7% / 26.9% / 7.6% / 11.9%Buy-side research analyst (equity)53.6% / 36.5% / 9.2% / 0.7%Consultant65.4% / 23.4% / 8.3% / 3.0%Institutional sales representative/relationship manager47.2% / 40.9% / 9.7% / 2.2%Portfolio manager (equities)51.6% / 31.2% / 15.8% / 1.3%Bank/trust/private client portfolio manager69.2% / 23.6% / 5.7% / 1.6%Manager of managers/director of investments60.7% / 26.8% / 11.2% / 1.3%Risk manager66.9% / 23.4% / 7.0% / 2.6%Buy-side research analyst (fixed income)55.6% / 35.6% / 7.6% / 1.2%Chief investment officer56.6% / 25.8% / 10.6% / 7.1%Chief financial officer62.3% / 22.0% / 13.9% / 1.8%Sell-side research analyst (equity)60.8% / 33.1% / 4.3% / 1.8%Accountant/auditor79.1% / 17.1% / 3.3% / 0.4%Client services70.5% / 19.9% / 6.9% / 2.8%Manager research (equity)71.5% / 23.8% / 4.3% / 0.4%Portfolio manager (fixed income)59.9% / 31.6% / 8.3% / 0.2%Operations/reconciliation77.8% / 18.1% / 2.6% / 1.5%Buy-side research analyst (quantitative)51.7% / 36.9% / 5.1% / 6.3%Buy-side research analyst (alts/other)61.1% / 32.7% / 4.5% / 1.7%Manager research (alternatives)66.4% / 23.5% / 9.1% / 1.1%Investment banker57.5% / 36.9% / 5.0% / 0.6%Portfolio manager (indexed/alts/other)62.0% / 27.5% / 9.9% / 0.6%Wholesale/intermediary sales representative45.7% / 39.7% / 7.3% / 7.3%Performance analyst72.6% / 18.3% / 9.0% / 0.0%Strategist/economist63.9% / 25.9% / 9.1% / 1.2%Marketing manager69.2% / 22.5% / 7.3% / 1.1%Private client professional (other)64.6% / 22.1% / 5.4% / 7.9%Credit analyst (rating)77.3% / 20.3% / 2.0% / 0.5%Portfolio manager (quantitative)39.2% / 49.8% / 8.7% / 2.3%BaseNote: Figures represent average of response to ideal compensation.8Cash bonusLong termOther
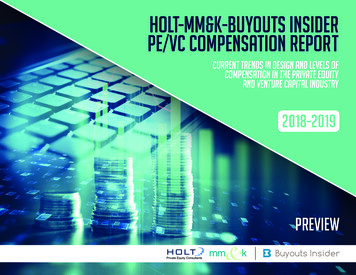
2018 FINANCIAL COMPENSATION REPORTF I N A N C I A L C O M P E N S AT I O NMedian and 75th percentile total compensation by occupationPositionTotalCompNBaseOther192,5009675th percentile314,875Financial advisor/broker214,00075th percentile301,750Financial analyst (corporate)140,00075th percentile171,900Buy-side research analyst (equity)224,00075th percentile355,396Consultant197,00075th percentile287,000Institutional sales representative/relationship manager349,00075th percentile657,500Portfolio manager (equities)310,00075th percentile734,500Bank/trust/private client portfolio manager203,75075th percentile289,500Manager of managers/director of investments267,50075th percentile360,000Risk manager198,00075th percentile284,870Buy-side research analyst (fixed income)233,80075th percentile353,500Chief investment officer*383,49075th percentile540,000Sell-side research analyst (equity)211,62575th percentile281,776Accountant/auditor145,00075th 50,00020,000126,93611,1006,350153,50027,00014,000* For certain positions, the Total Comp figure can appear skewed when multiple respondents have no Base, no Bonus and/or no OtherComp to report.continued»9
2018 FINANCIAL COMPENSATION REPORTF I N A N C I A L C O M P E N S AT I O NMedian and 75th percentile total compensation by occupationPositionTotalCompNBaseBonusChief financial officer374,00027220,000100,00030,00075th percentile499,251271,500168,000129,500Client services140,000100,00017,00017,00075th percentile188,560132,50041,00026,000Portfolio manager (fixed income)285,000172,00070,00027,00075th percentile400,000210,000129,50063,750Manager research (equity)159,251130,00025,0005,00075th onciliation123,000101,00019,0005,25075th percentile154,055123,00029,00014,250Buy-side research analyst (alts/other)145,500125,00025,00020,00075th percentile313,520150,000150,00040,000Buy-side research analyst (quantitative)255,000160,00080,00027,00075th percentile300,000173,750107,50040,000Manager research (alternatives)223,000150,00042,00012,00075th percentile326,000178,75075,00054,375Portfolio manager (indexed/alts/other)200,000132,50047,50014,25075th percentile280,000161,25087,50035,000Investment banker*174,50075th percentile404,500Performance analyst138,00075th percentile184,300Wholesale/intermediary sales representative361,00075th percentile446,500Private client professional (other)180,00075th percentile266,600Strategist/economist220,00075th 3* For certain positions, the Total Comp figure can appear skewed when multiple respondents have no Base, no Bonus and/or no OtherComp to report.continued»10
2018 FINANCIAL COMPENSATION REPORTF I N A N C I A L C O M P E N S AT I O NMedian and 75th percentile total compensation by it analyst (rating)89,7501275,00019,5005,02075th percentile148,82598,75029,5005,625Marketing manager275,00012175,00037,50016,00075th percentile293,500211,25086,25042,313Buy-side trader (equity)255,000175,00090,00047,50075th percentile434,000232,500100,000170,500Portfolio manager (quantitative)373,000175,000150,00035,50075th percentile639,000200,000381,250104,7501111Note* For certain positions, the Total Comp figure can appear skewed when multiple respondents have no Base, no Bonus and/or no OtherComp to report.Only Reported for positions with more than 10 responses.Base/Bonus/Other Comp/Total Comp figures were calculated independently from each other.Suggestion: The best way to read this chart is to start with the Total Comp column . and then use the Base, Bonus and Other Compcolumns to understand generally how Total Comp is structured.11
2018 FINANCIAL COMPENSATION REPORTF I N A N C I A L C O M P E N S AT I O NReported median compensation for those with less than 5 yearsof experience for selected Financial analyst ,8002495,0002312,0001715,00017Buy-side research analyst (equity)185,70015100,0001550,000158,25010Buy-side research analyst (fixed income)147,5001290,0001240,0001211,3506Financial ultant91,0001182,0001120,00094,50010Credit analyst (rating)89,500975,000910,00075,0206Client te client portfolio manager108,100888,000817,50063,5506Sell-side research analyst econciliation81,500872,5008n/a42,5007Investment banker139,000792,500640,750610,0005Risk manager135,1006102,500614,5006n/a4Buy-side research analyst (quantitative)165,0005120,000540,0005n/a4Buy-side research analyst (alts/other)110,000590,750520,0005n/a3NoteCells in yellow reflect fewer than 5 responses.Base/Bonus/Other Comp/Total Comp figures are median and were calculated independently from each other.Calculation of median statistics only includes those individuals who stated that they are eligible to receive a given formof compensation. Therefore, we would not expect these numbers to add up to the total compensation figure.Suggestion: The best way to read this chart is to start with the Total Comp column . and then use the Base, Bonusand Other Comp columns to understand generally how Total Comp is structured.Median total compensation forthose with less than 5 years ofexperience is 115,125.12
2018 FINANCIAL COMPENSATION REPORTF I N A N C I A L C O M P E N S AT I O NReported median compensation for those with 5 to less than 10 yearsof experience for selected Other185,00027140,0002745,0001918,50024Financial analyst de research analyst l nsultant169,72017142,0001719,000149,72013Portfolio manager e research analyst (equity)212,00010155,0001042,500109,0007Portfolio manager Institutional sales representative/relationship manager178,0009120,000955,000742,5007Buy-side research analyst (fixed income)258,0009125,000992,000915,0008Performance analyst133,0008100,000815,000821,0005Client services140,500893,560823,500610,5006Buy-side research analyst (alts/other)*146,0008127,500890,00069,0006Risk manager153,0007115,000720,000711,2506Manager research t/private client portfolio manager136,5006100,000626,00069,0005Manager research (equity)161,0006121,000637,500610,0005Buy-side research analyst e client professional (other)122,000590,0005n/a4n/a4Chief financial officer240,0005150,0005n/a3n/a4Buy-side trader (fixed income)190,0005100,000575,000511,0005Portfolio manager (fixed income)171,5005135,000525,5005n/a3Note* For certain positions, the Total Comp figure can appear skewed when multiple respondents have no Base, no Bonus and/or no OtherComp to report.Cells in yellow reflect fewer than 5 responses.Base/Bonus/Other Comp/Total Comp figures are median and were calculated independently from each other.Calculation of median statistics only includes those individuals who stated that they are eligible to receive a given form of compensation.Therefore, we would not expect these numbers to add up to the total compensation figure.Suggestion: The best way to read this chart is to start with the Total Comp column . and then use the Base, Bonus and Other Compcolumns to understand generally how Total Comp is structured.Median total compensation for those with 5 to less than 10 years of experienceis 175,000.13
2018 FINANCIAL COMPENSATION REPORTF I N A N C I A L C O M P E N S AT I O NReported median compensation for those with 10 to less than 20 yearsof experience for selected Financial her236,00029162,5002850,0002520,00023Institutional sales representative/relationship manager399,00027175,00025150,0002340,00023Buy-side research analyst l analyst sultant255,00020175,0001841,0001614,500Manager of managers/director of investments268,00018170,0001866,0001718,00013Risk manager263,00017160,0001755,0001530,00017Chief investment officer290,00013212,5001342,5001039,34110Chief financial officer305,00013220,0001375,0001030,00011Portfolio manager olio manager (fixed income)297,00012175,0001290,0001126,00011Manager research uy-side research analyst (fixed /private client portfolio ditor195,0009157,000930,00096,3508Portfolio manager side research analyst ermediary sales olio manager Private client professional t220,0007170,000740,000718,3006Buy-side research analyst (alts/other)*164,0007150,000760,0006n/a4Investment banker*450,0007150,0007294,500675,0005Client services174,5006127,000640,0006n/a4Marketing manager279,8136186,000637,500620,5006Buy-side research analyst er research de trader (equity)538,0005250,0005n/a3n/a4* For certain positions, the Total Comp figure can appear skewed when multiple respondents have no Base, no Bonus and/or no OtherComp to report.See next page for additional notes.Median total compensation for those with 10 to less than 20 years of experienceis 259,000.14
2018 FINANCIAL COMPENSATION REPORTF I N A N C I A L C O M P E N S AT I O NReported median compensation for those with more than 20 yearsof experience for selected Chief investment 41,00016220,00016150,0001538,00012Portfolio manager ncial nk/trust/private client portfolio manager272,00015190,0001546,0001333,50014Manager of managers/director of tutional sales representative/relationship nt*287,0009183,5007160,095644,0006Chief executive officer390,0008327,5006n/a3100,0007Chief financial officer*550,0007325,0007200,0007235,0006Portfolio manager (fixed income)*543,8406226,0006395,000597,5006Note* For certain positions, the Total Comp figure can appear skewed when multiple respondents have no Base, no Bonus and/or noOther Comp to report.Cells in yellow reflect fewer than 5 responses.Base/Bonus/Other Comp/Total Comp figures are median and were calculated independently from each other.Calculation of median statistics only includes those individuals who stated that they are eligible to receive a given form ofcompensation. Therefore, we would not expect these numbers to add up to the total compensation figure.Suggestion: The best way to read this chart is to start with the Total Comp column . and then use the Base, Bonus and OtherComp columns to understand generally how Total Comp is structured.Median total compensation forthose with more than 20 years ofexperience is 350,000.15
2018 FINANCIAL COMPENSATION REPORTF I N A N C I A L C O M P E N S AT I O NCompensation satisfaction vs. likelihood of looking for new %10.4%Very LikelyVery UnlikelyFairly compensatedNot fairly compensatedIndividuals who do not feel they are fairlycompensated report they are more likely tolook for a new job than their counterparts whobelieve they are fairly compensated.16
2018 FINANCIAL COMPENSATION REPORTSURVEY METHODOLOGYSurvey methodologyMethodAn online survey was deployed to known financial professionals in the region represented by CFA SocietySan Francisco. Email subscribers of the Society and LinkedIn group members were specifically targeted. Thesurvey was not limited to just these audiences. In addition, this survey was structured so all data gathered wasanonymous, with no identifiable information requested.RespondentsRespondents were financial and investment professionals and totaled 1,084 unique and completed responses.TimingThe survey was active from May 14 – June 22, 2018.AssumptionsThe findings from this survey were derived from self-reported data. Because the survey uses samplingmethodology and broadly defined positions, survey findings are not necessarily representative of the totalpopulation; rather, the survey is designed to provide general information about pay levels within the industry.Earning any degree or professional designation is no guarantee of employment or compensation.17
2018 FINANCIAL COMPENSATION REPORTA B O U T T H E C FA S O C I E T YAbout the CFA SocietyCFA Society San Francisco is the premier professional organization for investment professionals to connect withChartered Financial Analysts throughout the region. The Society strives to serve its broad membership throughrelevant educational programs, membership support services and opportunities for advancement such asnetworking events, discounts on educational materials, and more.CFA Society San Francisco: Promotes ethical and professional standards within the investment industry, Encourages professional development through the CFA Program and continuing education, Facilitates the exchange of information and opinions among people within the local investmentcommunity and beyond, and; Works to further the public's understanding of the CFA designation and investment industry.If you are interested in learning more about earning your charter, or to learn more about CFA Society SanFrancisco, please visit our website: https://cfa-sf.org or contact us via email: info@cfa-sf.org.18
The 2018 CFA Societies Financial Compensation Survey seeks to provide access to this vital information. This report is a compilation of the results from a survey on compensation practices in the San Francisco area conducted earlier this year; 1,084 professionals completed the survey.