Transcription
State of Delaware2018 Total Compensation StudyPart I – Total Compensation StudyPart II – Review of Compensation andClassification Practice and Genderand Race/Ethnicity EquityCopyright 2018 by The Segal Group, Inc. All rights reserved.8784439v10/05886.006
State of Delaware2018 Comprehensive StudyPart I – Total Compensation StudyRevised Report: November 1, 2018Copyright 2018 by The Segal Group, Inc. All rights reserved.8784439v10/05886.006
Table of Contents2018 Total Compensation StudyExecutive Summary. 1Methodology .6Findings: Pay Ranges.14Findings: Paid Leave .16Findings: Benefits Programs .19Findings: Total Compensation.23Conclusions . 24APPENDIX A - 2018 Total Rewards Survey Document .28APPENDIX B - Paid Time Off, Health & Retirement Benefits .29i
Executive SummaryBackgroundThe State of Delaware engaged Segal Waters (“Segal”) to conduct a comprehensive study ofcompensation, classification, benefits, gender and race/ethnicity equity. The study is divided intotwo parts: The objective of Part I is to study total compensation and review the merit pay plan basedon current methodology and recommend any adjustments warranted to maintaincompetitiveness using the appropriate labor market(s). Total compensation is defined aswages and benefits. The objective of Part II is to review and examine the State’s business practices forcompensation and classification and review statewide gender and race/ethnicity equity.This report contains the results of Part I of the State of Delaware 2018 Total CompensationStudy (“Study”). The Study included research of four (4) elements: Current pay range Paid leave programs Health benefits Retirement programsSegal worked with the State of Delaware’s project team to identify 13 peer employers representative ofthe State’s competitive labor market.Segal segmented the responses into three sectors: Federal and State Governments, Local Governments(Delaware) and published data.Segal distributed the market survey document to the peer employers listed below: City of Dover, DECity of Wilmington, DECommonwealth of MassachusettsCommonwealth of PennsylvaniaCommonwealth of VirginiaFederal GovernmentKent County, DE New Castle County, DEState of MarylandState of New JerseyState of New YorkState of North CarolinaSussex County, DETwelve (12) of the thirteen (13) peer employers participated in the market survey (shown boldedabove). Of the twelve peer employers, six (6) completed and returned the market survey andSegal completed a market survey on behalf of the other six (6) peers (City of Dover, New CastleCounty, Commonwealth of Virginia, State of New Jersey, State of New York and the Federal1
Government) using information found in salary schedules, job descriptions, collectivebargaining agreements, and other applicable resources. The City of Wilmington (DE) wasinvited to participate but did not provide a response and pay and benefit related information forthe City was not available online.To represent private sector employers for 26 of the benchmark jobs, Segal utilized three (3)published data sources (Economic Research Institute (ERI), Willis Towers Watson, and IBMKenexa). All data is reflective of the market as of July 1, 2018.This report provides the Study findings and conclusions based on analyses of the informationcollected from peer employers.Compensation and BenefitsThe Study involved collecting data from peer employers on 155 benchmark jobs through a FiscalYear 2019 (FY 2019) State of Delaware Total Compensation Survey (“Survey”). The benchmarkjobs are representative of the State’s workforce, when taking into consideration pay grade,incumbent population, occupational groups and job series. The survey document provided toeach employer, found in Appendix A, included job summaries with minimum requirements foreach benchmark job.Paid Time Off, Health and Retirement Benefits data, found in Appendix B, was collected,analyzed and included in the Study’s recommendation.2
Summary of Findings – Total Compensation Market PositionThe Study evaluated the market competitiveness of State of Delaware’s total compensationpackage at the pay range midpoint, the middle of the pay range, and for employer-paid healthbenefits and total employer retirement contributions. The State of Delaware’s totalcompensation package is below market compared to peer employers.Although the State’s market position for health and retirement benefits is at market, the State isbelow market at the pay range midpoint. Pay at the range midpoint comprises approximately65% of total compensation and the health and retirement benefits comprise the other 35%. Thisplaces the State below market overall.Table 1 summarizes the market position of each total compensation element relative to themarket competitive corridor1 for the public sector.TABLE 1MARKET COMPETITIVENESS OF STATE OF DELAWARE’STOTAL COMPENSATION ELEMENTSTotal Compensation ElementsState of DelawareMarket PositionPay Range MidpointBelow MarketHealth Benefits ( basis)At MarketRetirement Benefits (% of pay basis)At MarketTotal CompensationBelow MarketPay RangesThe State’s pay structure contains pay ranges based on the following: the midpoint at 100%, theminimum at 80%, and maximum at 120% of the midpoint. Generally, the minimum is a newhire’s entry wage rate; the midpoint is the rate of pay employees should move towards throughtime in the job; and the maximum is the most that could be earned in the job, barring extenuatingcircumstances. For example, the pay grade 10 for the 37.5 (M37) salary administration planminimum is 31,912, midpoint is 39,890, and maximum is 47,868.Segal evaluated the pay ranges of benchmark jobs individually and in the aggregate. When thesebenchmark jobs are considered in the aggregate, the State of Delaware’s pay ranges are belowthe market competitive corridor at the minimum, midpoint and maximum (see Table 2 below).Figures shown in red are below market (less than 95% of the market average), figures shown inblack are within the market range (95% to 105% of the market average) and figures shown inblue are above market (more than 105% of the market average). While there is some variationon an individual benchmark basis, overall, the pay ranges are 86% of the market average.1Segal defines the market competitive corridor as /- 5% of the market average. Market positions that are within themarket competitive corridor are categorized as being “at market”. Market positions below the market competitivecorridor are “below market”. Market positions above the market competitive corridor are categorized as “abovemarket”.3
TABLE 2STATE OF DELAWARE MARKET POSITION BY SECTOR – PAY RANGE ONLY(ACROSS ALL BENCHMARK JOBS)State of Delaware as a %of the Market AveragePay RangeMinimumPay RangeMidpointPay RangeMaximumFederal & State Governments85%86%85%Local Government83%84%85%Published Data*84%88%89%State of Delaware – Overall MarketPosition**86%86%86%*Note: Published Data Market Position is based on data collected for 26 benchmark jobs.Benchmarks with insufficient market data (less than 5 market matches) are not included in the overall calculations.**State of Delaware – Overall Market Position is the straight average of the data points for all benchmark jobs.Paid LeaveThe Study evaluated the following paid leave programs: annual, sick, holidays, personal orfloating days, jury duty and paid parental/family leave.Health BenefitsThe Study evaluated the most populous health plan. The most populous health plan is defined asthe plan with the majority of employee participation. References to the health plan includesmedical, prescription, dental and vision plans combined. The percentage paid by the Statetowards the total premium is more generous than the peer employers and the annual employercontribution is equal to the market.Retirement BenefitsThe study evaluated the State’s total retirement contributions compared to peer employers.The total annual retirement contribution is the sum of employer contribution towards definedbenefit (normal cost), defined contribution, deferred compensation plans and Social Security.Due to the time constraints of the study, actuarial values that reflect plan design differences,(e.g., definition of normal retirement, maximum years of service, benefit multiplier) were notutilized for this analysis. Instead normal costs were used, which reflect the cost of funding anemployee’s pension benefit at Normal Retirement based on a set of actuarial assumptions thataddresses plan design, investment rate of return, assumed growth in pay over time, workforceturnover, etc. Normal cost is the most comparable measure of cost across peer employers as it is4
not affected by amortization of unfunded liabilities attributable to variances between actualfunding, plan performance and actuarial assumptions. The reasons for these differences can varyacross plans resulting in an inconsistent basis for cost comparisons. These differences also varyover time. Normal cost does not take into account the employer’s contributions to amortize anyunfunded liabilities.The State of Delaware’s total employer retirement contributions are less generous than themarket average; however, the contribution rate in the defined benefit plan is higher.Total CompensationWhen all elements of total compensation1 are included in the comparison, the State ofDelaware’s market position is 86% of the market average, as shown in Table 3. Thismeans the State of Delaware is 16% below the market average.TABLE 3STATE OF DELAWARE’S OVERALL MARKET POSITION*TOTAL COMPENSATIONState of Delaware Total Compensationas a % of the Market AverageState of Delaware – Overall MarketPosition**Pay RangeMinimumPay RangeMidpointPay RangeMaximum86%86%85%*Note: Published Data collected for 26 benchmark jobs does not include benefit costs.Benchmarks with insufficient market data (less than 5 market matches) are not included in the overall calculations.**State of Delaware – Overall Market Position is the straight average of the data points for all benchmark jobs.Adjustment to Reach MarketThe percent of market for both Total Compensation and Pay Range Midpoint are the same. Thebenefit and retirement components are competitive with the market. In order for the State to bemarket competitive any adjustments should focus on pay range midpoint.1 Total compensation market positions are based on three (3) elements:(a) Overall market average pay range midpoint (average of all data points across all sectors)(b) Annual public sector employer health benefits contribution (Most Populous Plan)(c) Annual public sector employer retirement contributions.5
MethodologyData Sources - Peer EmployersSegal worked with the State of Delaware’s project team to identify 13 peer employersrepresentative of the State’s competitive labor market, as shown in Table 4.Segal segmented the responses into three sectors: Federal and State Governments, LocalGovernments (Delaware) and published data. The market position for all benchmark jobs wascalculated based on all market data covering Federal, State and Local (Delaware) Governments.For 26 jobs where analogous jobs can be found in the private sector, Segal included publishedmarket data.TABLE 4LIST OF PEER EMPLOYERSSegal distributed the market survey document to the peer employers listed below:PEER EMPLOYERS City of Dover, DE New Castle County, DE City of Wilmington, DE (not provided) State of Maryland Commonwealth of Massachusetts State of New Jersey Commonwealth of Pennsylvania State of New York Commonwealth of Virginia State of North Carolina Federal Government Sussex County, DE Kent County, DETwelve (12) of the thirteen (13) peer employers participated in the market survey (shown boldedabove). Of the twelve peer employers, six (6) completed and returned the market survey andSegal completed a market survey on behalf of the other six (6) peers (City of Dover, New CastleCounty, Commonwealth of Virginia, State of New Jersey, State of New York and the FederalGovernment) using information found in salary schedules, job descriptions, collective bargainingagreements, and other applicable resources. The City of Wilmington (DE) was invited toparticipate but did not provide a response and pay and benefit related information for the Citywas not available online.6
Published Data SourcesEconomic Research Institute (ERI), Salary Assessor 2018The ERI Salary Assessor compiles pay data from hundreds of published data sources forthousands of jobs. ERI updates the database quarterly and provides salary information for nearlyany geographic area in the U.S. The data was collected based on the National average andadjusted to the date for the State of Delaware. The information in this report reflects July 1,2018 compensation data at the 10th, 50th, and 90th percentiles.IBM KenexaIBM Kenexa compiles survey information on positions in the private sector that coincide withthe benchmark jobs of the study. The data was collected based on the National average andadjusted to the State of Delaware. The information in this report reflects July 1, 2018compensation data.Willis Towers WatsonThe Willis Towers Watson survey compiles pay data from for-profit organization for healthcare,clinical and professional positions. The data was collected based on the National average andadjusted to the State of Delaware. The information in this report reflects February 1, 2017compensation data, aged to July 1, 2018 resulting in a 104.3% adjustment.Data AdjustmentsGeographic AdjustmentsTo compare market data on a consistent basis, Segal adjusted the survey responses and publisheddata to reflect the geographic differences in salaries between each surveyed employer’s locationand the State of Delaware. The reported salaries were adjusted using the geographic wage andsalary differentials reported by the Economic Research Institute (ERI) Geographic Assessor as ofJuly 2018. Table 5 shows the geographic adjustments applied to each data source. A geographicadjustment of less than 100% indicates that the cost-of-labor is higher than the State of Delaware(DE) while an adjustment greater than 100% indicates that the cost-of labor is lower.It is important to note that the wage and salary differentials (cost of labor) do not necessarilyreflect cost-of-living differences. ERI has found that cost-of-living differences (which reflect thesupply and demand for goods and services) are not reliable predictors of salary levels. In otherwords, while the cost of housing (or other goods and services) for the State of Delaware maydiffer from the cost of housing in another city by a certain percentage, the prevailing salariesmay not differ by the same percentage. ERI emphasizes that - for adjusting salaries in a marketstudy such as this one - the wage and salary differentials provide a more accurate method ofdetermining whether employers are paying a competitive wage appropriate to a given geographicarea.7
TABLE 5GEOGRAPHIC COST-OF-LABOR ADJUSTMENTSPeer EmployersState of Delaware102.1City of Dover, DE97.3104.9%109.693.2%99.5102.6%100.7101.4%Federal Government1NA100.0%Kent County, DE97.3104.9%New Castle County, DE105.996.4%State of Maryland107.095.4%State of New Jersey112.890.5%State of New York109.793.1%State of North Carolina91.8111.2%Sussex County, DE96.6105.7%ERI*100.0102.1%IBM Kenexa*100.0102.1%Willis Towers Watson*100.0102.1%Commonwealth of MassachusettsCommonwealth of PennsylvaniaCommonwealth of Virginia1ERI Factor% Adjustment Applied toReflect State of DelawareCost-of-LaborNALocality Pay Area of Philadelphia-Reading-Camden, PA-NJ-DE-MD8
Workweek AdjustmentsTable 6 shows the workweek definition for the peer employers. Segal applied workweekadjustments to jobs when the peer’s benchmark has a workweek definition that differs fromthe State’s.TABLE 6WORKWEEK DEFINITION OF PEER EMPLOYERSPeer EmployersWorkweekDefinition(hours/week)City of Dover, DE40Kent County, DE40New Castle County, DE40Sussex County, DEState of MarylandState of New JerseyVaries40VariesState of New York40State of North Carolina40Commonwealth of PennsylvaniaCommonwealth of VirginiaCommonwealth of MassachusettsFederal GovernmentState of Delaware37.54037.54037.59
Benchmark JobsThe State of Delaware has approximately 1,000 job classifications. Of these, one hundred andfifty-five (155) benchmark jobs, shown in Table 7, were selected as representative of the State’sworkforce. The benchmarks jobs were selected considering incumbent population,representation of occupational groups, job series and pay grade. The benchmark jobs are listed inalphabetical order in the respective pay plans below. Segal collected published market data forthe twenty-six (26) benchmark jobs (shown bolded below) that are common in the privatesector.Of the 155 benchmark jobs, 117 have sufficient market data to support the findings. Based onindustry standards that align with federal antitrust/safe harbor guidelines, benchmark jobs thatreceive less than five (5) total responses are considered to have insufficient data.TABLE 7LIST OF BENCHMARK JOBSM37 Pay PlanAccounting SpecialistEnvironmental Program Manager IIAdministrative LibrarianEnvironmental Scientist IIIAdministrative OfficerEpidemiologist IIAdministrative Specialist IIERP Systems SpecialistAgricultural Commodity Inspector IIFamily Crisis TherapistAnalytical Chemist IIIFamily Crisis Therapist SupervisorApplication Support Project LeaderFamily Service SpecialistBank Examiner IIFamily Services Program Support AdministratorCash and Debt ManagerFiscal Administrative OfficerChief of AdministrationFiscal Management AnalystChild Support Specialist IIIFood Service WorkerCommunity Relations OfficerGraphics & Printing Technician IIIConservation Technician IIIHospital Administrator II10
TABLE 7 (continued)LIST OF BENCHMARK JOBSM37 Pay PlanConstruction Project ManagerHRIS ManagerControllerHRIS Specialist IIICookHuman Resources Manager ICorporations SpecialistHuman Resources Specialist IIICourt Security Officer IIHVAC/Refrigeration TechnicianCustodial Supervisor IIndustrial HygienistCustodial WorkerInformation Resources Specialist IIDatabase Administrator IIInformation Systems Support SpecialistDirector Application TechnologyInsurance Financial Analyst IIDisability Determination Adjudicator IIIntelligent Transportation Systems Technician IVEmployment Services Specialist IIIInvestigator IIEngineering Technician III (Construction)Judicial Case Manager IIEnvironmental Health Specialist IIJudicial Case Processor IIJudicial Case Processor SupervisorSenior Application Support SpecialistLabor Law Enforcement Officer IISenior Family Service SpecialistLabor Relations & Employment Practices SpecialistSenior Fiscal & Policy AnalystLaboratory Manager IISenior ForesterLaundry WorkerSenior Human Resources TechnicianManagement Analyst IIISenior Systems Software SpecialistManager of Application SupportSenior/Social Work Case ManagerManager of Computer & Application SupportSocial Service AdministratorManager Strategic Information Systems ProjectsSocial Service Specialist III11
TABLE 7 (continued)LIST OF BENCHMARK JOBSM37 Pay PlanMarketing Specialist IISocial Service TechnicianMaster Family Service SpecSocial Worker/Case ManagerMediation/Arbitration OfficerSocial Worker/Case Manager SupervisorMicrobiologist IIState Accountant IVMotor Vehicle Specialist IISupply Storage & Dispatch Clerk IIIMotor Vehicle Technician IISupport Services AdministratorOffice ManagerTax Auditor IIOmbudsman Adult Long Term Care FacilityTelecom/Network Technician IIIOperations Support SpecialistTelecom/Network Technologist IIParalegal IITrainer/Educator IIIPark SuperintendentTraining/Education Administrator IPhysical Plant Maintenance SupervisorVeterinarian Medical OfficerPhysical Plant Maintenance/Trades Mechanic IIIVocational Rehabilitation Senior CounselorPlanner IVYouth Rehabilitation Counselor IIPsychiatric Social Worker IIYouth Rehabilitation Counselor SupervisorPsychologistYouth Rehabilitation Treatment SpecialistPublic Health Treatment Program AdministratorYouth Rehabilitation Treatment SupervisorPurchasing Services Coordinator IM40 Pay PlanQuality Assurance AdministratorGaming Inspector IIRegulatory SpecialistProbation & Parole SupervisorRight of Way Agent IIIToll CollectorSecurity OfficerS40 Pay PlanSenior AccountantDeputy Warden I12
TABLE 7 (continued)LIST OF BENCHMARK JOBSSMV Pay PlanU02A Pay PlanAnalytical Chemist III (Forensics)Dental AssistantAssistant Director Transportation EngineerLaboratory Technician IIIAssistant Medical ExaminerU02C Pay PlanAssistant Nursing DirectorLicensed Practical Nurse IIIDentistU06A Pay PlanEngineer IIINutritionist IIEngineer Program Manager ITherapist IIIEquipment Mechanic IVU06C Pay PlanEquipment Operator IIIAdvanced Practice Registered NurseHydrologist IVCompliance NurseLaboratory Manager II (Forensics)Registered Nurse IIIMaintenance Area Supervisor IU09A Pay PlanMaster ElectricianConstable IIMaster MechanicDeputy Fire Marshall IIINursing SupervisorU09B Pay PlanPhysicianAlcohol & Tobacco Enforcement Agent IIIPsychiatrist IIICapitol Police Officer IIISenior Forensic DNA AnalystNatural Resources & Environmental ControlEnforcement Officer IIIState Auditor IIISenior Probation & Parole OfficerU02A Pay PlanU10D Pay PlanActive Treatment FacilitatorCorrectional OfficerActivity Aide IU11A Pay PlanActivity Therapist ICorrectional Counselor SupervisorAttendant ChauffeurU11E Pay PlanCertified Nursing AssistantCorrectional Counselor13
Findings: Pay RangesThe findings for market competitiveness of Pay Ranges are reported in two groups: M37 Pay Plan - includes the M37 Pay Plan and other related non-union pay plans; Collective Bargained Wages Groups - includes merit positions in compensation unionsalary plans. The salary administration plans include compensation bargaining units U02,U06, U09, U10, and U11.The M37 Pay Plan was compared to the market at the midpoint, as the State’s Merit Pay Plansfocus on the Pay Range Midpoint. The Collective Bargained Wages Groups focus on the PayRange Minimum, as this is the point affected when negotiating increases.The research reflects that the State of Delaware’s pay ranges are generally below market acrossbenchmark jobs considering both public and private sector data as shown in Table 8.TABLE 8STATE OF DELAWARE MARKET POSITION – PAY ONLYFor All Benchmark JobsState of DelawareSalary Administration Plans State of Delaware as a % of the MarketAverageAt Pay Range Midpoint86%M37*State of Delaware CollectiveBargained Wage GroupsAt Pay Range Minimum* U0290%* U0692%* U0977%* U10111% U1195%Figures shown in red are below market (less than 95% of the market average)Figures shown in black are within the market range (95% to 105% of the market average)Figures shown in blue are above market (more than 105% of the market average)*M37 Pay Plan Includes the following Salary Admin Plans: M37, M40, S40, SMV, and JS*Data on positions for this unit was provided at Pay Grade Minimum, however, many of these positions had special approvals to pay at higherthan Pay Range Minimum automatically which skewed the evaluation. The effect is that minimum rates are closer to market than calculation.14
The adjustment needed to reach market average is shown below in Table 9. The calculation isbased on dividing 100 by each percentage in Table 8 (on the previous page) and subtracting 1.TABLE 9STATE OF DELAWARE ADJUSTMENT TO REACH MARKET AVERAGEPAY ONLYFor All Benchmark JobsState of DelawareSalary Administration Plans State of Delaware as Adjustment to ReachMarket AverageAt Pay Range Midpoint16%M37State of DelawareCollective Bargained Wage GroupsAt Pay Range Minimum U0211%* U069%* U0929%* U10-10% U116%Figures shown in red are below market (less than 95% of the market average)Figures shown in black are within the market range (95% to 105% of the market average)Figures shown in blue are above market (more than 105% of the market average)*Data on positions for this unit was provided at Pay Grade Minimum, however, many of these positions had special approvals to pay at higherthan Pay Range Minimum automatically which skewed the evaluation. The effect is that minimum rates are closer to market than calculation.15
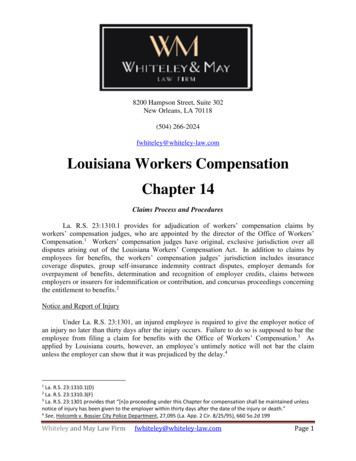
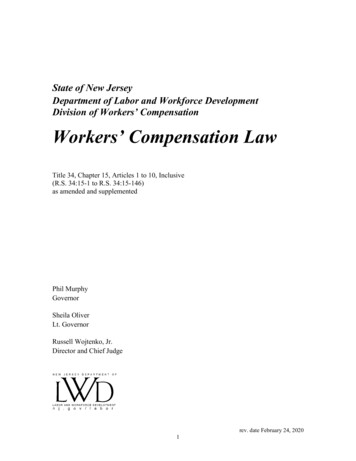
Findings: Paid LeavePaid Leave ProgramsThe following information on employee paid leave programs was collected and compared: Annual Leave (Vacation) Sick Leave Holidays Personal or Floating Days Jury Duty Paid Parental/Family LeaveSee Appendix B, Tables 5a – 5h for the detailed survey responses.Annual Leave (Vacation)The State of Delaware’s annual leave (vacation) program compared to peer employers is moregenerous for the first four years of employment, but after 5 years of employment, the State ofDelaware begins to lag behind. At 15 years, the State accrual rate stagnates compared to peeremployers who continue to increase the benefit reaching a variance of 32 hours per year foremployees with a 25-year career. Chart 1, below, compares State of Delaware’s annual vacationpaid leave hours by specific years of service compared to the market average.CHART 1: ANNUAL VACATION LEAVE HOURS ACCRUED PER YEARAnnual Vacation Hours* by Years of ServiceAccrued Hours Per Years of Service250200180159 163150159135 137114 116114100159915010152025Completed Years of ServiceState of DelawareMarket Average*Peer vacation accruals were adjusted to reflect the State’s 37.5-hour workweek.16
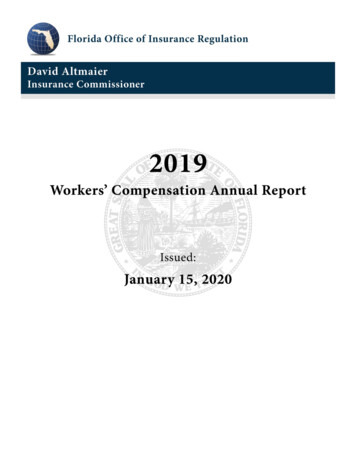
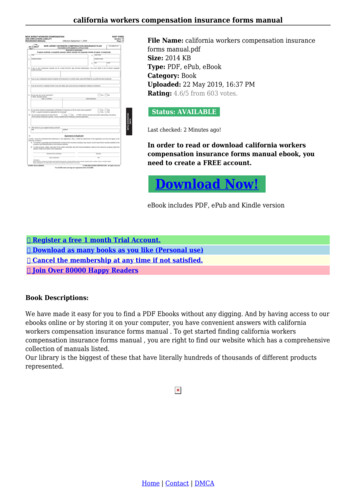
Sick LeaveThe State of Delaware’s sick leave accrual of 114 hours per year is more generous compared tothe average of 99 hours per year offered by peer employers. Chart 2 compares State ofDelaware’s annual sick leave hours to the market average.CHART 2: ANNUAL SICK LEAVE HOURS ACCRUED PER YEARAnnual Sick Leave Accrual in HoursNumber of Hours Accrued Per Year120115114110105991009590State of DelawareMarket Average*Peer sick accruals were adjusted to reflect the State’s 37.5-hour workweek.17
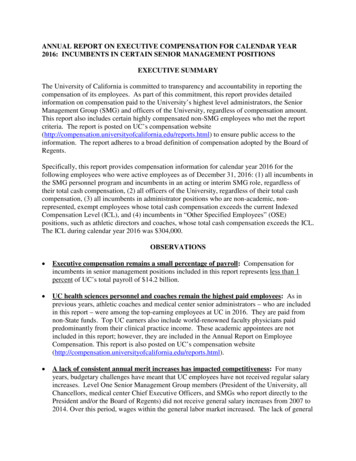
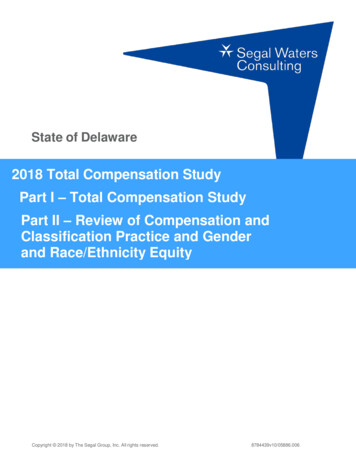
Holiday, Personal Days/Floating HolidaysChart 3 compares the State’s holidays and personal/floating holidays to the market average. TheState is below the market average for holidays and personal/floating holidays.CHART 3: NUMBER OF HOLIDAYS AND PERSONAL DAYS PER YEARHolidays and Personal/Floating Holidays18161614Number of Days12121086420Holidays & Personal/Floating HolidaysState of DelawareMarket Average*State of Delaware provides 10 paid holidays on non-election years and 11 paid holidays on electionyears.Jury DutyThe State of Delaware’s paid leave for jury duty compared to peer employers is the same.Paid Parental/Family LeaveSix (6) out of the 12 peers provide a paid parental/family leave benefit. All the peers offeringpaid/parental family leave offer at least 30 days of paid leave per incident. Although the State ofDelaware does not currently provide this leave, it is important to note that on July 1, 2018, theGovernor of the State of Delaware signed a Paid Parental Leave law which will take effect April1, 2019. This provision provides 12 paid weeks to parents upon the birth or adoption of a childsix years and younger.18
Findings: Benefits ProgramsHealth PlansThe most populous health plans (medical, prescription, dental, and vision plans) were comparedamong peer employers. The majority of the State’s employees are enrolled in a PPO medicalplan. Segal gathered information about health benefits offered to new employees based on four(4) tiers of coverage: Employee only (EE) Employee plus one (EE 1) Employee plus children (EE Children) Employee plus family (EE Family)Specifically, the survey collected employer and employee monthly cost sharing amounts for thefollowing: Medical Plan Prescription Drug Plan Dental Plan Vision PlanThe comparative charts that follow are based on costs associated with the most populous* planenrollment patterns (percent of enrolled employees) for the 4 tiers of coverage at the State ofDelaware. For the Medical, Dental and Vision Plans Combined, the State of Delaware’s costsharing percentages are more generous than the market for all four (4) tiers of coverage.Although the State does not contribute to the cost of dental and vision benefits, compared to themarket average of approximately 76%, the State is more generous, contributing at least 82%towards the total cost of medical, dental and vision. Chart 4 on the following page compares theState’s cost sharing percent to the peer employers.Similar to the State, most of the peer employers include prescription drug coverage under themedical plan. Only 17% of the peer employers share the cost of prescription drug coverage withemployees with the employer contributing, on average, 85% of the monthly premium cost.Appendix B provides detailed responses from each peer employer for health benefits.* For the State of Delaware, the most populous health plan is the Comprehensive Preferred ProviderOrganization (PPO)19
CHART 4: PUBLIC SECTOR EMPLOYER COST-SHARING (%)FOR MEDICAL, DENTAL, & VISION PLANS COMBINED1Employer Cost-Sharing %66%Employee OnlyEE SpouseState of DelawareEE ChildrenFamilyMarket AverageThe res
Total compensation is defined as wages and benefits. The objective of Part II is to review and examine the State's business practices for compensation and classification and review statewide gender and race/ethnicity equity. This report contains the results of Part I of the State of Delaware 2018 Total Compensation Study ("Study").