Transcription
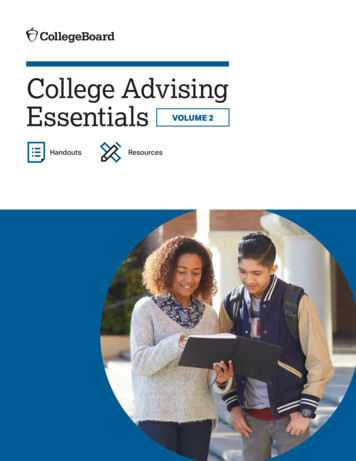
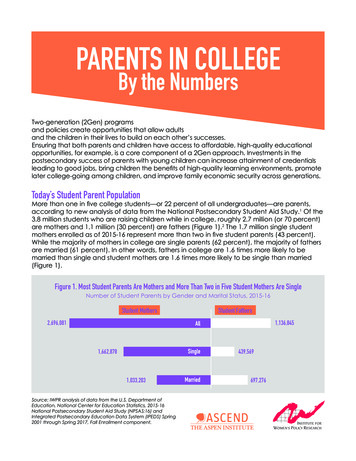
PARENTS IN COLLEGEBy the NumbersTwo-generation (2Gen) programsand policies create opportunities that allow adultsand the children in their lives to build on each other’s successes.Ensuring that both parents and children have access to affordable, high-quality educationalopportunities, for example, is a core component of a 2Gen approach. Investments in thepostsecondary success of parents with young children can increase attainment of credentialsleading to good jobs, bring children the benefits of high-quality learning environments, promotelater college-going among children, and improve family economic security across generations.Today’s Student Parent PopulationMore than one in five college students—or 22 percent of all undergraduates—are parents,according to new analysis of data from the National Postsecondary Student Aid Study.1 Of the3.8 million students who are raising children while in college, roughly 2.7 million (or 70 percent)are mothers and 1.1 million (30 percent) are fathers (Figure 1).2 The 1.7 million single studentmothers enrolled as of 2015-16 represent more than two in five student parents (43 percent).While the majority of mothers in college are single parents (62 percent), the majority of fathersare married (61 percent). In other words, fathers in college are 1.6 times more likely to bemarried than single and student mothers are 1.6 times more likely to be single than married(Figure 1).Figure 1. Most Student Parents Are Mothers and More Than Two in Five Student Mothers Are SingleNumber of Student Parents by Gender and Marital Status, 2015-16Student Mothers2,696,081Student Fathers1,136,845AllSingle1,662,8781,033,203Source: IWPR analysis of data from the U.S. Department ofEducation, National Center for Education Statistics, 2015-16National Postsecondary Student Aid Study (NPSAS:16) andIntegrated Postsecondary Education Data System (IPEDS) Spring2001 through Spring 2017, Fall Enrollment component.Married439,569697,276
”“WE HAVE TO MEET EVERYPARENT, EACH FAMILYWHERE THEY ARE.”- Tameka Henry, Ascend Parent AdvisorBetween the 2011-12 and 2015-16 academic years, the share of students who are parentsdeclined by 15 percent and the total number declined by 20 percent.3 While enrollmentamong all undergraduates decreased in that time (by roughly 6 percent), the number ofcollege students who are parents dropped more sharply than among students overall. Anumber of factors may have contributed to thedeclining share of college students with children,including declining unemployment over this timeCollege Students Who Are Parents period following the end of the Great Recession,and the rising cost of college in combination withRepresent one in five collegethe continued high cost of non-tuition expenses4students.like child care, housing, and transportation. Suchfactors may have disproportionately affectedstudent parents’ ability to afford college as well asAre likely to attend communitytheir assessments of the relative benefits of collegecollege, though they make up aenrollment compared with the immediate benefitsdisproportionate share of forof working without attending school. The closureprofit college students.of more than 100 for-profit colleges between 2012and 2016 probably also contributed to parents’Are more likely to be students ofdecreased share of the student body.5 Thecolor than White.number of student parents enrolled in for-profitsdeclined by 39 percent between 2011-12 andAre older than nonparents.2015-16 (the largest decline among all institutiontypes), compared with a 25 percent decline in thenumber of parents enrolled in community collegesAre likely to have children whoand a 12 percent decline in those enrolled inare preschool-aged or younger.public four-year colleges.6The largest share of student parents is enrolledin community colleges (42 percent of all studentparents are community college students; Figure 2).Similar shares of student parents attend private forprofit and public four-year institutions (18 percentand 17 percent, respectively), with the remainderPARENTS IN COLLEGE ascend.aspeninstitute.org Have nearly twice the studentloan debt of students overall.Have higher GPAs than studentswho are not parents.iwpr.orgPAGE2
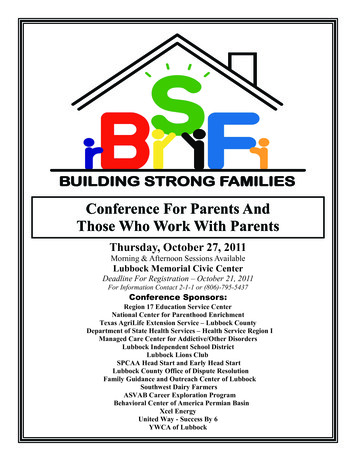
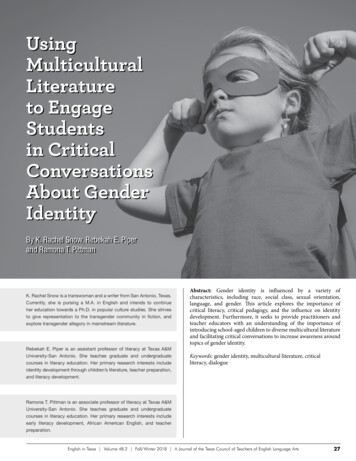
Figure 2. The Largest Share of Student Parents Attends Community CollegesDistribution of AllStudent Parentsby InstitutionType,2015-16Public 4-yearPrivate non-profit 4-yearOther ormore thanonePrivate for-profit17%13%10%18%Public 2-year42%Source: Institute for Women’s Policy Research analysis of data from the U.S. Department of Education, National Center forEducation Statistics, 2015-16 National Postsecondary Student Aid Study (NPSAS:16).enrolled in private nonprofit four-year (13 percent) and other/more than one institution (10percent).While student parents are most likely to attend community colleges, their proportion of theoverall student body varies by institution type. For-profit schools enroll the largest share ofstudent parents compared with other institution types — 45 percent of all for-profit students arestudents with children and 39 percent are single mothers — followed by community colleges,whose student body is more than one-quarter student parents (26 percent; Figure 3).7Figure 3. Nearly Half of the For-Profit Student Body Are ParentsShare of Students Who Are Parents by Institution Type, 2015-16Private for-profit45%Public 2-year26%All institutions22%Other/more than one22%Prviate nonprofit 4-yearPublic 4-year20%12%Source: Institute for Women’s Policy Research analysis of data from the U.S. Department of Education, National Center forEducation Statistics, 2015-16 National Postsecondary Student Aid Study (NPSAS:16).Student parents are more likely than students without children to be students of color: 51percent compared with 46 percent of students without children.8 Looking across racial/ethnicbackgrounds, Black college students are the most likely to be parents (33 percent), andBlack women — two in five of whom are mothers — are more likely than women from otherbackgrounds to be raising children while in college (Figure 4).9 American Indian/Alaska NativePARENTS IN COLLEGE ascend.aspeninstitute.org iwpr.orgPAGE3
and Native Hawaiian/Pacific Islander students are also likely to be parents (29 percent and30 percent, respectively), with more than one-third of women in both groups being mothers(Figure 4). Roughly one in five Hispanic students (21 percent), White students (21 percent), andstudents of more than one race (20 percent) are parents, as are 13 percent of Asian students.10Figure 4. Over a Quarter of All Women and Two in Five Black Women in College Are MothersShare of Students Who Are Parents by Race/Ethnicity and Gender, ricanIndian /AlaskaNative26%26%23%NativeHawaiian /PacificIslanderHispanicShare of men in college who are fathers14%White25%13%11%More thanone race15%AsianShare of women in college who are mothersSource: Institute for Women’s Policy Research analysis of data from the U.S. Department of Education, National Center forEducation Statistics, 2015-16 National Postsecondary Student Aid Study (NPSAS:16).Student parents tend to be older while enrolled in college than their peers without children.Student parents’ median age is 32, compared with 27 for independent students withoutchildren and 20 for dependent students.11 Three in five student parents are 30 or older, roughlyone-quarter are 24-29, and 15 percent are ages 15-23. Native Hawaiian/Pacific Islander”“KEEPING MY HIGH GPA WILL PAYOFF FOR GETTING THE REST OF MYCOLLEGE, FOR THE MOST PART, PAIDFOR. I WANT TO KEEP AS MUCH DEBTOFF AS POSSIBLE.”- Student Parent, IWPR Survey of Women in Mississippi’s Community and Technical CollegePARENTS IN COLLEGE ascend.aspeninstitute.org iwpr.orgPAGE4
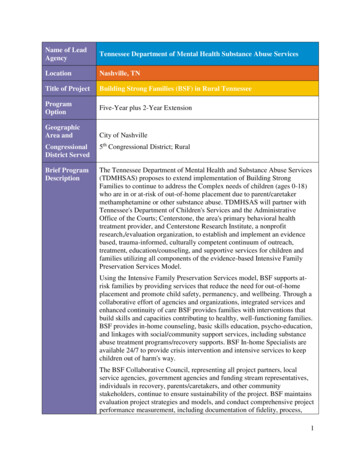
student parents are more likely to be in their 30s or older (nearly three-quarters are in that agegroup) than other student parents, while Hispanic student parents are younger than parents ofother racial/ethnic backgrounds (their median age is 30). Married student parents tend to beolder than their single counterparts, with a median age of 34 and 30, respectively.The large majority of student parents have one or two children (nearly 80 percent) and overhalf have children who are preschool-aged or younger (53 percent have children underage 6; Figure 5). Native Hawaiian/Pacific Islander, Black, and American Indian/Alaska Nativestudent parents are the most likely to have youngest children who are 6 or older (over halfof each group). Asian student parents are most likely to have children ages 0-5 (64 percent),followed by student parents of more than one race (56 percent), Hispanic student parents (56percent), and White student parents (53 percent; Figure 5).Figure 5. The Majority of Student Parents Have Children Under Age 6Share of Students Who Are Parents by Age of their Youngest Child, 2015-1636%47%64%53%AllAsian44%44%56%56%53%More thanone raceHispanicWhite47%Age 0-551%52%54%49%48%46%AmericanIndian /AlaskaNativeBlackNativeHawaiian /PacificIslanderAge 6 and olderSource: Institute for Women’s Policy Research analysis of data from the U.S. Department of Education, National Center forEducation Statistics, 2015-16 National Postsecondary Student Aid Study (NPSAS:16).High College Debt Among Student ParentsStudent parents’ family responsibilities, financial insecurity, and high enrollment in for-profitinstitutions can lead them to borrow more for college than other students.12 Median debtamong student parents enrolled in 2015-16 was more than two-and-a-half times higher thandebt among students without children ( 6,500 compared with 2,500, respectively).13 Mothers,and especially single mothers, borrow more than other student parents and students withoutchildren. Student mothers enrolled in 2015-16 held a median 8,300 in debt, and single motherscarried 9,500 in debt. Median debt among single mothers in college was 2.7 times higherthan median debt among women students without children ( 3,500).Black student parents hold more student debt than parents or nonparents of every otherracial/ethnic background. Black student parents borrow an average of 18,100, comparedPARENTS IN COLLEGE ascend.aspeninstitute.org iwpr.orgPAGE5
with an average of 13,500 among all students, 13,100 among White student parents, and 10,400 among Hispanic student parents (Figure 6).Figure 6. Parents — and Particularly Black Parents — Take on Significant Student Debt to Attend CollegeAverage Amount Borrowed by Student Parents for Undergraduate Education by Race/Ethnicity, 2015-16 18,113 14,857 13,504 13,101 11,951 10,671 10,364 7,273BlackMore thanone raceAllstudentsWhiteAmericanIndian /AlaskaNativeNativeHawaiian /PacificIslanderHispanicAsianSource: Institute for Women’s Policy Research analysis of data from the U.S. Department of Education, National Center forEducation Statistics, 2015-16 National Postsecondary Student Aid Study (NPSAS:16).Student Parents Earn Better Grades than Other Student GroupsStudent parents are often motivated to pursue college by a desire to improve their children’slives.14 While a range of obstacles can impede their ability to graduate on time, studentparents achieve higher grade point averages (GPA) than other students.15 One-third of studentparents have a GPA of 3.5 or higher, compared with 31 percent of independent nonparentsand 26 percent of dependent students (Figure 7).Figure 7. Student Parents Have Higher GPAs than Students Without ChildrenShare of Students by GPA, Dependency, and Parent Status, 2015-16Lower than 2.502.5 - 2.993.0 - 3.493.5 or higherStudent parents23%19%All independent students23%20%25%32%Independent nonparents23%20%26%31%All students24%21%Dependent students25%21%33%25%27%28%29%26%Source: Institute for Women’s Policy Research analysis of data from the U.S. Department of Education, National Center forEducation Statistics, 2015-16 National Postsecondary Student Aid Study (NPSAS:16).PARENTS IN COLLEGE ascend.aspeninstitute.org iwpr.orgPAGE6
Promoting Student Parents’ College SuccessGiven the large share of parents who are students of color, promoting college success amongstudent parents is critical to improving racial/ethnic equity in higher education access andoutcomes. It is also vital to achieving national and state goals to substantially increase thenumber of US adults with postsecondary credentials.16 Ensuring student parents have accessto affordable, quality, child care — which one study found more than tripled their likelihoodof on-time graduation — in addition to supports like coaching, affordable family housing,emergency financial aid, mentoring and peer support, and physical and mental health care,would improve postsecondary success and economic security across generations.17This fact sheet was produced by the Institute for Women’s Policy Research and Ascend at theAspen Institute with generous support from the Omidyar Network and ECMC Foundation. Itwas prepared by Lindsey Reichlin Cruse, Tessa Holtzman, and Barbara Gault from the Institutefor Women’s Policy Research, and David Croom and Portia Polk from Ascend.The Aspen Institute is an educational and policy studies organization based in Washington,DC. Its mission is to foster leadership based on enduring values and to provide a nonpartisanvenue for dealing with critical issues. As a policy program of the Institute, Ascend at the AspenInstitute is the national hub for breakthrough ideas and collaborations that move children andthe adults in their lives to educational success, economic security, and health and well-being.We take a two-generation approach to our work, focusing on children and the adults in theirlives together, and we bring a gender and racial equity lens to our analysis. In everything wedo, we draw on the expertise and experience of families.The Institute for Women’s Policy Research (IWPR) conducts and communicates research toinspire public dialogue, shape policy, and improve the lives and opportunities of womenof diverse backgrounds, circumstances, and experiences. The Institute’s research strives togive voice to the needs of women from diverse ethnic and racial backgrounds across theincome spectrum and to ensure that their perspectives enter the public debate on endingdiscrimination and inequality, improving opportunity, and increasing economic security forwomen and families. The Institute works with policymakers, scholars, and public interest groupsto design, execute, and disseminate research and to build a diverse network of individualsand organizations that conduct and use women-oriented policy research. IWPR’s work issupported by foundation grants, government grants and contracts, donations from individuals,and contributions from organizations and corporations. IWPR is a 501(c)(3) tax-exemptorganization that also works in affiliation with the Program on Gender Analysis in Economics atAmerican University.NotesInstitute for Women’s Policy Research (IWPR). 2018. Institute for Women’s Policy Research (IWPR) analysisof data from the U.S. Department of Education, National Center for Education Statistics, 2015–16 NationalPostsecondary Student Aid Study (NPSAS:16).2Institute for Women’s Policy Research (IWPR). 2018. Institute for Women’s Policy Research (IWPR) analysisof data from the U.S. Department of Education, National Center for Education Statistics, 2015–16 NationalPostsecondary Student Aid Study (NPSAS:16) and Integrated Postsecondary Education Data System (IPEDS)Spring 2001 through Spring 2017, Fall Enrollment component.1PARENTS IN COLLEGE ascend.aspeninstitute.org iwpr.orgPAGE7
Ibid. Institute for Women’s Policy Research (IWPR). 2018. Institute for Women’s Policy Research (IWPR) analysisof data from the U.S. Department of Education, National Center for Education Statistics, 2011–12 NationalPostsecondary Student Aid Study (NPSAS:12).4Bureau of Labor Statistics. 2016. “Unemployment rate nears prerecession level by end of 2015.” Washington,DC: U.S. Department of Labor, Bureau of Labor Statistics. htm (accessed January 23, 2019). Jennifer Ma,Sandy Baum, Matea Pender, and CJ Libassi. 2018. Trends in College Pricing 2018. New York, NY: The CollegeBoard. s/2018-trends-in-college-pricing.pdf (accessedNovember 9, 2018). Child Care Aware of America. 2018. The U.S. and the High Cost of Child Care: A Reviewof Prices and Proposed Solutions for a Broken System. Arlington, VA: Child Care Aware of America. 018.pdf (accessed October 22, 2018). Sara Goldrick-Rab, JedRichardson, Joel Schneider, Anthony Hernandez, and Clare Cady. 2018. Still Hungry and Homeless in College.Philadelphia, PA: Wisconsin HOPE Lab, University of Wisconsin-Madison. ab-Still-Hungry-and-Homeless.pdf (accessed August 16, 2018).5Institute for Women’s Policy Research (IWPR). 2018. Institute for Women’s Policy Research (IWPR) analysisof data from NPSAS:16 and IPEDS Spring 2001 through Spring 2017. U.S. Department of Education, NationalCenter for Education Statistics, “Table 317.50. Degree-Granting Postsecondary Institutions That Have ClosedTheir Doors, by Control and Level.” Washington, DC. 7 317.50.asp (accessed November 21, 2018).6IWPR. 2018. IWPR analysis of data from NPSAS:16 and IPEDS Spring 2001 through Spring 2017.7Ibid.8IWPR. 2018. IWPR analysis of data from NPSAS:16.9Ibid.10Ibid.11Ibid. Independent students have one or more of the following characteristics: at least 24 years old; married;a graduate or professional student; a veteran; a member of the armed forces; an orphan, in foster care, or adependent or ward of the court since age 13; has legal dependents other than a spouse; an emancipatedminor; or homeless or at risk of becoming homeless. Federal Student Aid. n.d. “Glossary.”12Barbara Gault, Lindsey Reichlin, Elizabeth Reynolds, and Meghan Froehner. 2014. “Campus Child CareDeclining Even As Growing Numbers of Parents Attend College.” Fact Sheet, IWPR #C425. Washington, DC:Institute for Women’s Policy Research. ollege/ (accessed November 21, 2018). Lindsey Reichlin Cruse,Eleanor Eckerson, and Barbara Gault. 2018. “Understanding the New College Majority: The Demographicand Financial Characteristics of Independent Students and Their Postsecondary Outcomes.” Washington,DC: Institute for Women’s Policy Research. -newcollege-majority/ (accessed March 26, 2018). IWPR. 2017. “Single Mothers Overrepresented at For-ProfitColleges.” Quick Figure, IWPR #C452. Washington, DC: Institute for Women’s Policy Research. epresented-profit-colleges/ (accessed November 6, 2017). CarenA. Arbeit and Laura Horn. 2017. A Profile of the Enrollment Patterns and Demographic Characteristics ofUndergraduates at For-Profit Institutions. Washington, DC: U.S. Department of Education, National Center forEducation Statistics. https://nces.ed.gov/pubs2017/2017416.pdf (accessed November 21, 2018).13IWPR. 2018. IWPR analysis of data from NPSAS:16.14Cynthia Hess, Sylvia Krohn, Lindsey Reichlin, Stephanie Roman, and Barbara Gault. 2014. Securing a BetterFuture: A Portrait of Female Students in Mississippi’s Community Colleges. Report, IWPR #C417. Washington,DC: Institute for Women’s Policy Research and the Women’s Foundation of Mississippi. es/iwpr-export/publications/C417.pdf (accessed November 21, 2018).15Barbara Gault, Lindsey Reichlin, Elizabeth Reynolds, and Meghan Froehner. 2014. “4.8 Million CollegeStudents Are Raising Children.” Fact Sheet, IWPR #C424. Washington, DC: Institute for Women’s PolicyResearch. college-students-are-raising-children (accessed September 8, 2015).16Emily Parker, Lauren Sisneros, and Emily Pingel. 2016. Free Community College: An Approach to IncreaseAdult Student Success in Postsecondary Education. Denver, CO: Education Commission of the States. ccess-in-postsecondary-education-.pdf (accessed November 21, 2018).17Lindsey Reichlin Cruse, Barbara Gault, Jooyeoun Suh, and Mary Ann DeMario. 2018. “Time Demands ofSingle Mother College Students and the Role of Child Care in Their Postsecondary Success.” Briefing Paper,IWPR #C468. Washington, DC: Institute for Women’s Policy Research. e-time-use/ (accessed August 22, 2018).3PARENTS IN COLLEGE ascend.aspeninstitute.org iwpr.orgPAGE8
children. Student mothers enrolled in 2015-16 held a median 8,300 in debt, and single mothers than median debt among women students without children ( 3,500). Black student parents hold more student debt than parents or nonparents of every other racial/ethnic background. Black student parents borrow an average of 18,100, compared All Asian .