Transcription
Student Loan Debt Vulnerable Borrowers SeriesUnequal Burden:Black Borrowersand the StudentLoan Debt CrisisJuly 2020
Unequal Burden: Black Borrowers and the Student Loan Debt CrisisBill de BlasioMayorLorelei SalasCommissioner July 2020. New York City Department of Consumer Affairs.All rights reserved.
AcknowledgmentsThe Department of Consumer and Worker Protection (DCWP) acknowledges the authors of this report:Ulrike Nischan, Senior Research Analyst, DCWP Office of Financial Empowerment (OFE); Amelia Josephson,formerly Policy Analyst, OFE; Zayne Abdessalam, Director of Policy and Research, OFE; Nicole Perry,Deputy Commissioner, OFE.The Department also acknowledges the following staff members for their contributions: Nichole Davis,Director of Programs, OFE; Steven Ettannani, Executive Director of External Affairs; Reynold Graham,Senior Program Officer, OFE; Debra Halpin, Assistant Commissioner for Creative Services; Abigail Lootens,Associate Commissioner of Communications & Marketing; Kenny Minaya, Chief of Staff; and Lorelei Salas,Commissioner.Black Borrowers 3
PrefaceUnequal Burden was written before the COVID-19pandemic and before the death of George Floydwhich sparked worldwide protests about racialinequities. Originally scheduled to be the final briefin our “vulnerable borrowers” series, its release nowseems both timely and imperative.In New York City, data has shown that Black NewYorkers have suffered disproportionately fromCOVID-19: higher rates of infection; higher rates ofdeath; higher risk of income and job loss relative toother New Yorkers. National data shows the samedisproportionate impact.Also, as the city and the nation are engaged in apowerful discussion about race, we acknowledgethat the roots of the student loan debt crisis forBlack borrowers can be directly connected tohistorical inequities too numerous and complex toaddress fully in this brief.IntroductionIn March 2020, the Department of Consumer andWorker Protection (DCWP) released Ill-Served: WhyNYC Veterans Should Use Extra Caution WhenChoosing a For-Profit School, the first of three briefsin our “vulnerable borrowers” series. Like the first brief,which examined attendance at a for-profit institution,this second brief documents our expanded researchinto another factor associated with student loan default:Being Black.1Indeed, in our research, which dates to 2017 andincludes three reports2, we found that rates ofstudent loan default are higher in predominantlyBlack neighborhoods than in predominantly Whiteneighborhoods.In the sections that follow, we: Provide a visual representation of thedifficulty Black student loan borrowersface, namely loans in collection. Highlight a few factors that makeBlack student borrowers vulnerable tostudent loan debt and how they areinterconnected. Factors include theracial wealth gap, unequal access toquality schooling, and labor marketdiscrimination. Provide DCWP’s conclusions andan overview of municipal efforts tocombat structural racial inequities inNew York City.In diving deeper into the student loan debt strugglesof Black New Yorkers, we seek to raise awarenessof the specific challenges that Black Americans havefaced—and continue to face—not just in pursuingan affordable college degree but in pursuing otheraspects of financial stability, such as a well-paid joband a home that can serve as a nest egg. While acritical topic in its own right, student loan debt canbe a valuable point of entry into broader discussionsabout creating a society and a city that is inclusiveand equitable and based on shared prosperity.1 Throughout this brief we capitalize the “B” in Black and “W” in White to underscore the social and political importance assigned to these distinctionsbeyond the color of a person’s skin. For a more thorough explanation why it is important to capitalize, see ge-why-we-capitalize-black-and-white/2 See Student Loan Borrowing Across NYC Neighborhoods, a collaboration with the Federal Reserve Bank of New York; Student Loan Debt DistressAcross NYC Neighborhoods: Identifying Indicators of Vulnerability; Student Loan Debt Distress Across NYC Neighborhoods: Public Hearing and PolicyProposals.4 Student Loan Debt Vulnerable Borrowers Series
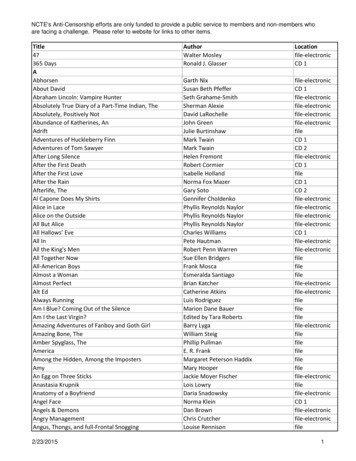
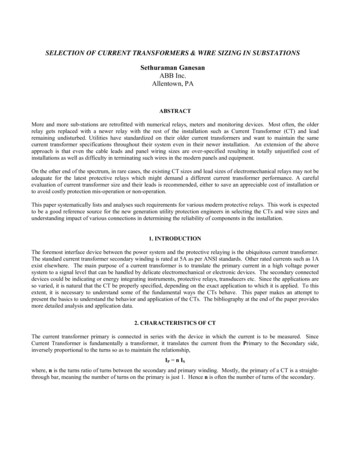
Racial Inequities in Borrowing: Where AreNew Yorkers Struggling the MostIn New York City, the struggle with student loandebt disproportionately impacts neighborhoodswith high rates of Black and Hispanic3 residents,where 70 percent of New York City’s Black residentslive. In these predominantly Black and Hispanicneighborhoods, approximately 16 percent ofstudent loan debt holders have debt in collectionscompared to 8 percent of student loan debt holdersin predominantly White and Asian neighborhoods.4The map in Figure 1 illustrates the impact of studentloan debt distress in segregated neighborhoodsin New York City. With only two exceptions,5 thesesegregated neighborhoods, primarily Black andHispanic, comprise all of the neighborhoods with thehighest rates of student loan debt in collections. Mostof the racially balanced neighborhoods have studentloan debt collection rates that are below the medianor only slightly above the median. All but one of theneighborhoods that are segregated with a high level ofWhite and Asian residents have rates of student loandebt in collections at or below the median.6Figure 1. Segregation and Index of Student Loan Debt Distress (100 Neighborhood Median of 11%) Across NYCNeighborhood Share of Black and Hispanic ResidentsSegregated - Black and HispanicBalancedSegregated - White and AsianNeighborhood Collections Index33 - 67 67 - 100 100 - 134 134 - 168 168 - 202Borough BoundaryNote: Labeled with the Community Districts contained in the geographic boundaries. Index categorized using even breaks.Source: U.S. Census Bureau; American Community Survey (ACS), Table DP05, Five-Year Estimate, 2014-2018, generated by DCWP usingData.Census.Gov on 5/29/2020 and Urban Institute tabulations from a major credit bureau (2018).3 “Latinx” is a gender-neutral word increasingly used with “Hispanic” to acknowledge that not all people of Latin American descent speak Spanish.4 Source: U.S. Census Bureau; American Community Survey (ACS), Table DP05, Five-Year Estimate, 2014-2018, generated by DCWP usingData.Census.Gov on 5/29/2020 and Urban Institute tabulations from a major credit bureau (2018). Predominantly Black and Hispanic neighborhoods havegreater than 70 percent Black and Hispanic residents and White and Asian neighborhoods have fewer than 30 percent Black and Hispanic residents.5 The exceptional neighborhood areas include Brighton Beach and Coney Island and Far Rockaway, Breezy Point, and Broad Channel.6 The exception being Brighton Beach and Coney Island.Black Borrowers 5
The map illustrates the prevalence of residentialsegregation on the one hand and racially codedstudent loan debt outcomes on the other. Thisdisparity of racialized debt in collections is animportant aspect of the wider student loan debt crisisand raises the need for more attention to the waysin which the crisis impacts Americans of differentraces both as a matter of public policy and for theappropriate targeting of resources and remedies.The Racial Wealth Gap7 andIncreased BorrowingTo finance higher education, students have two mainoptions:1. Use family wealth to fund all or part oftheir education.2. Borrow money, including federal orprivate loans.But mobilizing family wealth or borrowing are notalways real choices for many students, particularlyBlack students.Research has shown that Black young adults take onsubstantially more student loan debt than their Whitecounterparts and, furthermore, this gap is partiallyattributable to differences in family wealth and familycontributions to college costs (Addo et al., 2016).This outcome is not surprising, considering that themedian wealth of a Black household in 2016 stoodat only 12 percent of the accumulated wealth of atypical White household, a pattern that has persistedlargely unchanged for the past 70 years (Kuhn,Schularick, & Steins, 2018).In America, the principal path through whichwealth is built, held, and passed on to the nextgeneration is homeownership. Nationwide, thereis a Black-White gap in homeownership and homeequity (Shapiro, Meschede, & Osoro, 2013). In2018, the homeownership gap was approximately30 percentage points, with 73 percent of Whitehouseholds owning their home compared to43 percent of Black households (Veal & Spader, 2019).for student loan debt levels and contribute to afeedback loop in which student loan debt exacerbatesthe racial wealth gap. Specifically, researchersfrom the Institute on Assets and Social Policy atBrandeis University studied a cohort of students whowere in high school in 1997 and went on to attendcollege. When the cohort turned 30, the researchersconducted an analysis of wealth accumulation holdingmany factors constant, including: income; education level; and family income in high school.The researchers made three pertinent findings.1. Student loan borrowers had a networth, independent of student loandebt, that was 8,200 less than theirnon-borrowing peers.2. Holding the impact of borrowing onnet worth constant, Black collegeattendees had a net worth that was 8,500 less than their White peers.3. The median homeowner who heldstudent loan debt had 9,300 less inhome equity than a homeowner whonever held student loan debt (Sullivanet al., 2019).Research has also shown that racial disparities inhome equity and wealth have important implications7 The racial wealth gap—defined in this brief as the gap between the wealth of Black households and White households—has been well documented.Researchers who traced the same households over 25 years found that the total wealth gap between White and Black families nearly tripled, from 85,000 in 1984 to 236,500 in 2009. These researchers found that the biggest drivers of the growing racial wealth gap are racial differences in yearsof homeownership; household income; unemployment; college education; and inheritance and other forms of financial support from family and friends(Shapiro, Meschede, & Osoro, 2013).6 Student Loan Debt Vulnerable Borrowers Series
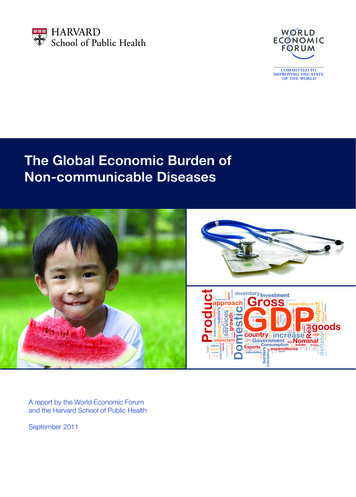
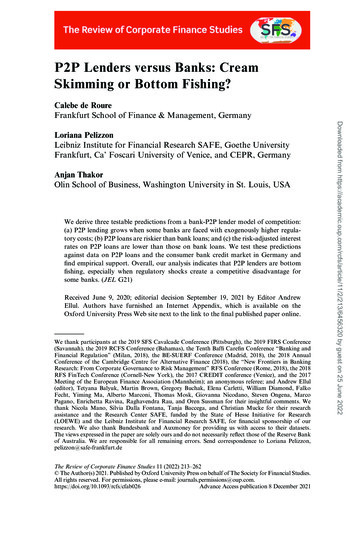
In the absence of data on household wealth at theNew York City level, we provide indicative evidence ofa racial wealth gap by comparing the homeownershiprate of Black households and White households in thecity. See Figure 2.Citywide, there is a 15 percentage point gap betweenBlack and White household homeownership rates.Homeownership rates for Black households rangefrom a low of 10 percent in Manhattan to a highof 49 percent in Queens. For White households,the lowest homeownership rate is in Manhattan, at33 percent, and the highest rate is in Staten Island,at 78 percent. The Black-White homeownership gapranges across boroughs from 2 percentage pointsin Queens to 41 percentage points in Staten Island.Even among Black households in the city who haveachieved homeownership, racial disparities in propertyvalues still impede the ability to build home equity.A 2018 report by the Brookings Institute estimated thathomes in majority-Black neighborhoods in the NewYork City metro area8 were valued at an average of9.8 percent less than homes in neighborhoods withsimilar amenities and neighborhood quality but wherefewer than 1 percent of residents are Black (Perry,Rothwell, & Harshbarger, 2018).In addition to driving disparities in student loan debtburdens, wealth gaps have implications for degreecompletion, too.Students from families with lower wealth attendcollege and complete their degrees at lower rates thanstudents from families with greater wealth and thisdisparity is growing (Pfeffer, 2018). Black borrowersare more likely than White borrowers to drop out ofcollege; approximately 39 percent of Black borrowersdrop out of college compared to 29 percent of Whiteborrowers (Huelsman, 2015).Survey evidence points to financial struggles. A 2019survey of respondents aged 25 to 64 with somecollege and no degree found that the top two reasonsfor degree non-completion were “work-related” and“financial pressure” (Strada Education Network, 2019).Figure 2. Share of Households Who Own Their Home Outright or with a Mortgage, by Race and nQueensStaten IslandNYC - AllSource: DCWP analysis of U.S. Census Bureau; American Community Survey (ACS), Five-Year Public Use Microdata Sample (PUMS), 2014-20188 This data includes counties outside of New York City.Black Borrowers 7
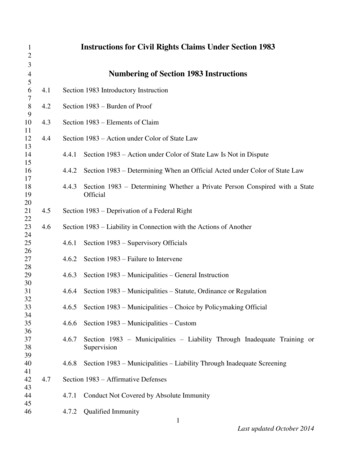
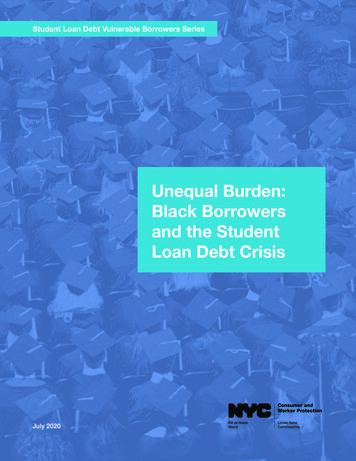
School Quality andHigher Education OutcomesSince aspiring college students demonstrate theircollege preparedness through grades, test scores,and the reputation of the high school they attend,Black college applicants may find that the limitingeffect of lower wealth accumulation on access tohigh-performing primary and secondary schoolsimpedes their access to quality higher educationoptions. As the Center for American Progress hasshown, Black students on average get their degreesfrom less selective and lower performing schools,9revealing a direct outcome of lower Black wealthaccumulation.In Figure 3, we provide evidence of a Black-Whitedisparity in access to quality higher educationopportunities, as measured in this case by graduationrates and student loan repayment rates, two minimumthresholds indicating college attendance led tosuccess.10 In the chart, we compare the degreecompletion and student loan repayment outcomesfor students who attend the top five public and topfive private schools listed in The Wall Street Journal(WSJ)/ Times Higher Education (THE) College Rankings202011 to the five schools with the highest share ofBlack undergraduate students in New York City.12Figure 3. Outcomes at Top 5 Best Value Public and Private Schools Compared to 5 Schools with the HighestShare of Black Students in NYCDegreeCompletionAbility to RepayStudent LoansBlack Share ofUndergraduatesTop 5 Private SchoolsBest 20%Fordham UniversityPratt InstituteNew York UniversityBarnard CollegeColumbia UniversityKEYWorst 20%Top 5 Public SchoolsBaruch CollegeQueens CollegeHunter CollegeCity CollegeBrooklyn College5 Schools with HighestShare of Black StudentsDeVry CollegeYork CollegeMonroe CollegeMetropolitan CollegeMedgar Evers College020406080Source: Top 5 based on The Wall Street Journal/Times Higher Education College Rankings 2020. Institution outcome data collected fromCollege Scorecard 2016-2017. See Appendix A: Data and Methodology for more information.9 As measured by proxies, including educational spending per student, average SAT score, faculty salary, and student-faculty ratios (Libassi, 2018).10 Completing a degree and being able to repay student loans are both necessary but not sufficient indications of the benefits of college attendance.The seven-year repayment rate is the share of students who entered repayment on their student loans at the same time and were able to pay at least 1of their student loan principal seven years later. See Appendix A: Data and Methodology for quintile ranges.11 We removed Yeshiva University, as their racial and ethnic compositions may be driven more by religious affiliation than by other external factors.See Appendix A: Data and Methodology for more information.12 Analysis was limited to four-year institutions to maintain comparability between the most prestigious schools and the schools with the highest share ofBlack undergraduate students in New York City.8 Student Loan Debt Vulnerable Borrowers Series
We find that three out of five of the top private schoolsfall in the top 20 percent of schools in terms of degreecompletion within six years, and four out of five of thetop private schools are in the top 20 percent in termsof students’ ability to repay their loans. Unfortunately,the share of Black students at these top five privateschools is less than 8 percent compared to acitywide Black undergraduate share of approximately16 percent.13When we examine the top five public schools, wefind the share of Black students is higher (between 9and 22 percent), but the graduation and repaymentoutcomes are far less favorable. Four out of five of thetop public schools fall in the middle of the distributionor below when it comes to degree completion andability to repay student loans. Public schools tend tobe the most affordable options for postsecondarystudents, so the fact that these schools produceaverage and below average repayment outcomesindicates that the dependence on debt to financehigher education is unsustainable.When we consider the outcomes at the five New YorkCity four-year institutions with the highest share ofBlack students, with a Black student share between34 and 76 percent, we find a disturbing pattern. Withthe exception of one college, the schools in the citywith the highest shares of Black students fall at thebottom of the distribution when it comes to rates ofdegree completion. Furthermore, all five of the schoolswith the highest shares of Black students fall at thebottom of the distribution when it comes to the abilityof student borrowers to repay their student loansseven years after entering repayment.at twice the rate of students from plurality Whiteneighborhoods (NYC DCA, 2018). We also found thatNew York City resident students receiving Post-9/11GI Bill funding attend for-profit institutions at nearlydouble the rate as their closest comparison group,independent students, and that Black GI Bill recipientsattended these schools at over twice the rate of WhiteGI Bill recipients (NYC DCA, 2020).For-profit schools often justify their poor studentoutcomes by asserting that their education offeringsare a service to higher risk groups who otherwisewould have fewer options to study and improve theirjob prospects (Devaney, 2014). This assertion wouldhold if attending a for-profit school always succeededin improving the livelihoods of attendees. Instead, atsome schools we see the pernicious phenomenonof “predatory inclusion,” an expansion of educationaccess funded through personal debt and thesubsequent growth of an exploitative industry thatmeets the increased demand for higher educationwith low-quality, high-cost programs (Seamster andCharron-Chennier, 2017). Student loan debt andaggressive recruiting by some for-profit colleges haveallowed more Black students through the doors ofcolleges around the country, but the results of thisincreased access have in too many cases underminedthe financial health of Black college-goers.Two of the schools with the highest share of Blackundergraduates are for-profit schools. On average,for-profit institutions have been shown to have: higher net prices;higher borrowing rates;lower graduation rates;worse employment outcomes; andhigher student loan debt default rates(Smith & Parish, 2014).Some for-profit schools target Black college aspirants,among other vulnerable populations (McMillanCottom, 2017; Taylor and Appel, 2014).We see this in our own research: students fromplurality Black neighborhoods attend for-profit schools13 DCWP OFE analysis of College Scorecard 2016-2017 downloaded 6/3/2020.Black Borrowers 9
The Labor Market and Difficulty RepayingWhen Black young adults enter the labor market, acollege degree is no guarantee of financial security,as many Black college graduates experience theunjust effects of the racial wage gap (Patten, 2016).Several factors contribute to Black graduates receivinga lower college wage premium14 compared to theirWhite peers, including: Education quality gapCompared with White students, Blackgraduates are more likely to haveattended institutions of lower educationalquality (Libassi, 2018).15 Graduates fromschools that are more selective in theiradmissions and, therefore, presumablyof better quality earn 11 percent morethan graduates from a nonselectiveschool (Chakrabarti & Jiang, 2018).In addition, graduates from selectiveschools are endowed with social capitaland professional connections thatotherwise elude their peers who attendless selective institutions. Occupational segregationThe process by which members ofdifferent demographic groups sortinto different professions due tosocial norms and other factors—forexample, women are more likely towork in child care than men16—beginsfor many students after high schoolwhen students select programs,schools, and majors. Black studentsare overrepresented in majors that leadto work in lower-paying fields, such associal work, and underrepresented inhigh-earning fields, such as engineering(Carnevale et al., 2016). Credential gapWhite students are more likely to earnbachelor’s degrees, the undergraduatecredential that yields the highest returnon a student’s investment in terms offuture earnings. Black students, bycontrast, are more likely to complete acertificate or associate’s degree, whichyield lower returns (Libassi, 2018). Labor market discriminationBlack workers experience significantlyhigher un- and underemploymentwhen compared to White workers;little of the difference can be explainedby observable characteristics (Cajneret al., 2017). Even with higher educationcredentials from elite institutions, Blackgraduates experience the effects ofracial discrimination in hiring. Researchindicates that Black graduates ofelite universities receive only as manycallbacks for jobs as White candidatesfrom less selective universities. Evenwhen employers respond to Blackapplicants, the employers are more likelyto offer jobs with lower starting salariesand lower prestige (Gaddis, 2014).In Figure 4 on page 11, we illustrate the racialcredential gap in New York City. The chart showsthe college attainment rates for both Black andWhite adults aged 25-45.17 We find that a smallershare of Black New Yorkers in this age group haveattained some college or more, 63 percent, comparedto 86 percent of White New Yorkers. Of all Black NewYorkers who attended college, nearly half either didnot complete a degree or attained an associate’sdegree only. Of White New Yorkers who attendedcollege, over 80 percent attained a bachelor’s degreeor higher.Figure 5 shows the confluence of forces—degreesfrom lower-quality institutions, lower or no credentials,fewer students in high-paying fields, and labor marketdiscrimination—by presenting median earningsfor New York City residents aged 25-45, by level ofeducation.14 The college wage premium is the difference between the average earnings of those with a college degree and the average earnings of those who do nothave a college degree.15 See footnote 6.16 For more on this, see l-segregation-in-the-united-states/17 Age range was chosen to allow readers to compare results with Figure 4.10 Student Loan Debt Vulnerable Borrowers Series
Figure 4. Degree Completion for Black and White NYC Residents Aged 25-45BlackWhite9%21%No College37%SomeCollegeor More63%9%No College14%22%SomeCollegeor More86%22%42%8%Some College, No DegreeAssociate's9%Bachelor'sMaster'sProfessional or DoctorateSource: DCWP analysis of U.S. Census Bureau; American Community Survey (ACS), Five-Year Public Use Microdata Sample (PUMS), 2014-2018Figure 5. Median Annual Pre-tax Wage/Salary for NYC Residents Aged 25-45 with Some College or More,by Highest Level of Education Attained and Race100K80K60K40K20KWhiteBlack0Some College,No reeProfessional orDoctorate DegreeSource: DCWP analysis of U.S. Census Bureau; American Community Survey (ACS), Five-Year Public Use Microdata Sample (PUMS), 2014-2018Black Borrowers 11
Across all degree types, Black New Yorkers earn lessthan their similarly educated White peers. The annualincome discrepancy ranges from a low of 5,300 forworkers who have attained some college but did notcomplete a degree to a high of 21,900 for bachelor’sdegree holders.18 This racial earnings gap forbachelor’s degree attainment underscores the pointthat education is no longer the “great equalizer” it wasonce thought to be.The pairing of the racial wage gap and Blackstudents’ higher student loan debt burden, as well asthe “diminishing market value of any given degree”as more young people acquire higher educationcredentials (Morgan & Steinbaum, 2018) leaves Blackyoung adults in a vulnerable position. Further, racialdiscrimination means that Black young adults needmore credentials to compete with White workers,but obtaining those credentials leads to an oftenunsustainable debt burden (ibid). Recent findingspoint to a crisis in student loan repayment amongBlack borrowers and a stark race- and gender-basedgap in repayment outcomes. A report by Demosfound that 12 years after starting college, the typicalWhite male borrower has reduced his balance by44 percent compared to the typical Black femaleborrower whose balance has increased by 13 percent(Huelsman, 2019).Finally, the likelihood that Black student loan debtholders will be able to accumulate a significant amountof wealth in their lifetimes is significantly hampered bythe combination of high debt and lower earnings.19Researchers who created a model to study the effectsof student loan debt on wealth accumulation foundthat, for a two-income household, a student loan debtburden of 53,000 leads to a lifetime wealth loss ofnearly 208,000 (Hiltonsmith, 2013).20Once again, the disparate impact of student loandebt on Black borrowers persists, as student loandebt accounts for an estimated 13 percent of theracial wealth gap at age 25, growing to 23 percent byage 30 for adults with some college or more (Houle& Addo, 2018). Scholars refer to this process as the“reproduction of the fragile Black middle class” (ibid),a reference to the cycle of Black student loan debt andthe racial wealth gap.21ConclusionRather than delivering education’s promise as the“great equalizer,” our higher education systemactually perpetuates the racial wealth gap byrequiring high levels of borrowing. Moreover, the verysame structural racial inequities behind our country’sracial wealth, education quality, and wage gaps drivethe cycle that leads to Black students’ heightenedlevel of student loan debt distress. If structural racialinequities are left unaddressed, Black borrowersin New York City, as in the rest of the country,will continue to struggle to repay debt, which willperpetuate higher default rates for Black borrowers,which will contribute indefinitely to the racial wealth,education quality, and wage gaps, and vice versa.There is some promising movement to report.The alarming racial disparities in student loan debtdistress have come to the attention of researchers,policymakers, and politicians, primarily at the nationallevel.22 Although a national spotlight is important,racial disparities occur at the local level and deservecities’ dedicated attention and solutions alongsideother significant social challenges like residential andschool segregation.18 Age range was chosen to cut off the peak earning years. A smaller share of Black New Yorkers have college experience in these years, inflating thewage gap. The earnings discrepancies reported for New Yorkers aged 25-45 remain when the data is limited to New Yorkers aged 25-35.19 Also decreasing Black borrowers’ ability to build wealth is the fact that college-educated Black individuals are much less likely to receive a large financialgift (for example, money from a parent) than college-educated White individuals. When Black households do receive financial gifts, they are significantlysmaller than the median gift that a White household receives (Meschede et al, 2017). Indeed, in what has been colloquially termed a “second racial wealthgap” and a “Black tax” (Jones, 2015), Black college graduates are more likely to transfer money to their parents than to receive money from their parents.In one study, nearly three times as many college-educated Black households as college-educated White households provided financial support to theirparents (Meschede et al., 2017).20 Nearly two-thirds of this lost wealth comes from lower retirement savings, and over one-third comes from lower home equity (Hiltonsmith, 2013).21 The effects of the racial wealth gap on the racial borrowing gap are not limited to the college-going generation. Black parents with low incomes aremore likely than White parents with low incomes to take on debt through the federal Parent PLUS loan program to cover their children’s college costs(Fishman, 2018), imperiling these parents’ financial well-being and eventual retirement security.22 See, for example, U.S. Senator Cory Booker’s recent request for additional research on this topic in his Letter to NY Fed regarding Race Disparities inStudent Loan Borrowers: n-Borrowers12 Student Loan Debt Vulnerable Borrowers Series
The City of New York has taken steps towardacknowledging the scale and importance of localracial disparities and has mobilized the City’s uniqueresources to address them.HomeownershipRecognizing that homeownership is one of theprimary methods of accumulating wealth, theCity has developed several programs to addressaffordability for New Yorkers with low to moderateincomes. Two notable programs are: HomeFirst Down PaymentAssistance Program23This program provides down paymentassistance for first-time homebuyerswith incomes up to 80 percent of thearea median income. Open Door Program24This program funds the construction ofcondominiums and cooperatives soldat an affordable price to New Yorkerswith moderate and middle incomes.Programs and Initiatives That CombatRacial Disparities in New York CityHomeownershipHomeFirst Down Payment Assistance ProgramOpen Door ProgramEducationSchool Diversity Advisory GroupDiversity in Admissions PilotsDistrict Diversity GrantsEmploymentOneNYC 2050Student Loan Debt HelpStudent Loan Debt Clin
1. Student loan borrowers had a net worth, independent of student loan debt, that was 8,200 less than their non-borrowing peers. 2. Holding the impact of borrowing on net worth constant, Black college attendees had a net worth that was 8,500 less than their White peers. 3. The median homeowner who held student loan debt had 9,300 less in