Transcription
Measures of Socio-Economic Status in EducationalResearch: The Canadian ContextSarah L. Patten, University of TorontoAbstract This study aims to recommend and test a conceptual model for socio-economic status (SES) and variables to measure it that are available to researchers inCanada and applicable in other countries. Recommendations for quantitative researchers are presented to address issues that arise with including SES in analyses.The study analyzed data linking student achievement in mathematics and literacyto both economic and social factors. Results from hierarchical linear modellingshowed that the use of intersecting variables was better served to answer researchquestions than any individual SES measure or a composite measure. Using SES measures at the school and neighbourhood level is also recommended.Keywords Socio-economic status; Student achievement; Hierarchical linear modelling; Canadian contextIntroductionOne purpose of educational research is to determine factors that influence studentacademic success in order to recommend changes to policy and approaches to leadership. Over the last three decades, quantitative researchers have come to dependSarah L. Patten (2019). Measures of Socio-Economic Status in Educational Research: The CanadianContext. International Journal of Education Policy & Leadership 14(3). URL: le/view/858 doi: 10.22230/ijepl.2019v14n3a858IJEPL is a joint publication of PDK International, the Faculty of Education at Simon Fraser University, theCollege of Education and Human Development at George Mason University, and the University of Delaware.By virtue of their appearance in this open access journal, articles are free to use, with proper attribution, ineducational and other non-commercial settings 90 days after initial publication. Copyright for articles publishedin IJEPL is retained by the authors. More information is available on the IJEPL website: http://www.ijepl.orgIJEPLVolume 14(3)2019
on measures of socio-economic status (SES) as part of this process. Michael Harwelland Brandon LeBeau (2010) note that:IJEPL 14(3) 2019Analyses of educational data often include student background variables as statistical controls to enhance the credibility of inferences.One of the most frequently used student variables is socioeconomicstatus. (p. 120)Measures of SES:The CanadianContextPattenIn order to determine if interventions, leadership actions, and policy decisionshave an impact, “SES is taken into account statistically to ensure that the program’seffectiveness is evaluated independent[ly]” (Harwell, 2018, p. 3). Data about incomelevels and poverty are also used to allocate resources in many jurisdictions. As well,by controlling for SES, researchers are able to compare results across schools, districts, provinces, states, and even countries. However, the use of student SES as avariable in statistical analysis is complicated by the fact that researchers do not alwayshave access to the same measure. As well, SES can be measured at different aggregatelevels (individual, school, neighbourhood, and district). There is a need for accessible,reliable, and valid measures of SES because of the important decisions being madein education with this data. One option for a consistent measure is to use federallevel data based on family income. For example, in the United States there is a measure of whether students qualify for a free or reduced-price lunch (FRL) based onfamily income. In the United Kingdom there is an income-based measure to determine whether students receive a free school meal (FSM). However, a similar measureof SES does not exist for studies based in the Canadian context. In Canada, educationis the purview of provincial and territorial governments, which means that there isnot a consistent measure across the country. Researchers in Canada, and in othercountries, need reliable, valid, and consistent measures of SES. The purpose of thisarticle is to review past practices and options for SES measures that are available inCanada and then develop a conceptual model. Data from a previous study(Leithwood, Patten & Jantzi, 2010) will be reanalyzed using hierarchical linear modelling to test the model and determine measures of SES that are available in theCanadian context and can be recommended for use by quantitative researchers.Theoretical backgroundThe assertion that SES is an influential factor began in the United States with a reportby James Coleman (1966) and in the United Kingdom with a report by GilbertPeaker (1971). In both reports it was “concluded that family background was moreimportant than school factors in determining children’s educational achievement”(Buchmann, 2002, p. 166). This perspective continues to inform research as:the theoretical framework sociologists use to examine inequalitiespresumes that academic attainment, and ultimately occupational attainment, are largely determined by family origins and educationalexperiences. (Willms, 1999, p. 9)The Coleman (1966) and Peaker (1971) reports and other studies that have followed, suggest that the “socioeconomic status (SES) of families explains more thanhalf of the difference in student achievement across schools” (Leithwood, Louis,2
Anderson, & Wahlstrom, 2004, pp. 46–47). Other research has determined thatfamily related factors account for as much as 50 percent of the variation in studentachievement across schools (Kyriakides & Creemers, 2008). Larger studies, including meta-analyses, have found a strong link between socio-economic factors and student academic achievement (Caro, McDonald, & Willms, 2009; Fan & Chen, 2001;Fan & Williams, 2010; Nagy, Traub, & Moore, 1999; Sirin, 2005). In a reportMichael Harwell (2018) states:IJEPL 14(3) 2019PattenMeasures of SES:The CanadianContextSES is a core facet of much educational research and policy becauseof the perceived importance of taking into account disparities inSES among students, classrooms, and schools to help ensure accurate inferences about student learning and achievement. (p. 6)A literature review of leadership effects on student achievement determined thatempirical evidence supported four claims about family background:1. A family’s SES is strongly related to student learning and behaviour.2. A family’s SES influences learning indirectly by shaping educational culture in the home.3. Strong family educational culture provides children with intellectual, social, and emotional capacities that improve theirchances of being successful in school.4. Wider communities in which children live also contribute to thecapacities needed for school success. (Leithwood et al., 2004)There is an entrenched belief in data-based educational research that SES mustbe accounted for when quantitatively evaluating student achievement in responseto interventions, leadership actions, and policy. This article seeks to recommend conceptual models for SES measures that are available in the Canadian context and willbe useful for research in education.Literature reviewFor such an essential measure, there is little agreement about how to represent andmeasure SES both within and between countries. As well, the selection and availability of SES factors has changed over the last five decades. Once SES was foundto have an impact on students’ achievement throughout the 1970s, researchersbegan to rely on single measures beginning in the 1980s. With the developmentof more sophisticated data analysis, the use of a single, dichotomous variable hasbeen challenged. More researchers are testing the use of composite variables or including multiple measures of SES to address many sources of variance. The literature review gives an overview of measures that have been previously used, as wellas an evaluation of those that are most useful for educational researchers in theCanadian context.Single measuresA variety of studies choose to represent and measure the effect of SES using a singlevariable. As seen in Selcuk Sirin’s (2005) meta-analysis, two of the most prevalentsingle measures are parental education and parental occupation. These both connect3
to the presumption that the economic status of the parents influences the educationaland future occupational outcomes of the child (Willms, 1999). A proxy measure forfamily income used in the United Kingdom is the percentage of students eligible foran FSM, because eligibility is based on family income and whether the family is receiving government assistance (Gorard, 2012; Hobbes & Vignoles, 2010). Whilethe local school authorities do not collect information about individual income, thepercentage of students eligible for an FSM in a school is readily available from schooladministrations at no cost, which makes it an attractive measure for researchers.Similarly, one of the most-cited measures of SES in quantitative studies in the UnitedStates is the percentage of students who qualify for FRL lunches, which is determinedby federal government funding allocations and based on household income (Harwell,2018; Kurki, Boyle, & Adaljem, 2005). There is an assumption that eligibility forFRL can be used to measure income and, subsequently, SES because:IJEPL 14(3) 2019PattenMeasures of SES:The CanadianContextStudents are eligible for a reduced price lunch if their householdincome is less than 185% of the federal poverty guidelines and fora free lunch if their household income is less than 130% of thepoverty guidelines. (Harwell & LeBeau, 2010, p. 122)All of these single-indicator measures connect back to the premise that SES is meaningfully represented only as a function of family income, parent occupation, orparental education.There are both benefits and problems with using a single measure to representSES. A single measure is easy to collect, especially for large data sets, and can be accessed for very little cost (Harwell & LeBeau, 2010). The information can also becollected unobtrusively as it is often available publically, which avoids the problemsassociated with asking students about the SES of their families (Merola, 2005). WhenSES is being measured to serve as a control variable, only using one value simplifiescalculations and avoids the problems associated with missing data. However, somereports criticize using family income as a crude proxy variable for SES because although income is related to family educational culture, it cannot account for otherinteractions or influences in the family or community (Cabrera, Karl, Rodriguez, &Chavez, 2018; Leithwood et al., 2004; Roebuck, 2017). By only using one variable,studies can overestimate SES effects. When studies adjust for family background butonly use one measure, this leads to what Peter Hill and Kenneth Rowe (1996) callunder specification, in that not all relevant aspects of family background are includedand “the impact of unreliability in intake measures invariably leads to over-estimatesof the proportion of variance at the student level” (p. 10). Another issue when onlyusing one measure is the possibility of an imperfect binary. Some studies will set upa dichotomous measure as a proxy for income, for example, students who qualifyfor an FSM and those who do not. However, not all students who qualify for an FSMare in the lowest-income households, which results in an imperfect proxy bias(Hobbes & Vignoles, 2010) and an “unreliable approximation of SES, since the truevalue of the underlying concept is continuous” (van Ewijk & Sleegers, 2010, p. 138).There can also be issues when an FRL is used as an aggregate at the school level as“enrollment rates provide an imprecise measure of school-level economic advantage”(Domina, Brummet, Pharris-Ciurej, Porter, Penner, Penner, & Sanabria, 2017, p. 2).4
The literature reviewed shows that there are both benefits and problems associatedwith using a single measure of SES that researchers must consider. As well, whenconducting research outside of the U.S. or the U.K., there are no equivalent measuresto use as proxies for family income.IJEPL 14(3) 2019PattenMeasures of SES:The CanadianContextMultiple measuresAnother approach in educational research is to conceptualize SES as a combinationof factors. These studies often use a traditional measure of SES (income, parental occupation, or parental education) coupled with measures of family resources, educational culture, or neighbourhood influences. The American Psychological AssociationTask Force (APA, 2007) report states that SES must be considered in context withother constructs and an “intersectional approach considers these constructs as multiple, interlocking dimensions of social relations” (p. 8). There are examples of studiesthat consider multiple measures of SES. Doris Entwisle and Nan Astone (1994) recommend that researchers use family income, the mother’s education level, and information about the family structure (e.g., the number of birth parents, step-parents,or grandparents in the home). In a study of the impact of school organizational culture on student achievement, a sociocultural capital index was used based on bothparent’s highest education levels and the number of books in a student’s home(Dumay, 2009). Research studies have also looked at family background and characteristics to help explain the variance in student achievement. In a Canadian study,Xin Ma and Don Klinger (2000) estimated a variable called SES using student reportsof “education related possessions at home and their participation in social and cultural activities, rather than parental income or occupation” (p. 44). The same studymeasured the number of parents in the home (two or one) and created a variablecalled Parental Involvement by asking students how much a parent helped withhomework and talked about the importance of school. In a study of secondary students results on a literacy test in Ontario, the level of mean family income in theneighbourhood of the school was measured in conjunction with access to a computerand literary resources at home (Klinger, Rogers, Anderson, Poth, & Calman, 2006).A link between a family’s access to resources and a student’s academic achievementis seen when SES is measured with multiple variables. Using an intersection of factorsalso provides researchers with the ability to conceptualize SES in a broader sense.However, some difficulties when working with several intersecting measurementsare collecting accurate data and being able to determine which variables have had asignificant influence. As well, as seen in the examples, the conceptualization of SESis not consistent.A further extension of this research approach is to use composite measures,where several factors are accounted for, but the analysis only uses a single value derived from the measures. One composite measure is called the Social Risk Index(SRI). Human Resources Development Canada (HRDC, 2003) developed it as a wayto profile the SES and potential risk factors in communities, such as low income,high mobility, or high unemployment rates. It includes nine variables available fromCanadian census data: average household income, unemployment rate, proportionof adults without a high school diploma, proportion of homeowners, mobility, speak-5
ing an official language, proportion of recent immigrants, lone-parent families, andreliance on government transfer payments. The composite scores results in a numberfrom zero to nine, with higher scores indicating an increased level of social risk. Acomposite accounts for a variety of factors influencing SES at a neighbourhood level,yet still provides a single value for use in calculations.As with other methodological approaches, there are problems with composites.The APA (2007) task force cautions against their use:IJEPL 14(3) 2019PattenMeasures of SES:The CanadianContextone should be careful about creating a composite measure. It is generally more informative to assess the different dimensions of SESand understand how each contributes to an outcome under studyrather than merge the measures. (p. 11)Many composite measures use data gathered from a country’s census. There can bean issue with this reliance on census data:The main drawback of census-based poverty measures is the factthat full census data are collected and published only every 10 years.Although neighborhoods do not change overnight, significantchanges do take place over the course of 10 years, and the studentcomposition of schools is likely to change even faster. (Kurki et al.,2005, p. 7)Even in Canada, where census data is collected every five years, there is a possibilitythat neighbourhoods may changes over that time. Composite measures can providea representation of SES that involves many factors, but whether they are applicableor available in a specific context needs to be taken into account.Levels of measurementA consideration for researchers is whether the data will be collected from individualstudents, aggregated at the school level, or taken from the neighbourhood aroundthe school. The most comprehensive and accurate picture of SES comes from questioning an individual or family members about their lives. However, very few largescale quantitative studies can afford the time and cost associated with collectingaccurate data from individuals. Often, university-based researchers are not allowedaccess to students. In the case of younger children, they cannot accurately answerincome, occupation, or parental education-level questions, so their parents must becontacted to provide accurate information (Kurki et al., 2005; Viadero, 2006). Thereare also issues of privacy around SES, such that the Programme for InternationalStudent Assessment and other international studies do not allow students to be questioned about income (May, 2002). Individual non-response to questions about SESresults in missing data and undermines the study (Hauser, 1994). The next level ofaggregation is to calculate values to represent the whole school. Several meta-analyseshave found a strong correlation between SES and student achievement when aggregated at the school level (Hattie, 2009; Sirin, 2005; White, 1982). Karl White (1982)found that the correlation between SES and academic achievement was strongerwhen aggregated to the school level, rather than at an individual student level.Similarly, Sirin (2005) determined that:6
of all the factors examined in the meta-analytic literature, familySES at the student level is one of the strongest correlates of academicperformance. At the school level, the correlations were evenstronger. (p. 438)IJEPL 14(3) 2019PattenMeasures of SES:The CanadianContextFortunately, in Canada, school-level achievement and economic data is oftenavailable publically through the provincial or territorial education ministry. The nextlevel of aggregation is to use SES values that represent the neighbourhood surrounding the school. An argument is that neighbourhood data is a better alternative because “the immediate geographic area where a person lives fundamentally mouldsthat individual’s life chances: his or her educational, social and financial future”(Kurki et al., 2005, p. 3). Psychological research has shown that the perception ofsocial rank within the neighbourhood also has an impact on student well-being(Roebuck, 2017). The belief that neighbourhood SES is important for student successis seen at work at the Ontario Ministry of Education (OMOE). Information on thepercentage of school children from low-income households who are recent immigrants, whose parents have less than a high school diploma, and who come fromsingle-parent families, determines an amount of additional funding to school districts(OMOE, 2010). The ministry uses data from the Statistics Canada census for eachdissemination area (DA) linked to postal codes in the province. The OMOE uses student home address postal codes to determine what percentage of each school’s population is in each DA, then weights the census data to provide a more accurate pictureof each school’s neighbourhood demographics. Philip Nagy, Ross Traub, and ShawnMoore (1999) refer to this as the enrollment method, where:the demography of a school is indexed in terms of the demographyof those parts of the catchment area and beyond that are representedby the students attending the school which requires the postalcodes of the students attending the school. (p. 37)This comparative study found that the enrollment method for measuring SES correlates more strongly with student achievement (Nagy, et al., 1999). The Governmentof British Columbia uses Statistics Canada data for six indicators and analyzes it bydistrict to determine social economic indicators (BCStats, 2013). However, this levelof analysis is too time consuming for individual researchers and not all Canadianprovinces track the same data, so there is not a consistent country-wide measure oraggregate level for researchers. However, if a provincial government makes thesemeasures publically available, then they can be reliable and useful for educationalresearch.Criteria for use of SES measuresAs mentioned previously, a researcher must carefully consider the scope and purposeof his or her study when deciding on the most appropriate measure of SES and thelevel of aggregation to use for the data. Some factors that influence research designand the way that SES is measured are the type of information that is publically andfreely available and the scope and timelines of the study (Harwell, 2018; Harwell &LeBeau, 2010; Merola, 2005). It is important to include a measure of SES in quanti-7
tative study design, but how do researchers determine an appropriate measure?Robert Hauser (1994) outlines three important characteristics of an SES variable: itmust be easy to measure, be measurable for every child involved in the study, andmust not vary over the short term. Stacey Merola (2005) explained some of the difficulties with accumulating SES data if parents could not be interviewed and the“need to balance the very real concerns of cost and obtrusiveness with the need tocollect valid data” (p. 3). The American Psychological Association (APA, 2007) reporton the use of SES in research is clear that researchers must base their choice of SESmeasure on a specific theory so that it truly relates to the outcome being studied.Based on the work of the APA and several other research studies, Harwell and LeBeau(2010) outline an approach for researchers to follow. Researchers should begin with“a clear conceptualization of SES and select one or more variables that capture therelevant circumstances of a student’s SES consistent with that conceptualization andthe purpose of the study” (p. 126). The conceptualization of SES needs to be part ofthe design phase in research.Researchers must strike a balance when finding useable measures of SES foranalysis that are accessible at a reasonable cost and valid and reliable for the researcher’s conceptualization. There are measures that require little work on the researchers’ part, such as the percentage of students qualifying for an FRL or FSM.These values are already calculated by the school or district and they are collectedeach year. However, there is criticism that an FRL is not valid or reliable because theinformation is based on self-reporting and it is a crude measure of income (Dominaet al., 2017; Harwell, 2018; Harwell & LeBeau, 2010; Viadero, 2006). There are alsoquestions about the validity of any study that only uses one measure of SES (APA,2007; Cabrera et al., 2018; Hill & Rowe, 1996) that is tied to family income. Thereare more factors that influence student achievement than just income level.Researchers may conceptualize socio-economic measures as combined variablesand composite measures. Examples of this type include both income and educationalresources in the home or parental education. A study found that a proxy for incomeworked better when combined with other measures of SES (Cabrera et al., 2018).These measures, both economic and social, may be available from schools or can becalculated with publically available information. Again, researchers need to thinkcarefully about the conceptualization of SES, preferably in the early stages of planning and before data collection begins.IJEPL 14(3) 2019PattenMeasures of SES:The CanadianContextPurposeBased on the literature review, the hypothesis of this article is that the calculation ofintersecting variables better serves to answer research questions than any individualor composite measure and that SES should be measured at the school and neighbourhood level. Socio-economic status should be conceptualized and measured asthe result of both economic and social influences (APA, 2007; Cabrera et al., 2018;Dumay, 2009; Entwisle & Astone, 1994; Leithwood, Patten & Jantzi, 2010; Klingeret al., 2006). As well, Lisa Nicholson, Sandy Slater, Jamie Chriqui, and FrankChaloupka (2014) recommend “that multiple components should be measured andused separately in the models” (p. 57). In the Canadian context, data for the areas8
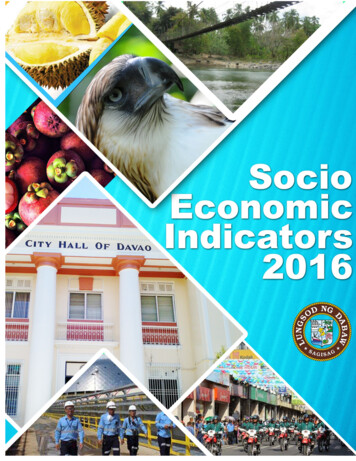
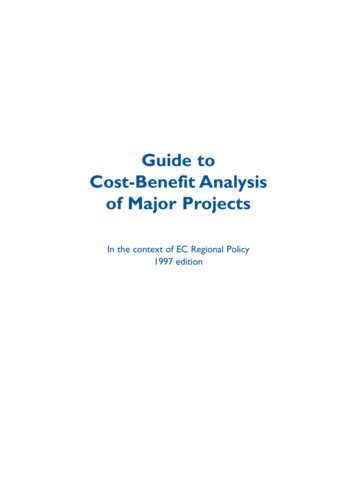
surrounding schools is publically available and a study is able to measure severalfactors with a reasonable level of cost of access and calculation. By aggregating dataat the school or neighbourhood level, the issue of individual non-response is eliminated and a researcher is better able to measure neighbourhood effects (Nagy et al.,1999). The next step in continuing this research is to test measures of SES usingdata from multiple district school boards in Ontario and compare several approachesto analysis to see which better explains the variance within student achievement results in mathematics and literacy.IJEPL 14(3) 2019PattenMeasures of SES:The CanadianContextMethodsThe survey data used for this analysis was collected in the spring of 2009 as part ofa larger project on educational leadership (Leithwood, Patten & Jantzi, 2010). Forthis study, the achievement and SES measures collected were reanalyzed. Hierarchicallinear modelling (HLM) was used to test how different measures of SES explainedthe variance in mathematics and literacy scores in elementary schools. The first levelof analysis used mathematics and literacy scores for the school as the outcome variable and measures of SES were the predictors. The second level of analysis accountedfor different types of school district, whether public, Catholic, or French. The analysiswas completed using HLM 7 from Scientific Software International and proceduresoutlined by Stephen Raudenbush and Anthony Bryk (2002).There were responses from 219 elementary schools across 34 district schoolboards in Ontario. However, due to missing data only 199 schools are included inthe analysis. In Ontario there is province-wide testing of literacy and mathematicsin Grades 3, 6, 9, and 10. The outcome variable measuring student achievement isthe percentage of students at the school who achieved or exceeded the provincialstandard on the standards-based assessment. The value used in this analysis is theaverage of the success rate in math or literacy testing for all participating students atthe school. The measures of SES included the effect of family background measuredusing both school- and neighbourhood-level variables. A composite variable thatwas tested included three measures of the SES of families in the community aroundthe school: the income of households expressed as a percentage of the highest incomein the sample, the percentage of two-parent families in the community, and the percentage of adults in the area who attained some post-secondary education. Each ofthese three measures was also tested as an independent predictor of achievement. Ameasure of the education culture and resources within the home were two predictorsthat represented the percentage of students at each school who reported that theyhad adult support for homework and a computer available for their use in the home.The data on support in the home was collected through surveys given to each studentwho wrote the provincial test and was aggregated and reported publically for eachschool by the testing agency.ResultsThe data for each school was entered into SPSS Statistics 24 and the descriptive statistics are presented in Table 1.9
IJEPL 14(3) 2019Table 1. Descriptive mumMath achievement65.5314.062598.5Literacy achievement66.5512.4522.2597.5SES composite58.927.2143.3591Family composite38.624.8915.2551.50Income level34.678.5817.14Two parents84.215.326696Higher education57.8813.242693Adult help15.614.43230.5Computer at home61.629.71288.5PattenMeasures of SES:The CanadianContext100To test the hypothesis that using an intersection of factors would better explainthe variance in math and literacy test scores, the outcome variable represented thepercentage of students who wrote the test and scored at or above the provincialstandard for their grade. Prior to the analysis, the composite variables created weretested for internal reliability. The internal consistency of both variables was checkedusing the value of Cronbach’s alpha (α). For the SES composite the value wasα 0.802, which is considered strong. However, for the Family composite thevalue was α 0.542, which is weak. Therefore, only the SES composite was usedin the analysis. The two Family predictors were retained but were used as separatevariables.The first analysis used the achievement data for the province-wide mathematics test as it had a larger standard deviation and more variance withinthe school scores. The use of multilevel regression accounts for the nestednature of the data. The assumption is that if schools are part of the same district school board, they will follow similar policies and procedures and anyvariance within the district could be due to socio-economic factors. For allof the models the residual effects, μ0j, were assumed to be normally distributed with mean 0 and variance τ00. The analysis was run with restricted maximum lik
Sarah L. Patten, University of Toronto Abstract This study aims to recommend and test a conceptual model for . article is to review past practices and options for SES measures that are available in Canada and then develop a conceptual model. Data from a previous study (Leithwood, Patten & Jantzi, 2010) will be reanalyzed using hierarchical .