Transcription
The payne effect: primarily polymer-related orfiller-related phenomenon?Nadhatai Warasitthinon, Anne-Caroline Genix, Michael Sztucki, JulianOberdisse, Christopher G. RobertsonTo cite this version:Nadhatai Warasitthinon, Anne-Caroline Genix, Michael Sztucki, Julian Oberdisse, Christopher G.Robertson. The payne effect: primarily polymer-related or filler-related phenomenon?. Rubber Chemistry and Technology, American Chemical Society, 2019, 92 (4), pp.599-611. 10.5254/rct.19.80441 . hal-02566982 HAL Id: 2566982Submitted on 9 Jul 2020HAL is a multi-disciplinary open accessarchive for the deposit and dissemination of scientific research documents, whether they are published or not. The documents may come fromteaching and research institutions in France orabroad, or from public or private research centers.L’archive ouverte pluridisciplinaire HAL, estdestinée au dépôt et à la diffusion de documentsscientifiques de niveau recherche, publiés ou non,émanant des établissements d’enseignement et derecherche français ou étrangers, des laboratoirespublics ou privés.
The Payne Effect: Primarily Polymer-Related or Filler-Related Phenomenon?Nadhatai Warasitthinon,a Anne-Caroline Genix,b,* Michael Sztucki,c Julian Oberdisse,b andChristopher G. Robertsona,#,*abCooper Tire & Rubber Company, 701 Lima Ave, Findlay, OH 45840, USALaboratoire Charles Coulomb (L2C), University of Montpellier, CNRS, 34095 Montpellier,FrancecEuropean Synchrotron Radiation Facility, 71 Avenue des Martyrs, BP 220, F-38043, GrenobleCedex 9, FranceABSTRACTThe hysteretic softening at small dynamic strains (Payne effect) – related to the rolling resistanceand viscoelastic losses of tires – was studied as a function of particle size, filler volume fraction,and temperature for carbon black (CB) reinforced uncrosslinked styrene-butadiene rubber (SBR)and a paste-like material composed of CB-filled paraffin oil. The low strain limit for dynamicstorage modulus was found to be remarkably similar for CB-filled oil compared to CB-filled SBR.Small-angle X-ray scattering (SAXS) measurements on the simple composites and detailed dataanalysis confirmed that the aggregate structures and nature of filler branching/networking ofcarbon black were virtually identical within oil compared to the high molecular weight polymermatrix. The combined dynamic rheology and SAXS results provide clear evidence that thedeformation-induced breaking (unjamming) of the filler network – characterized by filler-fillercontacts that are percolated throughout the material – is the main cause for the Payne effect.However, the polymer matrix does play a secondary role as demonstrated by a reduction in Payneeffect magnitude with increasing temperature for the CB-reinforced rubber, which was notobserved to a significant extent for the oil-CB system.* Corresponding authors: cgrobertson@endurica.com; anne-caroline.genix@umontpellier.fr#present address: Endurica LLC, 1219 West Main Cross St, Findlay, OH 45840, USA1
INTRODUCTIONFor amorphous polymers and their crosslinked networks at temperatures above the glasstransition, the onset of strain-dependent (nonlinear) dynamic mechanical properties generallytakes place at relatively high strains ( 50%). Once filler particles are introduced into theseelastomeric materials at sufficient loading and polymer nanocomposites (PNCs) are formed,however, striking strain dependences of storage modulus (G’) and loss modulus (G”) occur at lowoscillatory strain amplitudes (e.g., in the range from 0.1% to 10%). Dillon, Prettyman, and Hall1were the first to document such nonlinear behavior, followed by Fletcher and Gent. 2 It wasPayne’s influential paper3and subsequent contributions to the literature, however, whichsolidified this hysteretic softening behavior at low dynamic strains as a key viscoelastic signatureof filled rubbers. Therefore, the phenomenon is generally called the Payne effect in both academicand industrial communities. We use this term because it is the most recognizable name for thebehavior, but we acknowledge the earlier discoveries. The main characteristics of this dynamicmechanical behavior are covered in a book chapter by Klüppel and Heinrich4and in a briefreview.5The Kraus model 6 was the first mathematical approach offered to describe the Payneeffect, and it is based on the breaking and reforming of the filler network. Another well-establishedmodel that derives predictions for the Payne effect from a different foundation involving polymerdebonding from filler is the Maier-Göritz model. 7 These two models are both widely employed tofit strain-dependent dynamic storage and loss moduli of filled rubber, despite their very differentfundamental origins.The proposition by Kraus is based on the evolution of the filler network with strain, andit is therefore essential to quantitatively characterize the nanostructure of this network. The mainmethods used in the literature are either electron microscopy, and in particular transmissionelectron microscropy (TEM), and small-angle scattering of neutrons or X-rays (SANS andSAXS).8-11 The key advantage of direct imaging techniques is the more straightforward analysis.Well-known drawbacks include the low statistical significance of a (very) small piece of sample inthe field of vision, as well as problems to actually see particle structures and correlations in densepolymer nanocomposites – which are the ones of interest for applications. Cutting thin slices forobservation in TEM is a possible way out, if many such samples can be observed. 12 Sometimes,quantitative analysis is possible based on some hypothesis on the extension of observedaggregates in the third dimension. 13 True three-dimensional observation by electron microscopyis much more involved, as proposed by Dalmas et al.14-15Small-angle scattering allows astatistically more relevant structural analysis, in particular due to averaging over macroscopic2
quantities in the beam, at the expense of a more involved data analysis, which however givesaccess to correlations even in dense media.16The typical structure of highly loaded polymernanocomposites is of multi-scale nature and can be subdivided in three parts: 17 (a) (polydisperse)primary particles, usually in the nano-range, (b) fused aggregates containing some tens of primaryparticles, and (c) a large-scale (LS) space-filling structure of branches containing the aggregates.In scattering, these different structural levels contribute in different q-ranges, and can thus beseparated. Many of the multi-scale structures of silica or carbon black (CB) dispersed in polymeradopt a fractal structure, 18-20 and they are usually well-described by the Beaucage model. 21-22 Ifone goes a step further in the description of interactions, it is possible to extract not onlycharacteristic sizes of nanoparticles (NPs) and aggregates but also virial coefficients of interactionpotentials23-24and local densities.25 In a comprehensive approach of multi-scale structure, wehave proposed a coherent quantitative analysis of small-angle data based on the average NPradius, the number of particles in each aggregate, aggregate size and density, and thecharacteristic size of large scale branches filling the sample.11,26Alternatively, if sufficientknowledge is available on the primary particles, e.g., if it is possible to measure them under diluteconditions in order to describe shape, polydispersity, and surface roughness quantitatively, thenreverse Monte Carlo modelling may be used for a quantitative analysis of the particle andaggregate structure.27-28This technique provides a series of real space snapshots with particledistributions, which are compatible with the observed scattered intensity. In the presentcontribution on more or less ill-defined carbon black particles, the above-mentioned multi-scaleapproach had to be used. It is based on the extraction of robust features of the scatteredintensities, like Guinier domains indicating characteristic sizes, breaks in slope or equivalentlymaxima in qnI(q) presentations as done below, power law exponents, or peak positions. It providesaverage values for any characteristic size (aggregates, particles), which is highly trustworthy dueto the averaging over the entire sample in the beam.One interesting and controversial aspect of the Payne effect is that the extent of the smallstrain reinforcement – quantified from the limiting value of G’ below the onset of strain-inducedsoftening (G’0) – decreases with increasing temperature. The magnitude of the Payne effectdiminishes as temperature is increased, and a representative example from the literature can becited for silica-reinforced crosslinked poly(dimethyl siloxane) (PDMS).29 The glass-transitiontemperature of PDMS is about -130 C, yet the Payne effect persists at 80 C, so it is difficult torationalize polymer segmental dynamics (glass transition response) being solely responsible forthe phenomenon,30-31 although the polymer can still be immobilized near the particles surfaces interms of longer-time chain dynamics.323
There are various mechanisms proposed in the literature to explain the thermal weakeningof the Payne effect: (1) an effect from the filler network itself wherein filler-filler interactionsreversibly dissociate with increasing temperature;6,33(2) temperature-dependent slippage /desorption of polymer chains at the filler NP surfaces;7, 34(3) reduced thickness of an immobilizedpolymer layer around NPs (glassy shell) as temperature is increased;35-38and (4) thermalexpansion of the polymer matrix with heating, which increases the distances between fillerparticles, thus lessening the interactions between particles. 39The question remains concerning whether the Payne effect is primarily due to the breakingof a percolated filler network or if it arises mainly from dynamics of polymer chains at the interfacewith the NPs. This present study attempts to resolve this by contrasting strain-dependentviscoelastic results for carbon black reinforced styrene-butadiene rubber (SBR) and CB-filledparaffin oil, with some results presented recently. 40 Two different NP sizes were used, a range ofparticle concentrations was studied, and the influence of temperature on the behavior wasconsidered. The similar values of dynamic storage modulus in the low strain amplitude region(G’0) for particle-filled low molecular weight liquid and filled rubber was demonstrated by Paynefor carbon black filled oil versus butyl rubber, 41 and by Payne and Whittaker for water-clay pastesand clay-filled natural rubber. 42 For the comparison between CB in a polymer matrix and in oil tobe valid, the filler structure in both matrices needs to be as close as possible, which had neverbeen verified before. We have therefore analyzed the microstructure of four representativesamples made of two CB grades in the two matrices using a combination of TEM and SAXS,accompanied by a state-of-the-art quantitative analysis as outlined above, and put them intoperspective with the rheological results.MATERIALS AND METHODSPolymer, carbon black, and mineral oil: The solution styrene-butadiene rubber used was AsahiTufdene 2100R, which has 25 wt.% styrene and with 11% of the butadiene polymerized in 1,2(vinyl) configuration. This polymer microstructure yields a glass-transition temperature of -65 C.The Mooney viscosity is 78 at 100 C for this SBR. Two different grades of carbon black fromCabot Corporation were used: N234 and N550. The paraffin oil was Equate mineral oil.Formulations: Four compositions were studied for each CB type with each matrix material. Themixtures with N234 CB were made using 35, 50, 65, and 80 parts by weight of CB relative to 100parts of either SBR or paraffin oil. The levels of N550 CB used to reinforce SBR and paraffin oilwere 50, 65, 80, and 95 parts, with the higher range studied due to lower surface area and less4
reinforcing nature of N550 compared to N234. Values of filler volume fraction ( ) were calculatedfrom the formulations using density values of 0.87, 0.93, and 1.8 g/cm3 for the oil, SBR, and CB,respectively.Mixing: The carbon black and oil pastes were mixed in 20 g batches at room temperature usinga high-speed centrifugal mixer (SpeedMixer, DAC 150 FVZ)43with the following stepwiseprocedure: 1 minute at 800 rpm, 1 minute at 2200 rpm, and 3 minutes at 3100 rpm. Two batcheswere made for each CB-oil composition, and the two replicates were each split in half and crosscombined through additional mixing for 1 minute at 3100 rpm. The compounds containing CB andSBR were formed by mixing with a C.W. Brabender Instruments Inc. Prep-Mixer series 350internal mixer. Compounds were mixed for 5 minutes at 50 rpm using a starting chambertemperature of 90 C. Note that the styrene-butadiene matrix has not been crosslinked.Rheology: The viscoelastic properties of the oil-CB and SBR-CB mixtures were characterized inoscillatory shear using a MonTech D-RPA 3000 Dynamic Rubber Process Analyzer (RPA). Threetemperatures of 30, 50, and 70 C were used. After loading a sample in the RPA, a hold of 2minutes without deformation was applied before starting a logarithmically-spaced strain amplitudesweep from 0.03% to 45%. The viscosity of the paraffin oil was measured at 25 C using a ModelDV-II Pro Viscometer manufactured by Brookfield Engineering Labs Inc. Rotational speeds of 10,20, 50, and 100 rpm were utilized with two different spindles (31 and 34), and the torque resultswere converted to viscosity data using known relationships for the testing geometries.Structural analysis: Small-angle X-ray scattering was performed on beamline ID0244at theEuropean Synchrotron Radiation Facility (ESRF, Grenoble FR) at a wavelength 1 Å using 3configurations defined by a sample to detector distance D 1 m, 10 m and 30 m, yielding a qrange from 2 10-4 to 0.7 Å-1. The scattering of pure SBR and paraffin oil have been measuredindependently to subtract the matrix contribution, (1 - ) Imatrix, to each filled sample. The carbonblack particle morphologies were investigated at Birla Carbon by transmission electronmicroscopy using an FEI Tecnai F20 TEM operating at 200 kV. Carbon black dispersions on TEMgrids were prepared according to the methodology of ASTM D3849 for dry carbon black samples.RESULTS AND DISCUSSIONThe paraffin oil and high molecular weight styrene-butadiene rubber are very differentmaterials to consider as matrices in composites reinforced by carbon black. Shear viscosityresults indicate a low viscosity of 0.15 Pa.s for the paraffin oil at 25 C, and the viscosity isindependent of shear rate (Newtonian), which means that the oil has zero dynamic storage5
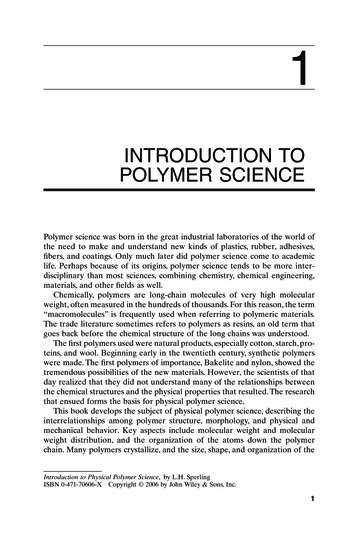
modulus. In contrast, the SBR has a dynamic viscosity ( *) of 6900 Pa.s and a strain-independentstorage modulus of 0.44 MPa from RPA testing at 30 C and 10 Hz. The two carbon black gradesthat were incorporated into the oil-CB and SBR-CB mixtures have different particle sizecharacteristics as summarized in Table 1, 45 with N234 having more reinforcing potential thanN550. This corresponds to specific surface areas of 120 and 41 m²/g for N234 and N550,respectively.45Table 1: Characteristics of CB in two matrices extracted from SAXS dataRNP (nm)(a)Ragg (nm) (a)RLS (nm)(a)RNP (nm)(b) Ragg (nm) (b)SAXSSAXSSAXSTEMTEMN234Oil0.2397.52630010.5 4.533.0 16N234SBR0.2517.125250N550Oil0.23917.07348026.5 1469.5 35N550SBR0.25116.372460(a) SAXS results for primary NP radius R , aggregate radius RNPagg, and large-scale characteristic lateral sizeRLS, with the latter deduced from low-q break in slope;(b) Literature values for RNP and Ragg from transmission electron microscopy for nominally identical CBgrades to those used in our study. 45CBMatrix Adding the CB particles to the paraffin oil transformed the free-flowing liquid into a pastewith a jammed structure that does not creep under its own weight as illustrated in Figure 1. Notethat the time evolution of such CB-loaded pastes has been studied by Jiang et al, 46 in combinationwith electron microscopy and SAXS. They provide evidence, in particular the observation of alow-q upturn, for filler network formation from disconnected aggregates with time close to thepercolation threshold accompanied by an increase in elastic modulus and conductivity. For thepresent purpose, a macroscopic illustration as in Figure 1 of the jammed nature of the paste issufficient.Figure 1. Photographs of CB-oil pastes ( 0.24) to illustrate absence of gravity-driven flow for thematerials at room temperature.6
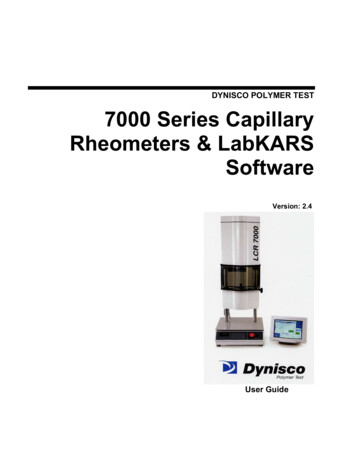
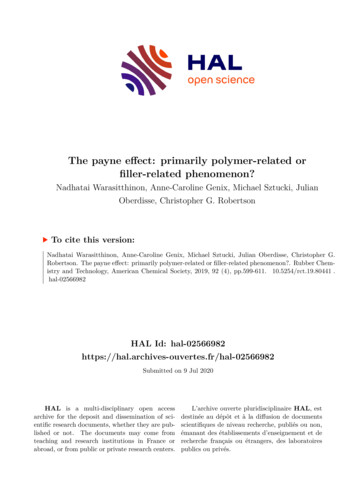
The rheological response at larger strain, however, shows that the oil-material has a tendency toflow, in the sense that the loss modulus exceeds the storage modulus as a function of strain inoscillatory shear experiments, as exemplarily shown in Figure 2a for N234-filled oil. In polymer,the nanocomposite made with the same carbon black presents no indication of flow onset as seenin Figure 2b. The polymer thus contributes to the yield behavior of the material, presumably dueto large-scale connectivity (entanglements, possibly immobilized polymer layers) mediated bylong chains. On the other hand, we will see below that the low-strain behavior of both types ofsamples, oil- and polymer-based, is similar, and in particular the Payne effect exists for bothmatrices.Figure 2. Storage and loss moduli versus strain amplitude at T 30 C and f 10 Hz for N234-filled oil (a)and N234-filled SBR (b). Note the different y-axis scaling in a) and b).Structural analysis of the filler on the nanoscale has been performed by SAXS and TEM.Transmission electron microscopy pictures of the filler NPs have been obtained to characterizethe structure of the primary particles and fused aggregates under dilute conditions. In Figure 3,representative TEM images for the two carbon black grades are shown. The different nanoparticlesize is clearly visible, with high polydispersity, for N234 and N550. Their typical size is compatiblewith the data provided in the literature for these grades (Table 1). On larger scales, these NPsare organized in ill-defined structures as shown in the micrographs (a few hundred nm). The latterare concentrated in the final nanocomposites. As we will see below, an intermediate structurallevel is also present, corresponding to an aggregate containing several tens of primary NPs asillustrated in the right picture.7
Figure 3. TEM pictures of (a) N234 and (b) N550 carbon black primary particles and aggregates obtainedby sonication. Scale bar 0.5 µm. The arrow illustrates structure formation on a larger scale.SAXS experiments allow characterizing the filler and filler network structure within highlyloaded PNCs. Scattering measurements have been performed with the four samples containingeither N234 or N550, in paraffin oil or in styrene-butadiene rubber. The results in absolute unitsare shown in Figure 4a. There is a remarkable agreement in shape between all curves above q 0.01 Å-1, with a slight vertical shift indicating that the N550 nanoparticles are bigger than the N234ones. A quantitative analysis is proposed below. There is even perfect pair-wise superpositionabove 0.2 Å-1, suggesting that the local atomic structure and in particular surface roughness ofthe primary CB particles is the same for both N234 and N550. The differences in the low- tointermediate-q range, between 0.001 and 0.01 Å-1, indicate different aggregate structure, i.e. inthe 100-nm range, for both CBs.The next observation in Figure 4a is that there are two families of curves, associated withthe two matrices. In spite of the close filler volume fractions (ca. 0.24 – 0.25) of all samples, thesamples with a mineral oil matrix display higher intensities. This is caused by the higher X-raycontrast of the CB nanoparticles in oil, which is a general prefactor of the scattered intensity, justlike the volume fraction. One can highlight the structural features by renormalizing the contrast ofthe scattered intensity in oil to the one in SBR. The result of this renormalization is shown in Figure4b. The good superposition of the two curves for each carbon black demonstrates that the generalstructure of the CBs is independent of the matrix type. Without any quantitative analysis ormodeling, one of the main conclusions of this article is thus that the CBs adopt very similarstructures on the nanoscale in oil and SBR.8
Figure 4: SAXS intensities as a function of wave vector q for N234 and N550 CB in oil or SBR. a) Absoluteunits (cm-1). b) Intensities of oil-samples renormalized to corresponding SBR-nanocomposites.The structure of each CB in either oil or SBR can be analyzed quantitatively. In Figure 4b,the high-q scattering follows a power law (q-3.8) which is related to the (identical) surfaceroughness, presumably of fractal nature with surface fractal dimension of 2.2, of the CB 19. Carefuldata treatment of the scattering in this q-range and proposed below reveals the typical size of theprimary particle. Around 0.01 Å-1, the intensity then levels off, and the position in q of this breakin slope is characteristic of the typical aggregate size. Moreover, the intensity level in this zonecan be used to extract the local density of aggregates using a correlation hole analysis developedby some of us. 11, 25 The fact that the curves superimpose for both matrices show again that alsothese local aggregate densities are independent of the matrix type. At low q, finally, the intensitiesincrease strongly, which is reminiscent of a large-scale filler organization. This result is interestingbecause it is often difficult to attribute the low-q upturn in scattering to filler structure, as crazesor bubbles in polymer may result in a similar signature, compromising the observation. Here sucha signal pollution can be ruled out unambiguously, because the same scattering is observed inoil, where such phenomena do not exist. The break in slope observed around 0.001 Å-1 is thus ameasure of a large-scale structure ( /q), presumably the typical lateral size of branches whichwe term RLS. We have determined the characteristic sizes with care reporting the correspondingvalues in Table 1. Focusing on the aggregate radius, Ragg, measurable around 0.01 Å-1, we haveplotted the data in a so-called Kratky presentation, i.e., q2I(q) vs q, as shown in Figure 5.9
Figure 5: Kratky representation of the scattered intensities shown in Figure 4a. Data for N550 in oil andN234 in SBR have been shifted to match their counterpart (N550 in SBR and N234 in oil, respectively) athigh q in order to superimpose scattering of same NPs. An example of fit using the sum of two log-normalfunctions is shown for N550-SBR.The break in slope at intermediate q now becomes a well-identified maximum. The position of thismaximum can be used to estimate the average radius of the aggregates, Ragg. Moreover, anadditional shoulder at higher q is characteristic of the radius RNP of the (polydisperse) primaryparticles. The superposition of the scattering over a large q range (q 2.10-3 Å-1) in Figure 5, fora common filler dispersed in different matrices demonstrates that filler structure is not affected bythe matrix. Both features, NPs and aggregates, can be quantitatively described using the sum oftwo log-normal functions 11 as superimposed in Figure 5. This procedure allows determining bothRagg (deduced from the log-normal position parameter, Ragg /q0) and RNP simultaneously. Allresults are summarized in Table 1.Several conclusions can be drawn from the data in Table 1. First of all, our measurementsof the NP and aggregate characteristics of the CBs correspond to classic literature values forN234 and N550.45Moreover, they agree with the typical sizes observed by TEM, cf. Figure 3.Secondly, the multi-scale structure of the filler stretches from primary NPs of typically 10 – 20 nm(depending on the CB grade65), to aggregates containing probably about twenty NPs andmeasuring typically four to five NP sizes in linear dimension. These aggregates form a large-scalenetwork of characteristic length scale 250 to 500 nm. In both cases, the particle and aggregateradii of a same carbon black, as well as the local aggregate density, coincide closely,10
independently of the matrix. This result confirms the abovementioned model-free conclusion ofvirtually identical structures in both paraffin oil and SBR.We have shown in Figure 1 that the samples do not flow under gravity over periods ofmonths. However, the application of increasing dynamic strain caused the oil-CB materials toprogressively yield, giving Payne effect responses that are similar to CB-filled SBR behavior. Forthe CB grade N234, the corresponding measurements plotted on the same scales are presentedin Figures 6a and 6b for CB in polymer and in oil, respectively. Equivalent results for N550 arereported in Figures 7a and 7b.Figure 6. Strain dependent G’ (Payne effect) at f 10 Hz and different temperatures (T 30, 50 and 70 C)for N234-filled SBR (a) and N234-filled oil (b). Black symbols in a) represent the unfilled SBR matrix.11
Figure 7. Strain dependent G’ (Payne effect) at f 10 Hz and different temperatures (T 30, 50 and 70 C)for N550-filled SBR (a) and N550-filled oil (b). Black symbols in a) represent the unfilled SBR matrix.In Figures 6 and 7, the evolution of the storage modulus is found to depend on the threeexperimental parameters: strain, temperature, and filler content. As a function of strain in polymernanocomposites in Figure 6a (resp. 7a), the well-known softening of the modulus is found,evidencing the Payne effect. One may note that a general statistical mechanics approachmapping the jamming/unjamming transition on an Ising model has been proposed to explain thesoftening, 47 leading to a universal power law prediction as observed in the literature. Our resultsalso display an onset of a high-deformation power law, but it does not give access to a welldefined exponent. For the sake of completeness, it is mentioned that other theoretical approaches12
based on statistical network properties described by a high number of parameters exist.48-49Inthe oil-based materials of Figure 6b (resp. 7b), the Payne effect is also observed, with a wellestablished high-deformation power law of exponent between 0.5 and 1, compatible with modelpredictions.4, 47 A characteristic weakening of the Payne effect in polymer nanocomposites withincreasing temperature is measured in Figures 6a and 7a, whereas in the oil-CB materials, nothermal softening was found in Figures 6b and 7b, except possibly for a minor effect at the highestparticle loading ( 0.28 – 0.31). Therefore, the polymer matrix appears to play a secondary rolein the Payne effect, with the predominant contribution coming from the filler network, and atemperature-dependent part induced by the polymer. In the present case, the comparatively minorpolymer contribution is related to interfacial chain conformations and their dynamics andrelaxation. Also, we have shown in Figure 2 that the polymer matrix impedes extensive strainsoftening that is observed with CB-filled oil. Structurally, it is probable that the stress-carrying fillernetwork breaks under strain, and in oil there are no restoring forces capable of maintainingelasticity, a role the polymer can play. The difference in flow observed in Figure 2 may thus beconnected to the difference in the higher strain region in Figures 6 and 7: the storage modulus ofthe oil-CB pastes dropped to very small values (G’ 0.1 MPa), a phenomenon which is notpresent with the SBR matrix in the same Figure. One may note that the unfilled SBR had G’ G”due to substantial entanglement contributions that were not relaxed at the frequency andtemperatures studied, which explains the viscoelastic differences between oil-CB and SBR-CB inthe higher dynamic strain region. In conclusion, the comparison of Figures 6a and 6b, resp.7aand 7b, demonstrates the strong similarity in the (low strain) Payne effect between CB-oilmaterials, and polymer nanocomposites containing the same filler.Finally, as a function of filler content, the reinforcement effect of increasing modulus with is observed in Figures 6a and 6b for N234, and in Figures 7a and 7b for N550. Moreover, thedependence of the Payne effect on the filler content is easily seen. The order of magnitude of thelimiting (strain-independent) values of G’ in the low dynamic strain region, G’0 G'( 0), is similarfor oil-CB relative to SBR-CB materials when compared at similar carbon black volume fractions,which gives strong support for the idea that stiffness in this region was produced almostexclusively by the network of percolated filler-filler contacts throughout the composites. The lowstrain G’0 versus plots in Figure 8 show the influence of the CB particles on the storage modulusat temperatures of 30 C and 70 C.13
Figure 8. G’0 versus (f 10 Hz, 0.03%) for CB-filled paraffin oil (solid symbols) and CB-filled SBR(empty symbols) at T 30 C (a) and 70 C (b).The low-strain modulus in Figure 8 displays a standard evolution with filler content: first amoderate increase due to hydrodynamic interactions50-51and followed by a strong upturn due topercolation of the filler network. At 70 C, the G’0 values are essentially the same for the oil andSBR systems throughout the whole range of when reinforced by the same type of carbon black,whereas the polymer matrix composites have moderately higher G’0 at the lower temperature of30 C. This illustrates again that there is a temperature-dependent contribution of the polymer tothe Payne effect, while the main part of the mechanical response as illustrated by the generalshape of the curve in Figure 8 is caused by the filler network. The temperature-induced weakeningof the polymeric contribution in the CB-filled materials combined with the absence of weakeningin oil results in a
Payne's influential paper 3 and subsequent contributions to the literature, however, which solidified this hysteretic softening behavior at low dynamic strains as a key viscoelastic signature of filled rubbers. Therefore, the phenomenon is generally called the Payne effect in both academic and industrial communities.