Transcription
INDEPENDENCE LOCAL SCHOOLSIndependence, OhioFive-Year Forecast Assumptions2021-2025 Fiscal YearsNovember 2020BOARD OF EDUCATIONMrs. Lynne Laski, PresidentMrs. Carrie Sears, Vice-PresidentMs. Joan Mencl, MemberMrs. Andrea Marek, MemberMr. Ron Bernstein, MemberMr. Eric Koehler, TreasurerMr. Ben Hegedish, Superintendent1
General ConsiderationsNote 1 – Nature and PurposeThe Independence Local School District's five-year forecast is used as a planning toolthat reflects three years of general operations, historical revenues and expenditures, forfiscal years ending June 30, 2018, 2019, and 2020, as well as a forecast of five additionalfiscal years ending June 30, 2021 through June 30, 2025. The Ohio Administrative Rule3301-92-04 requires the forecast to be approved by the Independence Board of Educationat least twice a year, November and May, and submitted to the Ohio Department ofEducation. It represents a conservative projection of revenue and expenditures for thegeneral operating funds of the district based on current conditions and assumptions.A. Basic Accounting:Independence Local School District maintains its accounts, appropriations and otherfiscal records in accordance with the procedures established and prescribed by the OhioAuditor of State. The district’s receipts and expenditures are compiled on a cash basis,pursuant to accounting procedures prescribed by the State Auditor. This cash basis ofaccounting is a comprehensive basis of accounting other than generally acceptedaccounting principles. The cash basis of accounting involves the measurement of cashand cash equivalents and changes in cash and cash equivalents resulting from cashreceipts and disbursements transactions.B. Fund Accounting:The District uses a system of accounting and financial reporting commonly referred to asfund accounting, which is a common system among government and non-profitorganizations. This system takes the form of a collection of funds, each fund having adistinct purpose, ranging from operating expenses to funding various District functionsand activities. The transactions of each fund are reflected in a self-balancing group ofaccounts, which presents an accounting entity that stands separate from the activitiesreported in other funds. The General Fund is the operating fund of the District and isused to account for all financial resources except for those required to be accounted for inanother fund. The General Fund is available to the District for any purpose provided it isdisbursed or transferred in accordance with Ohio law.Note 2 – Description of the School DistrictA. The Board of Education and Administration:The Board of Education of the Independence Local School District is a political andcorporate body charged with the responsibility of managing and controlling the affairs ofthe district, and is together with the School District, governed by the general laws of theState of Ohio. The Board is comprised of five members elected for overlapping fourcalendar-year terms. The Superintendent of Schools is appointed by the Board for amaximum term of five years, is the executive officer of the School District and hasresponsibility for the entire operation of the School District under policies established bythe board of education. The Treasurer is appointed by the Board for a maximum term of2
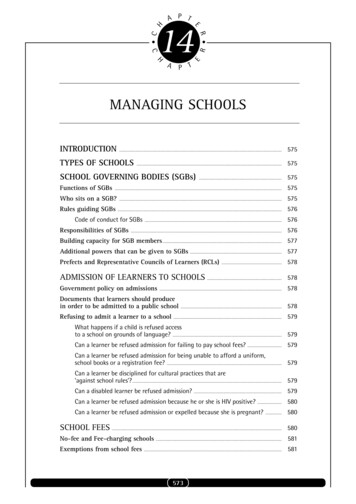
five years, is the fiscal officer of the Board and the School District and has theresponsibility that encompasses the receipts, accounting for and disbursement of all thefunds of the District as required by applicable laws and in accordance with boardregulations and policies.B. The School District and Facilities:The District operates three buildings within the 9.7 square miles of the City ofIndependence. Of which are, one elementary grades Pre-K-4, one middle school grades5-8 and one high school grades 9-12. It is located in Cuyahoga County, approximatelyeight miles south of the City of Cleveland with a population of 7,133.C. District Employees:The District currently employs 90 certified staff of which approximately 88% of theinstructional staff has a master’s degree. They have an average of 16.9 years ofinstructional experience. The average instructional salary is approximately 83,547. Thecertified staff is represented by the Independence Education Association (IEA). There arecurrently 68 full and part-time classified employees who are comprised of secretarialclerical, custodial, maintenance, and transportation. The average hourly rate for theclassified staff is 22.22. They are represented by the Independence ClassifiedEmployees (ICE). The District employs 8 administrators/supervisors, excluding theSuperintendent and Treasurer. Their contracts range from 2-3 years and the averagesalary is 112,957 The District also utilizes the Cuyahoga County Educational ServiceCenter to employ/contract for instructional, non-instructional, and supervisory serviceswhich can vary from year to year depending on need.Note 3 – General AssumptionsA. Enrollment/Average Daily Membership (ADM):Accurate enrollment projections are key to successful school staffing levels, as well asthe potential impact on state funding the District receives. ADM is an abbreviation for theaverage daily membership of students. It is the official measurement that Ohio uses torepresent the number of students in a school district.GradeK123456789101112Total2012 2013 2014 2015 2016 2017 2018 2019 2 1,070 1,053 996 1,009 1,023 1,042 1,031 %-0.78%20218968728575797474100808482701,0320.88%
Note 4 - Potential impacts of COVID-19 and operational considerations:The unknown, due to the COVID-19 pandemic, make it difficult to draw conclusionsabout the potential impact on the school district’s operations both short-and-long-term.The pandemic has the potential to impact the districts property tax and state aid revenuesand all budgetary expenditures. Below are areas we’ll be watching over the next servalmonths for insight and emerging trends that will influence the district’s finances: Local Revenue:o Real Estate Taxes – Impact to collection rates.o BOR/BTA – Increased complains for reductions.o Refunds – Refund to tax payers for decreased values.o Delinquent taxes – Increased delinquent taxes and lower collection rates.o Reduced earnings on investments relative to low interest rates.State Revenue:o State subsidy – Impact of possible reduction of Ohio State budget andpotential impacts for following biennium.o Student wellness aid – Changes as a result of economic conditions.o Casino revenue – Reduction in revenue from casino operations.Federal Revenue:o Title programs – Federal funds being diverted to COVID-19 initiatives.Food service operations:o Reduced revenueo General fund transfers to subsidize food service operation.Employee Benefits:o Medical Insurance – Impact to future rate increases.o STRS/SERS (retirement) – Future employer rate increases related toreduction in investment earnings.o Unemployment Compensation – Increased cost depending on how wagesare handled for employees who are not working.Purchase Services:o Additional cost for on-line professional development – assisting staff withhow to support student instruction online.o Impact to contractual payments for professional services.o Increased costs for solicitor/legal costs – BOE meetings, employeecontractual issues, parent issues, etc.o Increase cost of technology infrastructure related to online instruction.o Potential decrease cost in utilities usages.o Impact future insurance premiums – General property and liability, etc.o Impact to tuition costs, special education placement and charter schools.o Increase communication costs relative to notifications ofstudent/staff/community.4
Supplies & Equipment:o Additional cost relative to cleaning and disinfecting supplies – cleaning ofthe buildings and buses.o Potential reduction in year-end purchases of classroom supplies.o Cost of additional online resources/software.o Impact to contracted agreements for bulk purchases.o Cost of additional printed materials for students.o Additional technology equipment relative to student needs, etc.o Delay of budgeted equipment purchases. Cost Impact of COVID-19 & Operational Considerations:COVID-19 RELATED EXPENDITURES ADJUSTMENTSExpenditure Increases:Expenditure Reductions:HVAC 68,100 (43,000)Utilities FY-20Sanitization & PPE Supplies49,560(50,000)Substitutes FY-20Sanitization Sprayers6,400(35,000) Café Supplies FY-20I-Pride Instructors130,000(15,000)Over Time FY-20P/S Classroom Reduction40,000(15,000)Field Trips FY-20Technology89,700(63,000) Summer help FY-20Food Services Transfer100,000Unemployment10,220Online Instruction 1/2 Semester101,200Legal Services4,770Water Bottle tic Barriers1,295Thermometers620Nurse/Health Services27,500Graduation4,744 652,464Grand Total COVID Expenditure 431,464Total COVID Impact to District: COVID-19 RELATED REVENUE ADJUSTMENTSRevenue Increases:Revenue Reductions:ESSER-Grant 69,161 (210,000)State Funding Fy-20 & 21CRF - Grant52,224(200,000)Interest Earing proj. Yrly.BWC - Dividend 203,460TBDBOR/BTA ComplaintsTBDRefunds to Tax PayersTBDIncreased Delinquency(17,000)Casino Revenue FY-21(50,000)Food Service Revenue(221,000) 324,845 (477,000)Grand Total COVID Revenues: (152,155) 583,6195
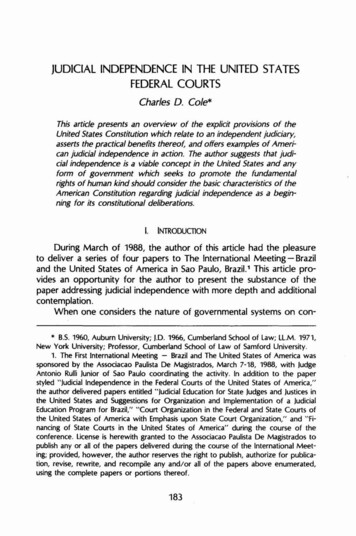
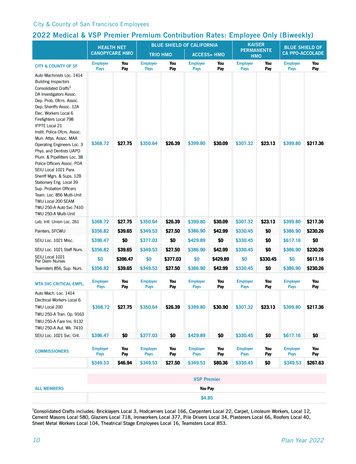
Revenue AssumptionsThe District’s primary sources of revenue are from the levying of property taxes on realand public utility personal property located within the District boundaries, and from theState of Ohio through the state foundation program. The following notes provideinformation with respect to the revenue categories.Note 5 – Property Taxes (Line 1.01 & 1.02)For property taxation purposes, assessment of real property is performed by the CountyAuditor subject to supervision by the State Tax Commissioner, and assessment of publicutility is performed by the State Tax Commissioner. Property taxes and assessments arebilled and collected by County officials.A. Property Valuation:The largest source of income for the District is in real property (land and buildings),which is broken down into two classifications: residential and agricultural (Class I) andindustrial and commercial (Class II). Real property values are adjusted every three yearsthrough reappraisal, a process involving the visual inspections of all property, or triennialupdates which are based on computer analyses of property transactions. 2018 was areappraisal year in Cuyahoga County. 2019 values of residential (class I) valuesincreased 4.5 million, commercial (class II) values increased 1.9 million and publicutility personal property increased 2.3 million. Total 2019 values increasedapproximately 8.7 million. Changes in values are caused by a combination ofreappraisal and updates of inflationary or deflationary movements. The forecast currentlyprojects modest growth in valuation for 2020 and beyond.AgricultureResidentialClass 7,550516,492,314Property Values Tax Year ‐ 20207%36%57%ResidentialClass IIPUPPThe pending COVID-19 may have severe impact on future economics of the district, suchas: BOR/BTA complaints – increase in complaints to decrease real property values. BOR/BTA refunds – increase in refunds to real property owners due to valuationdecreases. Real Estate Taxes – impact to collection rate. Delinquent Taxes –Increased balance and lower collection rate.The district will continue to closely monitor the economic factors impacting the districtand will adjust projections accordingly.6
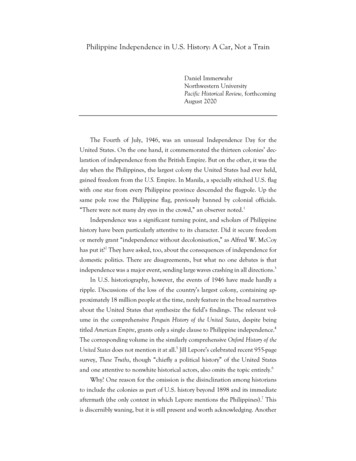
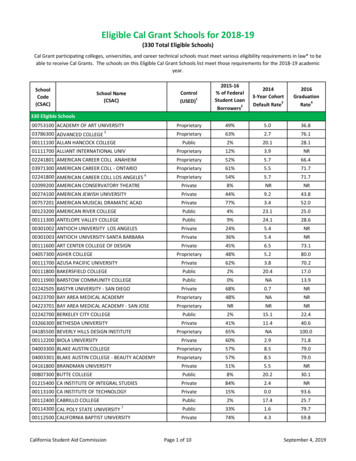
B. Property Assessment Rates:Property taxes are levied and assessed on a calendar year basis; taxes are levied againstall residential, commercial and public utility real and personal property located in theschool district. Assessed values for real property taxes are established by state law at35% of the appraised market value. The utility real property taxes are assessed at 35% oftrue value and the utility personal property taxes are assessed at 25% to 88% (dependingon the type of property) of true value. If property values increase/decrease, the effectivemillage decreases/increases on Outside Millage (voted) respectively. This adjustmentholds the district voted revenue constant in accordance with House Bill 920.The District’s current Class I (fixed rate) effective millage is 13.90 out of a total voted16.05. The combination of inside millage (6.1) and Class I voted (fixed rate) effectivemillage (13.90), results in a current (fixed rate) millage rate of 20.00 for Class Iproperties. The law specifies that the application of the tax reduction factors cannot causea school district’s effective millage rate (inside and outside combined) to fall below 20mills (this is referred to as the 20-mill floor). Upon the combined inside and outside(voted) millage dropping below 20 mills, the Department of Taxation will adjust it backto a minimum of 20 effective mills, at which time any increase in valuation will result inan increase in revenue. The district continuously monitors its effective millage and theeffects on revenue due to reappraisal/updates and/or Board of Revision adjustments andwill adjust projections accordingly.The District’s current Class II effective millage is 14.99 out of a total voted 16.05. Thecombination of Inside millage (6.1) and Class II voted effective millage (14.99) results ina current millage rate of 21.09 for Class II properties. Currently growth in Class IIvaluations results in a revenue increase for only the 6.1 Inside mills. If valuationsincrease enough to drop the District’s combined Inside (6.1) and voted millage (effectivemillage) below 20 mills it would result in revenue growth on both inside and outsidemillage.C. Collection Rates & Splits:Class I (residential) collection rates and splits have historically been very consistent.Collection rate is the net percentage of all available residential taxes owed the district.Independence Class I collection rate has been very stable at approximately 98% and isClass I CollectionsClass II Collectionsprojected to remain at 98%. A collection split isCollection Yr.Actual201498.11% 54.1%92.85%51.2%the percentage of taxes received in the 1st half of201598.08% 54.1%88.78%56.6%the collection year (January – June) vs the 2nd201697.94% 54.2%92.38%53.1%201797.86% 54.4%97.67%58.3%half of the collection year (July – December).201897.82% 58.6%93.18%56.7%201998.40% 53.5%99.00%53.0%Historically the collection split for Class I in202097.95% 54.2%95.31%53.4%Independence has been very predictable atEstimated 202198.0% 54.0%95.8%54.5%approximately 54%. Class II (Commercial)202298.0% 54.0%95.8%54.5%202398.0% 54.0%95.8%54.5%collection rates and splits have historically been202498.0% 54.0%95.8%54.5%very inconsistent and more difficult to predict.202598.0% 54.0%95.8%54.5%The instability of the collection rate has largelyRate:1st Half SplitRate:2nd Half Split7
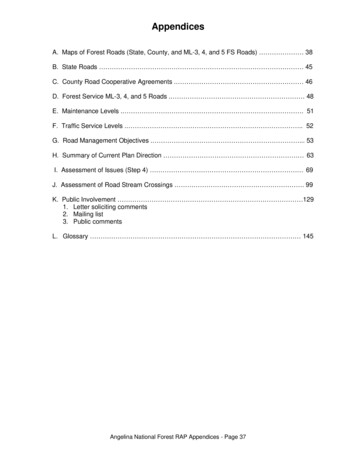
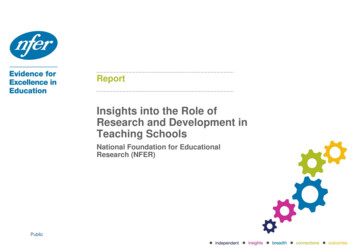
been due to refunds to tax payers from BOR/BTA valuation changes and delinquenttaxes; both of which have appeared to have stabilized and become more predictable.Current forecast projects a 95.8% collection rate and a 1st half collection split of 54.5%.D. Board of Revision and Tax Appeals:Real estate collections are also affected by the amount of refunds owed due to settlementsof property value complaints through the Board of Revision. In the 1ST half of fiscal year2021 the district was assessed real estate tax refunds, to tax payers, of 103,755. Currentlythere are 15 decrease and 19 increasecomplaints filed with the Board ofRevision. The District retains legalcounsel as its representative in taxcomplaints to contest the tax valuationsof the district. The district has beensuccessful in retaining 60%-80% of thecontested values. As a result of thepotential impact to tax collections, theDistrict looks at historical trends andcurrent valuation disputes to forecastfuture real estate collections net of refunds paid. The forecast reflects continued refundsuntil the pending complaints have been resolved.E. Tax Incremental Financing:The District is held harmless from revenue losses in the City of Independence TaxIncrement Financing (TIF) program. The District receives full tax collection upon theimprovement of the qualified properties under the TIF program that are reflected in otherrevenues, line 1.06 of the forecast. During tax year 2018 the District experienced anincrease in the total TIF real property valuation due to a combination of increase invaluation and new construction. TIF valuation is projected to level off. due to reducedgrowth in new commercial and residential construction as a result of the COVID-19pandemic and a downturn in the economy.Actual TY Actual TY Actual TY Actual TY Actual TY Actual TY Estimated TY Estimated TY Estimated TY Estimated TY Estimated TY2014 Taxable 2015 Taxable 2016 Taxable 2017 Taxable 2018 Taxable 2019 Taxable 2020 Taxable 2021 Taxable 2022 Taxable 2023 Taxable 2023 uevaluevalueAssessed Valuation: 55,954,990 53,437,055 51,700,320 54,012,000 80,098,799 81,109,630 82,025,875 82,398,097 82,626,017 82,626,017 82,626,017The district’s TIF revenue has fluctuated over the years due to valuation changes andrefunds to taxpayers from Board of Revision and Board of Tax Appeal decisions orsettlement of complaints. Future TIF revenue is projected to decrease and remain flat as aresult of the district’s emergency levy millage being rolled back by the BudgetCommission and the potential of increased refunds back to tax payers.General FundTIF Revenue:Fy‐2014 Fy‐2015 Fy‐2016 Fy‐2017 Fy‐2018 Fy‐2019 Fy‐2020 Fy‐2021 tualActualActualActualActual Projection Projection Projection Projection Projection 1,871,362 1,699,558 1,278,262 1,785,292 1,882,671 2,891,635 2,757,323 2,409,015 2,422,493 2,500,379 2,503,842 2,503,8428
F. Public Utility Personal Property:Public Utility Personal Property (PUPP) tax revenue is the only revenue source in line1.02 of the forecast. It accounted for 4.9% of the District’s total revenue in fiscal year2020. The District has experienced increases in the valuation of its Public UtilityPersonal Property and projects it to continue throughout the forecast. PUPP valuation hasincreased steadily over the past five years, averaging an increase of 11%. Futurevaluations are projected to increase at a lower average rate of 4.3%.Note 6 – Unrestricted Grant-In-Aid (Line 1.035)Line 1.035 represents the State Basic Aid to schools as defined in the State of Ohio’sbiennial budget bill. The state budget is adopted in odd numbered years and implementedbeginning in even number fiscal years. A new formula for school funding was introducedfor the biennium budget, which then was shelved or put on hold so it could receiveadditional attention and debate. Consequently, the districts base aid was frozen at 612,128. The COVID pandemic forced the state to cut budgets for districts in fiscal year2020 & 2021. The cuts resulted is approximately 210,000 reduction to the Districts statefund for 2020 and 2021. In addition to the base aid the District will receives 40,000 forstudent success in fiscal year 2021. The forecast’s current funding levels are projected toremain flat throughout the forecast due to the uncertainty of the new funding formulaand/or additional cuts.State law dictates that a tax will be levied on Casinos at a rate of 33% of gross casinorevenue, which equates to total betting less payout. Of this tax, 34% is to be distributedto public school districts. Casino revenue is intended to supplement, not supplant, currentState funding. In fiscal year 2020, the District received 57,102 in funding from casinotax revenue. The projection for fiscal year 2021 was reduced to approximately 38 perpupil or 38,000 due to the COVID pandemic. Fiscal years 2022 through 2025 the perpupil casino funding amount is projected to be approximately 52 per student or 55,000per year. The District also receives additional aid for special education transportation andpre-school.The following state aide could be impacted due to COVID-19: State Subsidy – impact of possible reduction of Fy-21 Ohio State budget pluspotential impacts for the following biennium budget. Casino Aid – reduction in revenue from casino operations. Title Programs – impact of federal money diverted to COVID-19 initiatives. Student Wellness Aid – reduction in allocation.The district will continue to closely monitor the economic factors impacting the districtand will adjust projections accordingly.9
Note 7 – Restricted Grants-In-Aid (Line 1.04)Restricted Grants-in-Aid – Funds received through the State Foundation Program or otherallocations that are restricted for specific purposes. Examples include career-technicalfunds, special education catastrophic aide, bus purchase replacement funds and povertybased assistance. The current projection accounts for catastrophic aide subsidy from thestate which helps off-set the cost associated with special need students. Projections forfiscal years 2021-2025 estimate catastrophic subsidies at approximately 50,000 per year.Note 8– Property Tax Allocation (Line 1.05)By law, taxpayers receive certain credits on their tax bill. All residential propertiesreceive a 10% rollback on their gross tax bill. Additionally, if the homeowner occupiesthe residence being taxed, an additional 2.5% reduction is granted. Finally, qualifyinghomeowners (65 years or older and/or disabled) can receive an additional reduction. TheState of Ohio reimburses school districts for these credits. Currently property taxallocation account for approximately 6% of the General fund revenue. New legislationhas been passed that eliminates the reimbursement on all new levies but districts willcontinue to receive reimbursement if the levy is a renewal. Homestead and Rollbackallocations are projected to remain at approximately 1,180,000 throughout the forecast.In fiscal year 2018 the state began the TPP phase-out of the fixed sum reimbursement,which collected 106,000, it will be reduced by approximately 20% per year untileliminated in 2023.Note 9 - All Other Revenues (Line 1.06)Other revenue items include excess cost, payment in-lieu of taxes, interest, fees, buildingrentals, pay to participate, and miscellaneous revenue. It is assumed that class fees andbuilding rental receipts will remain consistent with historical data. Excess cost isdependent on the number of special education students placed inside the district.Payments in-lieu of taxes is based on current settlement agreements with commercial realproperty owners. Total fiscal year 2020 payment-in-lieu of taxes were 985,366 andfiscal year 2021 project total payments in-lieu of taxes to be approximately 583,000. Acontinuance of future settlements is anticipated but not fully forecasted until approvedagreements are in place. The district earned 337,777 in interest in fiscal year 2020 andproject over 175,000 in fiscal year 2021 and continuing to decrease as investmentmature throughout the forecasted years. Due to the current COVID-19 and closure of theeconomy rates have drastically decreased and are projected to remain low. The forecastassumes a conservative amount of other revenues based on current and historicalinformation. The forecast reflects fluctuation and projects all soft money such as rentals,excess cost and all other (non-tax/state) revenue sources conservatively.10
Expenditures AssumptionsNote 10 – Personnel Services – Salaries and Wages (Line 3.01)The personnel service (salaries and wages) expense projection for fiscal year 2021 isbased on staff that is currently under contract for this fiscal year and at the rates of salarythat have been agreed upon in the negotiated contracts. Negotiated agreements are inplace for the Independence Educational Association and the Independence ClassifiedEmployees through July 31, 2021. Included in the forecast are base raises of two percentfor fiscal years 2021. Provisions are made in the forecast for longevity steps, furtheranceof education, and base adjustments in accordance with the negotiated agreements. Fiscalyear 2021 includes the addition 1 FTE of a middle school social study instructor. Fiscalyear 2021 also includes the reclassification of one ESC employees (purchase services)into ILS instructional positions. The COVID pandemic caused an increase of Five FTE infiscal year 2021 for classroom reduction and the operations of the I-Pride DigitalAcademy. Fiscal year 2022 reflects the reduction of 3 FTE instructors.Note 11 – Fringe Benefits (Line 3.02)An employee’s benefit package generally includes retirement contributions, Medicare,workers’ compensation and health insurances. Retirement is based on a 14%contribution of total salaries; Medicare is based on 1.45% of total salaries. The schooldistrict currently participates in a state pool for workers’ compensation and anticipates a48% savings in 2020 premiums.Health care costs for fiscal year 2021 did not increase. Health care costs are projected toincrease 10% per year, throughout the remaining years of the forecast. Thecertified/classified and administrative staff pays 12-15% of the district’s health insurancepremium based on plan design. At the end of fiscal year 2020, the district salary andbenefit package was approximately 81.3% of the total General Fund expenditures, whichincludes Educational Service Center contracted personnel.Note 12 - Purchase Service (Line 3.03)Fiscal years 2021-2025 include varying increases among a multitude of purchasedservices amounts in the General Fund. This line accounts for items such as utilities, legalfees, tuition paid to other districts, professional development, excess costs for students,mileage and travel reimbursements, property insurance, along with instruction andstudents contracted services. The forecast projects an increase in technology services,special education services and utility costs. The increased use of special needscholarships and placement of special need students has purchase services growing at agreat rate as compared to other categories. Fiscal year 2020 and 2021 reflects thereclassification of ESC employees from the purchase service category to the salarycategory in the forecast.11
Note 13 – Supplies (Line 3.04)Expenditures are consistent with the board-approved appropriation measures andsubsequent amendments for fiscal year 2021. This particular expenditure category variesfrom year to year depending on needs. Supply costs are evaluated each year based onneed and educational requirements. These expenses include instructional supplies, officesupplies, cleaning supplies, gasoline for vehicles, consumable products and any productthat has a life expectancy of less than five yearsNote 14 – Capital Outlay (Line 3.05)Capital outlay expenditures consists of building level needs, instructional technology andinfrastructure upgrades for the district. The forecast projects continued expenditures of 240,000 in fiscal year 2021 and 225,000 in fiscal year 2022 and 200,000 a yearthereafter to implement and maintain the district’s equipment demands.Note 15 – Debt Service (Line 4.05 and 4.06)The district has moved debt service of the current House Bill 264 Energy ConservationProgram from the Permanent Improvement Fund (003) to the General Fund (001) inorder to align savings with expenditures. The payment of principal and interest will rangefrom approximately 104,000 to 108,000 within the forecasted years. The debt serviceschedule is until December 2026.Note 16 – Other Expenses (Lines 4.3, 5.01 and 5.02)The main components of other expenses include the County Board of Educationdeductions, liability insurance for the district as well as auditor and treasurer fees for thecollection of tax receipts. Projections for 2021 are based on historical data and currenttrends. The five-year expenditure projections fluctuate due to the biannual auditexpenses and variations in county auditor and treasurer’s fees. The district hasexperienced deficit spending in both the Food Service Fund (006) and Athletic Fund(300) which requires transfers from the General Fund (001) to cover any operatingdeficit. In addition to the transfer for the above deficit spending, the district hasdeveloped a capital improvement plan that requires additional funding; therefore, thedistrict will also transfer from the General fund (001) to the Permanent ImprovementFund (003). The forecast assumes that this trend will continue and budgets accordingly.COVID-19 has caused reduced cafeteria revenues in which has caused an increase for theGeneral Fund to subsidize cafeteria operations.12
INDEPENDENCE LOCAL SCHOOLS Independence, Ohio Five-Year Forecast Assumptions 2021-2025 Fiscal Years November 2020 BOARD OF EDUCATION Mrs. Lynne Laski, President Mrs. Carrie Sears, Vice-President Ms. Joan Mencl, Member Mrs. Andrea Marek, Member Mr. Ron Bernstein, Member Mr. Eric Koehler, Treasurer Mr. Ben Hegedish, Superintendent