Transcription
IECM Technical Documentation UpdatesFinal ReportDE-AC26-04NT41917November 2009Integrated Environmental Control Model - Technical Documentation i
DisclaimerThis report was prepared as an account of work sponsored by an agency of the United StatesGovernment. Neither the United States Government nor any agency thereof, nor any of theiremployees, makes any warranty, express or implied, or assumes any legal liability or responsibility forthe accuracy, completeness, or usefulness of any information, apparatus, product, or process disclosed,or represents that its use would not infringe privately owned rights. Reference therein to any specificcommercial product, process, or service by trade name, trademark, manufacturer, or otherwise does notnecessarily constitute or imply its endorsement, recommendation, or favoring by the United StatesGovernment or any agency thereof. The views and opinions of authors expressed therein do notnecessarily state or reflect those of the United States Government or any agency thereof.Integrated Environmental Control Model - Technical Documentation ii
IECM Technical Documentation UpdatesFinal ReportDE-AC26-04NT41917RDS Subtask 404.01.03:Development and Application of the Integrated Environmental Control ModelPrepared for:Office of Systems, Analyses and PlanningNational Energy Technology LaboratoryDepartment of EnergyPittsburgh, PA 15236www.netl.doe.govPrepared by:Michael B. BerkenpasKaren KietzkeHari MantripragadaSean McCoyEdward S. Rubin (PI)Peter L. VersteegHaibo ZhaiCarnegie Mellon UniversityPittsburgh, PA 15213www.iecm-online.comNovember 2009Integrated Environmental Control Model - Technical Documentation iii
This document brings together the five Technical Reports preparedunder this contract to document enhancements made to the IntegratedEnvironmental Control Model (IECM). Additional documentation of themodel prepared under previous contracts is available at the IECM Website: http://www.iecm-online.com.Table of ContentsVolume I:Wet Cooling Tower ModelVolume II:Air Cooled Condenser ModelVolume III: Plant Water Usage ModelVolume IV: Updates to PC and IGCC Plant ModelsVolume V:CO2 Transport and Storage ModelsIntegrated Environmental Control Model - Technical Documentation iv
IECM Technical Documentation: Volume IWet Cooling TowerDE-AC26-04NT41917November 2009
DisclaimerThis report was prepared as an account of work sponsored by an agency of the United StatesGovernment. Neither the United States Government nor any agency thereof, nor any of theiremployees, makes any warranty, express or implied, or assumes any legal liability or responsibility forthe accuracy, completeness, or usefulness of any information, apparatus, product, or process disclosed,or represents that its use would not infringe privately owned rights. Reference therein to any specificcommercial product, process, or service by trade name, trademark, manufacturer, or otherwise does notnecessarily constitute or imply its endorsement, recommendation, or favoring by the United StatesGovernment or any agency thereof. The views and opinions of authors expressed therein do notnecessarily state or reflect those of the United States Government or any agency thereof.
IECM Technical Documentation: Volume IWet Cooling TowerDE-AC26-04NT41917RDS Subtask 404.01.03:Development and Application of the Integrated Environmental Control ModelPrepared for:Office of Systems, Analyses and PlanningNational Energy Technology LaboratoryDepartment of EnergyPittsburgh, PA 15236www.netl.doe.govPrepared by:Haibo ZhaiMichael B. BerkenpasEdward S. RubinCarnegie Mellon UniversityPittsburgh, PA 15213www.iecm-online.comNovember 2009
Table of ContentsWet Cooling Tower1Nomenclature. 1Abstract . 2Introduction . 3Objectives . 3Performance Model . 4Recirculating Water in Cooling System . 4Water Balance around Wet Cooling Tower. 4Water Evaporation Loss . 5Effect of Meteorology on Evaporation Loss . 7Water Quality Analysis . 9Capital Cost . 10Case Studies . 10Effects of Power Plant Type and Size on Performance and Cost . 12Conclusions . 13References . 14Integrated Environmental Control Model - Technical DocumentationTable of Contents v
List of FiguresFigure 1. Schematic diagram of counterflow wet cooling tower (Threlkeld, 1970) . 6Figure 2. Effect of meteorology on evaporation loss for cooling tower: the effect of monthly air conditions onevaporation loss . 8Figure 3. Effect of meteorology on evaporation loss for cooling tower: the effect of temperature approach on evaporationloss . 8Figure 4. Makeup water consumption for the cooling water system . 12Figure 5. Total absolute value of plant cost for the cooling water system. 13Figure 6. Total normalized plant cost for the cooling water system . 13Integrated Environmental Control Model - Technical DocumentationList of Figures vi
List of TablesTable 1. Water quality analysis for the cooling water system . 9Table 2. Summary for performance of power plant and performance and cost of cooling water systems . 11Integrated Environmental Control Model - Technical DocumentationList of Tables vii
AcknowledgementsThis work is supported by the U.S. Department of Energy under Contract No. DE-AC26-04NT4187 from the NationalEnergy Technology Laboratory (DOE/NETL). Any opinions, findings, and conclusions or recommendations expressedin this material are those of the authors and do not reflect the views of any agency.Integrated Environmental Control Model - Technical DocumentationAcknowledgements viii
Wet Cooling TowerNomenclatureAV surface area of water droplets (sq ft per cu ft)cw specific heat of water, Btu per (lb) (oF)c p,a specific heat at constant pressure of moist air, Btu per (lb of dry air) (oF)Cblowdown concentration of traces in tower blowdown (mg/l)C cs concentration of traces in cooling water (mg/l)C drift concentration of traces in drift loss (mg/l)Cevap concentration of traces in evaporation water (mg/l)C makeup concentration of traces in makeup water (mg/l)CC cycle of concentration for cooling systemCwheat steam cycle heat rejected to the cooling system (Btu/hr)h enthalpy of moist air, Btu per lb of dry airhc convection heat transfer coefficient, Btu per (hr) (sq ft) (oF)hD convection mass transfer coefficient, lbw per (hr) (sq ft) (lbw per lba)hf specific enthalpy of saturated liquid water, Btu per lb; h f ,w evaluated at t whg specific enthalpy of saturated water vapor, Btu per lb; hg , w evaluated at t wh fg , w hg , w - h f ,w , Btu per lbHrs steam cycle heat rate not including auxiliary power requirements (Btu/kWh)Le Lewis number, dimensionlessma mass rate of flow of dry air (tons/hr)mblowdown cooling tower blowdown (tons/hr)m drift cooling tower drift loss (tons/hr)Integrated Environmental Control Model - Technical DocumentationWet Cooling Tower 1
m evap cooling tower evaporation loss (tons/hr)m makeup makeup water for the cooling tower system (tons/hr)mw recirculation cooling water (tons/hr)MWg plant (steam-side) gross electrical output (MW)t dry-bulb temperature of moist (oF)tw temperature of water (oF)t w, i inlet water temperature for cooling tower (oF)t w ,o outlet water temperature for cooling tower (oF)t wet air wet bulb temperature (oF) Tw temperature drop range of cooling water across the condenser (oF)V volume (cu ft)Vcw cooling water flow (gpm)W humidity ratio of moist air, lb of water vapor per lb of dry airWs ,w humidity ratio of saturated moist air at t w , lb of water vapor per lb of dry airW1 tower inlet moist air humidity ratio, lb of water vapor per lb of dry airW2 tower outlet moist air humidity ratio, lb of water vapor per lb of dry airα water-air ratio of flow rate for the cooling water versus tower inlet airη aux heat load for auxiliary equipment as a percentage of condenser rejected heat (%)ε tower performance efficiency (%)MWh megawatt - hoursAbstractThermoelectric power plants require significant quantities of cooling water to support electricity generation. Thelargest design impact of the Clean Water Act, Section 316(b) regulation is to promote the wide use of cooling towersin most new power plants. The principal objective of this study is to systematically evaluate the performance andcost of cooling water systems equipped with wet cooling towers for pulverized coal (PC) and integrated gasificationcombined cycle (IGCC) power plants.The effects of individual components in a PC or IGCC plant on performance and cost of the cooling system areinvestigated. In addition to case studies, this system-level analysis explores a broad range of net plant size for threemajor PC plant types: subcritical, supercritical and ultra-supercritical plants. Average makeup water consumptionusage normalized by net plant size is 565 gallons per MWh, 506 gallons per MWh, and 420 gallons per MWh forsubcritical, supercritical, and ultra-supercritical PC plants, respectively. Total plant costs (TPCs) normalized by netelectricity output range from 54 per kW to 72 per kW for the cooling system in the three types of PC plants. Forthe GE-based IGCC plant, makeup water usage is 265 gallons per MWh and the TPC is 35 per kW, while for theShell-based IGCC case, makeup water required is 327 gallons per MWh and the TPC is 43 per kW. Makeup waterrequired and capital costs of cooling systems are therefore smaller for IGCC plants than those for PC plants.Integrated Environmental Control Model - Technical DocumentationWet Cooling Tower 2
Meteorology affects evaporation loss. The tower evaporation loss shows seasonal patterns. However, evaporationloss estimation for the cooling tower based on annual average air temperatures may well represent overall annualevaporation loss. Because of this importance, normalized makeup water usage is recommended as a key waterconsumption factor in water resource planning for thermal power generation.IntroductionThermoelectric power plants require significant quantities of water for generating electrical energy. Thermoelectricgeneration accounted for approximately 39% of freshwater withdrawals as an industry, ranking only slightly behindagricultural irrigation as the largest source of freshwater withdrawals in the United States in 2000 (Feeley et al.,2006a; NETL, 2007a). Large amount of water in thermoelectric power plants is primarily used for cooling purposein the main steam condenser and auxiliary cooling equipment, standard equipment used to support the generation ofelectricity (Feeley et al., 2008).Surface water is a major supply source of thermoelectric-power water consumption (USGS, 2008). Regulation ofcooling water intake structures, established under the CWA Section 316(b) requires that the location, design,construction and capacity of cooling water intake structures reflect the best technology available for minimizingadverse environmental impact (EPA, 2008). The largest design impact of 316(b) compliance is that most new powerplants will be required to implement closed-loop cooling systems. Because the Clean Water Act (CWA) requires theregulation of water thermal discharge from cooling water systems (EPA, 2008), the current use of the once-throughcooling system may be replaced by a wider use of cooling towers (Feeley et al., 2006a; Feeley et al., 2006b). As partof the cooling system of a power plant, cooling towers are generally used to dissipate large heat loads to theatmosphere and lower the temperature of the recirculating cooling water used for condensers and heat exchangers.Because if its importance, the evaluation on the performance and cost of cooling systems in general and coolingtowers in particular are needed to understand the implications on water resource planning for thermal power plants.The Electric Power Research Institute (EPRI)'s PISCES model was designed to estimate toxic emissions from coalbased power plants to air, water and land (EPRI, 1999). It considers water use in and around major components ofPC power plants. Recently, the U.S. Department of Energy’s (DOE) National Energy Technology Laboratory(NETL) conducted a broad water usage and loss study for integrated gasification combined cycle (IGCC) andpulverized coal (PC) power plants (NETL, 2007b). In this baseline study for fossil energy plants, makeup waterusage and costs were estimated (NETL, 2007c). However, makeup water usage estimates for the cooling system inthe PISCES and NETL studies were both based on the simplified empirical assumption for evaporation water lossesinstead of detailed water-air mass and thermal balance simulation for cooling towers (Bedillion et al., 1997; NETL,2007b; NETL, 2007c). These studies did not sufficiently reflect the impacts of variations for many factors includingwater temperature drop range, boiler type, and air dry and wet bulb temperatures on cooling system performance.The majority of cooling towers utilize freshwater as their makeup water, which has water quality requirements tominimize operating problems such as scaling, corrosion and biological fouling (EPRI, 1982). Makeup watertypically contains soluble minerals and low concentrations of organic compounds, depending on the source waterquality. These constituents control the allowable operating chemical concentration of cooling tower, waterconsumption and wastewater generation (EPRI, 2003). Therefore, performance assessments for the cooling systemshould take into account the inherent relationship between water usage and water quality.ObjectivesThe major objectives of this study are to:1.systematically establish water performance models of cooling systems in coal-based PC and integratedgasification combined-cycle (IGCC) power plants and evaluate water usage and loss issues2.estimate the cooling system costs corresponding to their performance3.address the impacts of some key factors including the effects of power generation technology andmeteorology on cooling system performance and costIntegrated Environmental Control Model - Technical DocumentationWet Cooling Tower 3
The performance and cost models will be incorporated into the Integrated Environmental Control Model (IECM)developed by Carnegie Mellon University for the NETL. The IECM is a computer-modeling program that performssystematic cost and performance analyses of environmental control equipment at coal-fired power plants (Rubin etal., 2007). The addition of cooling water models will enable IECM users to evaluate the performance and cost of apower plant with sensitivity to the presence of the cooling water system.Performance ModelAn evaluation of the performance of a cooling water system begins by determining the flow rate of the recirculatingcooling water, then estimates various water usage and losses based on mass and energy balances, and finally ananalysis of the water quality around the cooling system. Capital costs and annual operation and maintenance (O&M)costs for cooling water systems can then be estimated based on the performance modeling results. The explicitlinking of performance parameters to cost models is an important aspect of the integrated structure of the IECM.Recirculating Water in Cooling SystemA typical power plant contains two important water systems: (1) a recirculating steam cycle system and (2) a coolingwater system. In the PC plant, water in the steam cycle is used to capture heat generated during combustion byconverting water to steam. In the IGCC plant, hot exhaust from a gas turbine is fed to a heat recovery steamgenerator where heat is recovered to generate steam. The high energy steam is transported to the steam turbine,where the latent heat in steam is converted to electrical energy as it passes through. However, not all the latent heatis recoverable, resulting in a low quality steam exiting the steam turbine. This low quality steam must be condensedback into a liquid before being recirculated back to the boiler. This conversion of low quality steam to water is donein the condenser, where the latent heat is taken from the steam and passed to the cooling water system. The heattransferred to the cooling system results in a temperature increase, which must be reduced before being recirculatedback into the condenser.In the condenser, the latent heat of the turbine exhaust steam is transferred to the cooling water. The calculation offlows for the cooling system begins with the heat rejected in the condenser. A lesser amount of heat being rejectedfrom other parts of the power plant by auxiliary equipment is also considered here. For a given type of power plant,the amount of heat that must be rejected to the cooling system, excluding the heat rate of 3413 Btu per kWh used forgenerating electricity, is estimated as (Bedillion et al., 1997):Cwheat ( Hrs 3413) MWg 1000 (1 η aux )whereHrs(1) the steam cycle heat rate, determined by the thermal efficiency of the Rankine cycle1000 converts MW to kWη aux the fraction of the total steam cycle load required for auxiliary coolingConsidering the temperature drop possible across the cooling tower, the recirculating water flow rate for the coolingsystem can now be calculated:mw Cwheat Tw 2000(2)Water Balance around Wet Cooling TowerA majority of the cooling water is recirculated through the cooling tower and back to the condenser. However, waterlosses can occur in three areas: (1) evaporation, (2) drift, and (3) blowdown. The losses are mainly from theevaporation and blowdown.Most of the water losses are due to evaporation of the cooling water itself. In wet cooling towers, water has directcontact with ambient air and cooling is achieved mainly by the evaporation process in which some of the waterIntegrated Environmental Control Model - Technical DocumentationWet Cooling Tower 4
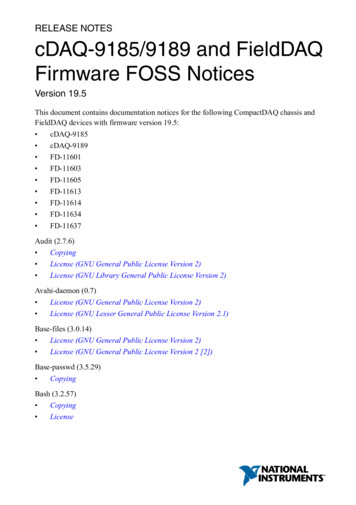
leaves with the air. In case studies performed by NETL, evaporative loss is empirically estimated as 0.8% of thecirculating water flow rate per 10 F of range (NETL, 2007b; NETL, 2007c).Because water evaporated in the cooling tower consists of pure water, the concentration of salts or other impuritieswill increase in the recirculating water. To avoid a high concentration and subsequent scaling of the surface withinthe tower, it is necessary to blow down a portion of the water and replace it with fresh water (Li and Priddy, 1985).Tower blowdown water may be reused in the power plant to sluice bottom ash or fly ash.A relatively small amount of entrained water lost as fine droplets in the air discharge from a tower, which isfrequently referred to as tower drift loss. The drift loss is about 0.001% of the recirculating water (NETL, 2007c).Total water loss depends on the water-cooling range.The cooling tower operation is maintained by making up fresh water at the same rate as the water losses from thetower. Based on water mass balance for the cooling tower, total tower makeup water is:mmakeup mevap mdrift mblowdown(3)All these loss terms may be empirically expressed as a percentage of the recirculating water flow rate. In addition,the amount of chemical components and impurities in the losses is equal to that in the makeup water. The massbalance of chemical traces dissolved in water for the cooling tower is expressed as:mmakeup Cmakeup mevap Cevap mdrift Cdrift mblowdown Cblowdown(4)Since the concentrations of all impurities in the evaporation water are assumed to be zero ( Cevap 0), and theconcentrations of impurities dissolved in drift and blowdown losses are equal to those for the cooling water( Cdrift Cblowdown Ccs ), rearranging Equation (4) above gives:CC CcsCmakeup mmakeupmdrift mblowdown 1 mevap(5)mdrift mblowdownThe term CC is called the cycle of concentration. It is a measure of the number of times water recirculates beforebeing removed from the cooling water as blowdown. From Equation (5), the tower blowdown loss is estimated as:mblowdown mevapCC 1 mdrift(6)As implicated in Equation (6), the evaporation process is the largest source of cooling tower water losses, which isestimated based on the mass and energy balance model described in the next section. The operation at a higher cycleof concentration reduces cooling tower blowdown. However, there is a strict requirement for water quality, and thecomplex makeup water treatment processes may have to be applied, which increases the cost of water use. The cycleof concentration reflects the effect of water quality on makeup water usage, which is determined through waterquality analysis for makeup water.Water Evaporation LossA more detailed tool will be established to accurately estimate evaporation loss, as evaporation is the largest sourceof water loss. A schematic diagram for counter-flow cooling tower is given in Figure 1(Threlkeld, 1970). In acounter-flow cooling tower, air flows upward: opposite to the downward motion of the water. Wet cooling towersmainly rely on the latent heat of water evaporation to exchange heat between the process and the air passing throughthe cooling tower, although there is some sensible heat transfer to the air when the air temperature is low. Watertemperature decreases whereas the moisture content of the air passing through the cooling tower increases. Inpractice, the change range of inlet and outlet water temperatures is generally 10 to 30 F for wet cooling towers(McCabe et al., 2001).A mathematical model based on mass and energy balance has been established for wet cooling towers. Majorassumptions that derive the basic modeling process under steady-flow conditions for a wet counter flow coolingtower are:Integrated Environmental Control Model - Technical DocumentationWet Cooling Tower 5
ignore heat transfer through the walls of the tower constant water and dry air specific heats constant heat and mass transfer coefficients throughout the tower uniform temperature throughout the water stream at any cross-section constant value of Lewis number through the towerWaterAirmw, tw,1,hf,w,1ma, t2,W2,h2mah dhW dW[mw-ma(W2-W)] madWhf,wdVma, h, Wmw-ma(W2-W)Hf,,w dhf,wma, t1,W1,h1[mw-ma(W2-W1)],hFigure 1. Schematic diagram of counterflow wet cooling tower (Threlkeld, 1970)The following equation is based on steady-state energy and mass balances for the differential volume segment(Threlkeld, 1970):ma dh [ mw ma (W2 W )]dh f ,w (ma dW )h f ,w(7)ma dh mw dh f ,w (ma dW )h f ,w(8)or approximatelyAlso, the water energy balance can be written in terms of heat- and mass- transfer coefficient as: mw dh f ,w hc AV dV (t w t ) hD AV dV (Ws ,w W )h fg ,w(9)and the air-side water-vapor mass balance as:ma dW hD AV dV (Ws ,w W )By substitution of Le hchD c p ,a(10)in Equation (9), we can rewrite it as: mw dh f , w hD AV dV [ Le c p ,a (t w t ) (Ws , w W )h fg , w ](11)Combining and rearranging Equations (8), (10) and (11), we get :(t w t )dh Le c p , a hg ,wdWW s,w W(12)Because of (Threlkeld, 1970)Integrated Environmental Control Model - Technical DocumentationWet Cooling Tower 6
hs , w h c p ,a (t w t ) 1061(W s , w W )(13)Equation (12) may then be written as:(hs,w h)dh Le(Ws,w W ) hg ,w 1061LedW()(14)Equation (14) describes the condition line on the psychometric chart for the changes in state of moist air passingthrough the tower. In other words, this equation describes the state of the moist air passing through the tower(Qureshi et al, 2006). When the inlet water temperature, temperature drop range of cooling water, water flow rate,air flow rate or water-air flow ratio, and dry and wet bulb temperature of tower inlet moist air under standardatmosphere pressure are known, the outlet state of the air can be determined. Then, the evaporation loss can becalculated according to the inlet and outlet air humidity, and air flow rate. The solution is iterative with respect tothe air humidity ratio and temperatures.The model starts by locating the state of the inlet air and saturated air in equilibrium with the leaving water. Thequantity of dh/dW is calculated using Equation (14). The enthalpy of inlet air is then increased by a small amount( h ) in the second step. The resulting incremental change in water temperature is estimated as (Threlkeld, 1970;Khan et al., 2001): t w ()(1ma h W h f ,w h W h f ,wα cwmwcw)(15)In the immediate subsequent step, the state of saturated air in equilibrium with water temperature is determined atthis increased water temperature. The procedure is repeated until the water temperature is equal to the water inlettemperature. A computer model has been added to the IECM to perform this procedure. In the model, properties ofair-water vapor mixtures and moist air are calculated using the property equations given by the American Society ofHeating, Refrigerating, and Air-Conditioning Engineers (ASHRAE) (ASHRAE, 1997). In addition, the Lewisnumber is estimated based on the method recommended by Kusuda (Kusuda, 1965; Threlkeld, 1970). Once thehumidity ratio is determined for inlet and outlet air, the evaporation water loss is:mevap ma (W2 W1 )(16)Then, the evaporation loss is expressed as a function of the recirculating cooling water:mevap mwα (W2 W1 )(17)In a brief summary, the evaporation loss can be estimated, given inlet and outlet cooling water temperatures, inlet airdry and wet temperatures, inlet air humidity, the recirculating cooling water and water-air mass flow rate ratio*.Finally, the cooling tower performance efficiency can be expressed as (Ren, 2006):ε t w,i t w,ot w,i t wet 100%(18)Effect of Meteorology on Evaporation LossThe evaporation process is affected by water and air temperatures. The impacts of meteorological conditions onevaporation loss are quantified and evaluated in this section. Local monthly meteorological data from the city ofPittsburgh available from the National Climatic Data Center (NCDC, 2008) is used for these case studies. Themonthly mean air dry and wet bulb temperature are 28.1ºF and 26.3ºF in January, whereas dry and wet bulbtemperatures are 72.5ºF and 65.5ºF in July. The annual average monthly air dry and wet temperatures are 51ºF and46ºF. To investigate the effect of monthly air conditions on evaporation loss, the temperature drop range for thecooling tower will be maintained at 20ºF for all scenarios. Since the air wet bulb temperature is the minimum*A value of 1.0 will be assumed in this study for the air mass flow ratioIntegrated Environmental Control Model - Technical DocumentationWet Cooling Tower 7
temperature that the cooling water leaving from the cooling tower can reach (Threlkeld, 1970), the temperature ofthe cooling water entering the cooling tower is supposed to be 90ºF in order to maintain the same water temperaturedrop range for each monthly scenario.The evaporation loss based on monthly air temperatures is estimated and shown in Figure 2 and Figure 3. As shownin Figure 2, the evaporation loss displays apparent trends that larger loss occurs in summer whereas less loss occursin winter, which is similar to the finding of other study (Levy et al., 2006). Figure 3 shows the sensitivity ofevaporation loss to the temperature approach, defined as the difference between tower outlet water temperature andinlet air wet bulb temperature. Evaporation loss decreases with temperature approach. In summer, the temperatureapproach becomes low and the cooling tower has high performance efficiency resulting in more evaporation.Tower Evaporation Loss (%)401.2300.8200.4100.0Temperature Approach (oF)501.60Jan Feb Mar Apr May Jun Jul Aug Sep Oct Nov DecFigure 2. Effect of meteorology on evaporation loss for cooling tower: the effect of monthly air conditions on evaporation lossTower Evaporat
Volume I: Wet Cooling Tower Model Volume II: Air Cooled Condenser Model Volume III: Plant Water Usage Model Volume IV: Updates to PC and IGCC Plant Models Volume V: CO . The Electric Power Research Institute (EPRI)'s PISCES model was designed to estimate toxic emissions from coal-based power plants to air, water and land (EPRI, 1999). It .