Transcription
IBMJay.ManalotoSubmit IBMSearchProfilesCommunitiesShareAppsWikisThis WikiIBM TRIRIGASearchFollowing ActionsWiki ActionsTRIRIGA Wiki HomeYou are in: IBM TRIRIGA IBM TRIRIGA Application Platform Performance Best Practices for System Performance Troubleshooting and monitoring performanceFacilities Management Troubleshooting and monitoring performanceLike Updated November 17, 2017 by Jay.Manaloto Tags: NoneFacilities MaintenanceEnvironmental & Ener Ener EditAdd tagsPage ActionsReal Estate ManagementCapital Project Manag Manag CAD Integrator-Publis Integrator-Publis IBM TRIRIGA Connect Connect IBM TRIRIGA AnywhereIBM TRIRIGA Applicati Applicati Best Practices for System Performance.9 Troubleshooting and Monitoring PerformanceSupport MatrixHints and TipsInstallingAdmin ConsoleBuilder ToolsConnector for Busin Busin Connector for Esri GISDocument ManagerExtended FormulaGantt SchedulerGlobalizationGroup ObjectLabel ManagerLicensingObject Labels and R R Offlining Back to Table of Contents9 Troubleshooting and Monitoring Performance9.1 Troubleshooting Performance Problems9.1.1 Setting Up a Standalone Application Server for Debugging9.1.2 WebSphere Performance Monitoring Infrastructure (PMI)9.1.3 IBM TRIRIGA Application Platform Logging9.1.4 Displaying Garbage Collection Statistics on the Server9.1.5 Applying the Latest Patches9.2 Performance Problem Determination9.2.1 Problem Determination Techniquesa. Application Serverb. Web Serverc. Database Serverd. Networke. CPUf. Memory9.2.2 Problem Determination Toolsa. IBM TRIRIGA Application Platform Toolsb. Heap Dump, Thread Dump, and Garbage Collection Utilitiesc. Application Profiling Utilitiesd. Database Utilities9.3 Monitoring the System9.3.1 Monitoring Toolsa. Middleware Monitoring Toolsb. System Resource Monitoring Toolsc. Bandwidth Monitoring ToolsOSLCNext PerformanceBest Practices for IntroductionNetwork consider consider System architect architect Operating system system Database server t t Database specific specific Application Serve Serve IBM TRIRIGA tuni tuni TRIRIGA Anywhe Anywhe Troubleshooting Information gathe gathe Performance Probl Probl Performance Analy Analy Workflow Analysis IBM TRIRIGA Appli Appli Performance Consi Consi Understanding you you Database Indexes f f SQL Server Index Performance Degra Degra DB2 Database Sho Sho Platform LoggingPortal and NavigationReportingReserveScheduler Engine (S (S SecuritySSOStylingSystem SizingThe IBM TRIRIGA Application Platform has platform logging features that log many system health statistics. These features andtheir associated data help you troubleshoot and monitor for performance problems.9.1 Troubleshooting Performance ProblemsYou can use these troubleshooting procedures in a development or test environment for performance analysis and debugging.The procedures generally should not be used in a production environment. Use these procedures in a production environmentonly if you cannot isolate the problem in a test environment.9.1.1 Setting Up a Standalone Application Server for DebuggingDebugging SQL or business object problems, and using detailed logging when you reproduce other problems, can generatelarge logs and slow down the system. To work around this situation, you can set up a standalone application server fordebugging. However, if issues that you are investigating cannot be replicated in a test environment, setting up standalone loggingcan provide limited benefit. The standalone application server can be on a separate computer. Using a separate computer letsyou easily stop and start the server to change logging parameters and reproduce problems with a single user.9.1.2 WebSphere Performance Monitoring Infrastructure (PMI)When you tune IBM WebSphere Application Server (WAS) for optimal performance, it is important to understand how the variousruntime and application resources are behaving from a performance perspective. The Performance Monitoring Infrastructure(PMI) provides a comprehensive set of data that explains the runtime and application resource behavior. By using PMI data, theperformance bottlenecks in the application server can be identified and fixed. PMI data can also be used to monitor the health ofthe application server. For more information on using PMI, see Performance Monitoring Infrastructure (PMI).9.1.3 IBM TRIRIGA Application Platform LoggingPlatform logging enables real-time debug-level logging for platform features. For more information on the platform loggingfunctionality, see the 3.4.1 Administrator Console User Guide and the 3.5.3 Administrator Console User Guide.When you select an option and click Apply, debug-level logging starts immediately. When you clear an option and click Apply,debug-level logging stops immediately. Any changes made in this configuration file are in memory. The system reverts tothe log4j.xml configuration settings when the server is restarted.Administrators can roll log files. Click the Roll Log icon or select one of the Roll actions. The system renames the current log filewith the current date and time, and begins entering new messages in a fresh file. You can add your own custom loggingcategories. Add them in the CustomLogCategories.xml configuration file located in the TRIRIGA installation \config\ folder.Performance logging was added to the startup classes. To enable the logger, add the following category to log4j.xml inthe \config\ folder, setting the priority value to either INFO or DEBUG: category name "Startup Duration Log" additivity "false" priority value "[Value]" / !-- Set to DEBUG to enable logging -- appender-ref ref "FILE" / /category The following is an example of the log output for INFO level:2016-06-17 18:23:18,959 INFO [Startup Duration Log](Default Executor-thread-6) TRIRIGAApplication Started in: 33 secondsThe following is an example of the log output for DEBUG level:
TDI2016-06-17 18:23:18,959 DEBUG [Startup Duration Log](Default Executor-thread-6)Web **********************************TRIRIGA Application Initialization ----------------------------------------Release NotesHTTPClientConnectionHandler completed in:.00 secondsMedia LibraryUpgradeScripts completed in:.02 secondsBest PracticesSpringWebInitServlet completed in:.26 secondsUpgradingDispatcherServlet completed in:.00 secondsTroubleshootingBegin StartupServiceManagerServlet- Method 'Upgrade Classes' completed in:.04 secondsUX FrameworkStartupServiceManagerServlet completed in:.06 secondsNew PageWidgetServlet completed in:.00 ---------------------------------IndexTRIRIGA Application started in:.43 ****************************************Trash9.1.4 Displaying Garbage Collection Statistics on the ServerTagsFind a Taganalysis applicationavailability section best practicescad change managementchanges comparecompare revisionscustomizations customizedatabase db2 exchangefind available times gantt chartgantt scheduler groupmemory footprint modificationsmodify object labelobject revisionoperating system oracleperformanceplatformproblem determination reportsreserve reserve performancerevision revisioningsingle sign-on snapshot spaceYou can turn on verbose garbage collection (GC) to find out how the garbage collection routine is functioning on the applicationserver. You can select this setting in WebSphere Application Server (WAS) by using the WAS Administrative Console. Afterlogging into the console, select Servers Server Types WebSphere application servers [server name] Processdefinition Java Virtual Machine. Then select the Verbose garbage collection option. The console or the log file displayshow much time is spent for each garbage collection cycle.Several tools are available to assist with garbage collection analysis, such as the IBM Pattern Modeling and Analysis Tool forJava Garbage Collector and the IBM Support Assistant.9.1.5 Applying the Latest PatchesYou should apply the latest available upgrade, patch, fix pack, or hot fix for your release of TRIRIGA. Upgrades, patches, and hotfixes contain fixes for platform and application issues and often contain features that can improve system performance. Patchesalso contain new features and parameters that can help you to better monitor and debug system performance issues.9.2 Performance Problem DeterminationIf possible, perform load testing during the implementation phase to expose performance problems before you place TRIRIGAinto production. If you have the equipment to perform load testing, you can use load testing after TRIRIGA is in production todetermine if there is any performance impact from patches or from data growth over time. If you encounter problems, see thefollowing tools and techniques to determine any performance problems.sql server sso support systemsystem performance9.2.1 Problem Determination Techniquestags: track customizationstririgatroubleshoot tuningupgrade ux version versioningCloudListMembersa. Application ServerIBM TRIRIGA Application Platform server logs and IBM WebSphere Application Server (WAS) logs must be reviewed for anyerrors. For load-balanced implementations, attention should be paid to the distribution of users across the JVMs. Monitor theJVM memory utilization on the application server by enabling verbose garbage collection.IBM TRIRIGA Application Platform Logs: Log files can be found in the TRIRIGA installation subfolder named \log\. Logfiles are appended with the date they are created. Log files can also be downloaded from the Error Logs manager in theAdministrator Console. You can also roll logs from there. Several tools are available that can help you to analyze some ofthe log files. For more information, see the following section 9.2.2 Problem Determination Tools.server.log: All standard TRIRIGA logging is found in this log file.security.log: All security-related logging, user logins, and admin user changes.ObjectMigration.log: Object Migration (OM) tool logging.performance.log: All performance DEBUG level logging from the platform logging mechanism.systemmetrics.log: Performance monitor information from the Administrator Console.IBM WAS Full Profile Logs:SystemOut.log and SystemErr.log: Application errors and long-running SQL queries are found in these logs.Native system err.log: Verbose garbage collection information is found in this log file if verbosegc is enabled.http plugin.log: Load-balancing issues in a clustered environment can be reviewed in this log file.IBM WAS Configuration: For more information, see the section 6 Application Server Tuning best practices.JVM Heap Sizes: Ensure that the JVM heap size is set adequately and that heap exhaustion does not occur.Thread Pool Sizes: Ensure that thread pool sizes for the Default and the WebContainer thread pools are set toappropriate levels in the IBM WAS Full Profile.b. Web ServerWeb server logs must also be reviewed for errors. View the maximum connections and total connection attempts to see if yourweb server can use as many of the connections as it needs. Compare these numbers to memory and processor usage figures todetermine if a problem is caused by a connection and not by some other component.IBM HTTP Server Logs: On IBM HTTP Server (IHS), the logs of interest are as follows.access.logadmin access.logadmin error.logerror.loghttp plug.logThreadsPerChild: Specifies the number of threads created by each child process. It might be necessary to raisetheThreadsPerChild setting in the IHS httpd.conf configuration file. For more information, see the section 6.4 IBM HTTPServer in the 6 Application Server Tuning best practices.Value for Windows environments: 2400c. Database ServerDatabase server memory and instance memory must also be monitored. Database traces and snapshots can be gathered toassist with tuning issues. For more information, see DB2 Query Tuning and Index Creation and Tuning and Indexing OracleDatabases. Although these documents were originally written for Maximo, the concepts apply equally to TRIRIGA. For moreinformation on Microsoft SQL Server, see the section 5.5 Microsoft SQL Server Database best practices.d. NetworkSometimes, it is necessary to understand the network speed throughput from different client locations. This can be a very hardtask to accomplish in a timely manner if you must involve the network administration team. In the IBM TRIRIGA AdministratorConsole, the Performance Monitor manager has a way to help you test different client locations and compare network speedthroughputs. The network Speed Throughput Test link tests the network speed from the server to the current user desktop. Inthe results, you can see your speed throughput in kilobytes, and then an average comparison with other network structures.The network Speed Throughput Test link can be provided to client end users without the need for a login. Monitoring the bytesper second processed by the network interface card can also give insight to a potential network overload. If you need moredetailed network information to understand bandwidth requirements, there are bandwidth-monitoring tools that provide the abilityto analyze HTTP requests, the number of roundtrips between tiers, and TCP/IP packet information.For more information, see the section 2.1 Network Speed Throughput Test in the 2 Network Considerations best practices.e. CPU
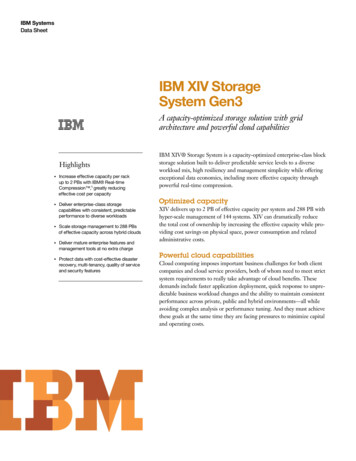
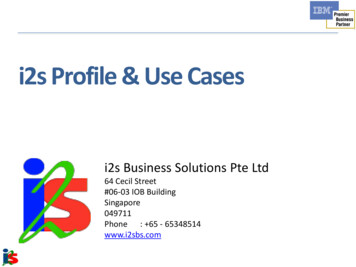
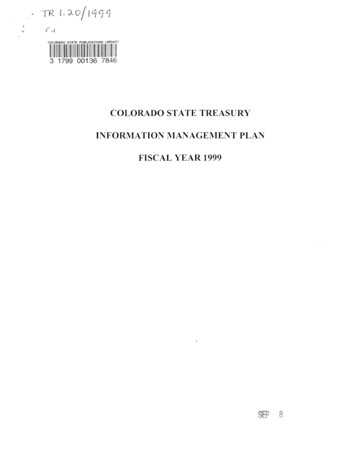
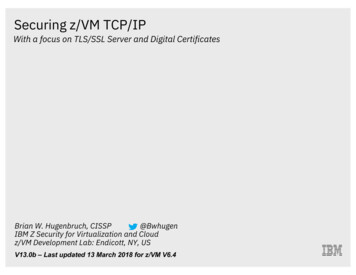
Monitor the CPU to ensure that all processors are being used as expected and that overall CPU utilization remains healthy.f. MemoryBe careful about monitoring total memory usage. For the IBM TRIRIGA Application Platform, JVM heap size is the mostimportant memory metric to monitor on application servers. There are a number of parts to the TRIRIGA platform that, when leftunchecked or poorly configured, can contribute to a large memory footprint on the application and process servers, and cancause the server to get into an "Out of Memory" situation where the TRIRIGA server crashes. For more information, see thesections 6 Application Server Tuning and 7 IBM TRIRIGA Tuning best practices.Memory Footprint Contributors: The following is a non-exclusive list of items that can greatly pressure the heap memoryon the application and process servers:Workflow Instances: When set to ALWAYS, the WF INSTANCE SAVE property consumes a large amount ofmemory on the application server, and slows down the performance of workflows and actions by 3x or more.Workflow instance saving should only be set to ALWAYS if you are actively debugging workflows. Do not setto ALWAYS for longer than what you need.BIRT Reporting: When exporting large data sets in BIRT, the BIRT engine itself will consume a large amount ofheap memory.DataConnect Task: When building a workflow with the DataConnect task, take care in the Transaction section tocommit after a small number of records, no more than 10, but it could be as low as 1. This is a setting you will needto tune depending on the integration.Diagnosing "Out of Memory" Situations: When an "Out of Memory" error occurs, typically the only recourse is to restartthe application and process servers. At the point of the "Out of Memory", a heap dump should be generated.IBM Websphere, Liberty Profile: The heap output file is created in the default directory {server.output.dir}.IBM WebSphere, Full Profile (Traditional): The heap output file is created in the default directory {WAS HOME}/profiles/ {ProfileName}.Oracle WebLogic: The heap output file is created in the directory from which the Java process was launched.Memory Analyzer: After the heap dump is obtained, you can analyze it with the Eclipse Memory Analyzer Tool (MAT) tofind the memory leaks and reduce memory consumption.MAT consumes a very large amount of memory if your heap dump is very large (6GB or more is large). Yourworkstation should have at least 16 GB of RAM, and you should close all other applications and configure theEclipse config.ini file to set its own max heap size to 15 GB (-Xmx15G).The Overview section gives you a high-level insight into what the heap contains. Typically, we see the first- orsecond-level objects begin to explain what consumed the heap. The following are examples of workflowinstanceand BIRT report "Out of Memory" heaps, respectively. In the Problem Suspect section, you can identifythe main area that consumed the heap.Memory Analyzer Workflow Instance "Out of Memory" Heap.Memory Analyzer BIRT Report "Out of Memory" Heap.
9.2.2 Problem Determination ToolsThe following tools can be used to assist in determining any performance problems with your IBM TRIRIGA Application Platform.a. IBM TRIRIGA Application Platform ToolsThe following tools can be used to analyze system performance, workflow performance, and other areas of the platform:Administrator Console: The IBM TRIRIGA Administrator Console provides a collection of administrative tools foranalyzing and optimizing system health and performance.Workflow Analysis Utility: The IBM TRIRIGA Workflow Analysis Utility (WAU) analyzes workflow performance andprocess execution. The utility reads IBM TRIRIGA performance logs and displays performance analytics for workflows,including workflow execution time (how long different workflows take to run), and process flow (the order in whichworkflows ran and what triggered them to run).Performance Analyzer: Introduced in IBM TRIRIGA Application Platform 3.5.3, the Performance Analyzer is a platformtool that helps you to analyze and diagnose issues in system performance. The Performance Analyzer provides a morestreamlined approach to troubleshooting performance issues than the traditional IBM TRIRIGA performance log analysis.The Performance Analyzer helps you to better isolate and analyze the causes of performance issues by generating a logthat is more targeted at the problem area.Performance Log Analysis: This presentation outlines detailed steps on how to enable, process, and analyzeperformance logs for performance issues in the IBM TRIRIGA Application Platform.b. Heap Dump, Thread Dump, and Garbage Collection UtilitiesThe following tools can be used to debug Java code:IBM HeapAnalyzer: Allows the finding of a possible Java heap leak area through its heuristic search engine and analysisof the Java heap dump in Java applications. This tool supports both IBM heap dumps and WebLogic hprof format heapdumps. For information on collecting heap dump files for WAS, see Generating heap dumps manually.IBM Thread and Monitor Dump Analyzer for Java: Analyzes javacore files and diagnoses monitor locks and threadactivities to identify the root cause of hangs, deadlocks, and resource contention, or to monitor bottlenecks. For informationon collecting thread dump files for WAS, see "To force a thread dump" in Web module or application server stopsprocessing requests.IBM Pattern Modeling and Analysis Tool for Java Garbage Collector: Parses verbose GC trace, analyzes Java heapusage, and provides key configurations based on pattern modeling of Java heap usage.IBM Support Assistant: Provides a workbench to help you with problem determination.Eclipse Memory Analyzer Tool (MAT): Helps you to find the memory leaks and reduce memory consumption. MATconsumes a very large amount of memory if your heap dump is very large (6GB or more is large). Your workstation shouldhave at least 16 GB of RAM, and you should close all other applications and configure the Eclipse config.ini file to set itsown max heap size to 15 GB (-Xmx15G). For more information, see the previous section 9.2.1.f Memory.ThreadLogic (java.net site was retired): Analyzes thread dumps produced by WebLogic using the Oracle JDK.c. Application Profiling UtilitiesThe following tools can be used to profile and debug Java code:Health Center: A GUI-based diagnostics tool for monitoring the status of a running Java Virtual Machine (JVM).YourKit: A CPU and memory Java Profiler that supports J2EE/J2ME.OProfile: A system-wide profiler for Linux systems and can profile any running code with low overhead.d. Database UtilitiesEach of the database platforms contains tools to analyze database health, and SQL queries to assist with any long-running SQLstatements. For more information, see your database documentation. Some of the more useful tools include the following:Oracle AWR (Automatic Workload Repository) snapshotsOracle ADDM (Automatic Database Diagnostic Monitor) analysis reportsIBM Data StudioIBM DB2 monitors and snapshotsIBM DB2 Design Advisor (db2advis) and execution plans9.3 Monitoring the SystemThe ongoing monitoring of your system can prevent performance issues from arising in the first place. You should have amonitoring strategy in place before you put TRIRIGA into production.
9.3.1 Monitoring ToolsThe following tools can also be used to monitor your IBM TRIRIGA Application Platform.a. Middleware Monitoring ToolsThe following tools can be used to monitor the middleware components associated with TRIRIGA:Tivoli Performance Viewer (TPV): Enables monitoring of the overall health of WAS from within the AdministrativeConsole.Database Monitoring: Each database platform contains tools that can be used to monitor the database, and to provideuseful information.b. System Resource Monitoring ToolsThe following tools can be used to monitor system resources while performing tests:PerfMon: Gathers performance metrics on Windows-based systems. It is part of Windows and provides access to all ofthe Windows performance counters.nmon: Gathers performance statistics on AIX- or Linux-based systems.nmon for AIX is included with AIX from 5.3 TL09, AIX 6.1 TL02, and Virtual I/O Server (VIOS) 2.1, and is installedby default. nmon for older versions of AIX (classic) can be found on the nmon for AIX wiki.nmon for Linux is released to open source and is available on the nmon for Linux wiki.rstatd: Gathers performance metrics from a UNIX system kernel. rpc.rstatd is shipped with AIX and can be downloadedfor Linux platforms from the rstatd 4 Linux site.sysstat: A package of utilities containing the sar, sadf, iostat, mpstat, and pidstat commands for AIX and for Linux.sar provides system information related to I/O, memory, paging, processes, network, and CPU utilization.sadf formats data collected by sar.iostat gives CPU and I/O data disks and TTY devices.mpstat reports global and per-processor data.pidstat reports process data.vmstat: Reports statistics about kernel threads, virtual memory, disks, traps, and CPU activity on UNIX systems.c. Bandwidth Monitoring ToolsThe following tools can be used to monitor network and HTTP bandwidth while performing tests:Wireshark: A network protocol analyzer that can be used to capture network traffic for bandwidth analysis.WinPcap: A packet capture and filtering engine used by many network protocol analyzers, including Wireshark.HttpWatch: An in-browser HTTP sniffer which logs HTTP and HTTPS traffic, and allows you to inspect the traffic. It can beused to understand the requests and responses between a browser client and a web server for bandwidth analysis.Fiddler: A web debugging proxy which logs all HTTP and HTTPS traffic between your computer and the internet. It allowsyou to inspect the traffic, set breakpoints, and "fiddle" with incoming or outgoing data.Next Comments (0)Versions (5)Attachments (2)AboutThere are no comments.Add a commentFeed for this page Feed for these commentsContactPrivacyTerms of useAccessibilityReport abuseCookie Preferences
The following tools can be used to profile and debug Java code: Health Center : A GUI-based diagnostics tool for monitoring the status of a running Java V irtual Machine (JVM). YourKit : A CPU and memory Java Profiler that supports J2EE/J2ME. OProfile : A system-wide profiler for Linux systems and can profile any running code with low overhead. d .