Transcription
LDC Consolidation: Mining Value forCustomers and ShareholdersAn address to the 7th Annual Ontario Power Summit session entitled“Distribution Consolidation:New Drivers and CEOs Look over the Horizon”May 28, 2008By Max CananziPresident and CEOHorizon Utilities Corporation
LDC Consolidation:Mining Value for Customersand Shareholders1Ontario Power Summit, May 28, 2008Thank you Dave Collie for that kind introduction – It’s a real pleasure to be here today in front of such adistinguished group of industry leaders to share some of my views on this great industry of ours and thedistribution sector of which I am a part.Again, my name is Max Cananzi. I am the President and CEO of Horizon Utilities Corporation.Before I begin, let me express my thanks to the Power Summit organizers, and in particular David McFadden ofGowlings and the staff of Insight Information, for providing this type of forum to share ideas within our industry.1
Outline Horizon’s consolidation experience– Background to 2000 and 2005 mergers Distribution consolidation’s benefit to date– Comparing financials 1997 to 2006 New strategic drivers for consolidation– Regulatory, customer, shareholder, societal Setting a path for consolidation– Transfer Tax rules, Hydro One’s role Mining value for customers and shareholders2As you can see from my outline, I am going to talk about what I believe to be some key distribution sector issues.It is my view that these are the issues that will get the policy train on track for serious LDC consolidation andenable us to get on with the job of strengthening the industry as a whole in this province - setting it on the rightpath.I have 5 main groupings to my slides:First, I want to let you know about Horizon’s consolidation experience by giving you some background to our 2000and 2005 mergers.Second, I want to spend a significant amount of time on distribution consolidation’s benefit to date by comparingfinancials for all MEUs in 1997 with all LDCs in 2006. I think this will be the first forum where this data has everbeen presented comparativelyThird, I want to enumerate what I believe to be the new strategic drivers for consolidation – these are broken downinto the categories of regulatory, technology, customers, shareholder, and societal.Fourth, I want to discuss what is needed for setting a path for consolidation, including the Transfer Tax rules andthe Hydro One role in consolidationAnd, fifth, I want to close out on some points on the possibilities for mining value for customers and shareholdersthrough consolidation.
Horizon Utilities – quick facts Delivers services to residents and businesses inHamilton and St. Catharines 232,000 customers 370 valued employees 419 million in assets Low residential andcommercial rates Low controllable costs Generating full ROE and substantial dividends Excellent safety and reliability performance Focused on growth – partners welcome3Let me first tell you a little bit about Horizon Utilities.We are one of the largest municipal LDCs in Ontario and the largest in the western portion of the Greater GoldenHorseshoe area. We have 232,000 customers, 370 highly valued skilled employees and 419 million in assets.Our customers have the benefit of low residential and commercial rates. Not every LDC can make this claim. Mostonly focus on residential rates, but we have been very attuned to business customers as well.We can have both low residential and commercial rates because we have the lowest controllable costs of anymunicipal LDC in the whole of the Greater Golden Horseshoe.And with this financial strength, we have been earning a full rate of return and delivering substantial dividends forour shareholders.The result is that Horizon not only has an excellent safety record and reliability performance, but it also has beenrecognized by credit rating agencies as a top performer and been given the highest LDC credit rating of any LDCin Ontario.While we are one of Ontario’s largest and best performing LDCs, our objective is to become an even still largerand more financially secure LDC, one that will have a prominent role whatever distribution rationalization mightoccur in Ontario.It is for these reasons that we believe Horizon Utilities has a lot to offer merger partners. We also welcomeacquisitions.3
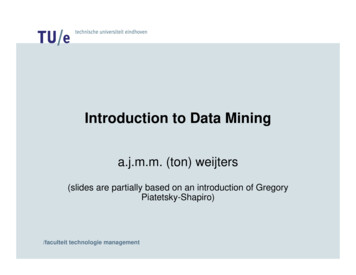
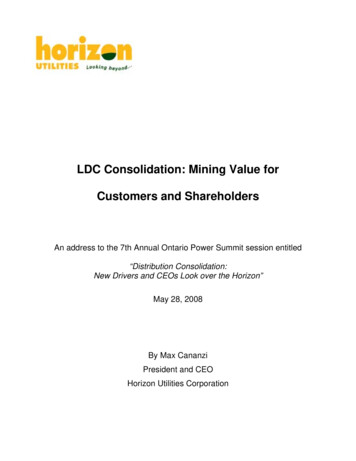
Horizon Utilities – two significant Creek HydroFlamboroughHydro2000City of HamiltonCity of St. Catharines100%2005100%Hamilton Utilities Corp.100%OtherBusiness79%St. Catharines Hydro Inc.21%100%OtherBusinessHorizon Holdings Inc.Horizon Utilities Corp.Horizon EnergyServices Inc. Currently in merger negotiations with Guelph Hydro4Now that I have shed a little light on who we are, let me tell you a little about the mergers that brought Horizon towhere it is today.Horizon Utilities is a municipally-owned local electric distribution company (LDC), just like all the others, but wediffer from many in that we are owned by more than one municipality – the City of Hamilton and the City of St.Catharines.We took the new, non-geographic name of “Horizon Utilities Corporation” to reflect the joint commitment of bothcities to the new company and as an indication we wanted to grow the merger through the inclusion of othershareholders of LDCs.Horizon’s origins are in six separate municipal electric utilities. Its first big merger occurred in 2000 as the result ofthe municipal amalgamation that created a new and expanded City of Hamilton.As part of this process, the five municipal electric utilities in Hamilton, Dundas, Stoney Creek, Ancaster andFlamborough were merged to create the 180,000 customer strong Hamilton Hydro Inc. as one of the largest LDCsin Ontario.The creation of Horizon Utilities in 2005 – our second big merger – resulted from the merger of Hamilton HydroInc. and St. Catharines Hydro Utility Services Inc., the successor to the MEU in St. Catharines.Horizon’s record on merger integration is commendable.·The 2005 merger resulted in 5 million of sustained annual operational savings.·Residential rates actually decreased 2.3% in 2006, were not increased (0%) in 2007, and will decrease again by1% in 2008.·Commercial rates, for their part, have remained among the lowest in Ontario, increasing below inflation.·Shareholders have received recapitalization dividends, repayment of debt notes, and substantial annualdividends.Horizon’s shareholding structure is simple and open. Horizon Utilities Corporation is wholly owned by HorizonHoldings Inc., which is owned 79% by Hamilton Utilities Corporation and 21% owned by St. Catharines Hydro Inc.Other shareholders are welcome.With all the regulatory incentives and benefits for customers and shareholders in mergers and acquisitions, thegrowth of Horizon is continuing. We are actually in the middle of another merger negotiation right now withGuelph Hydro, with the proposal now waiting on the approval of the three municipal councils.And we do not intend on stopping here. We are committed to the vision of creating an exciting, low cost utility thatis responsive to customers’ needs, pays dividends to its shareholders as appropriate, and has the clout to standup for what is right for all of the communities it serves.4
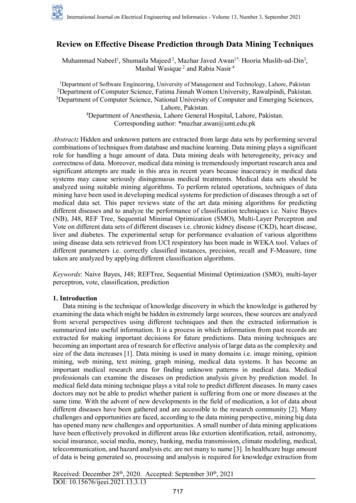
Ontario LDCs – still issues of business scaleand service territory fragmentation5As an industry, we have recognized as progress the fact that there are now only about 83 distributors left inOntario (after a few recent mergers), down from more than 300 back before 2000.What is startling is, as my later slides will show, is how much more consolidation would benefit Ontario.And while scale is an important issue, this map from Hydro One’s website makes it clear the other consolidationissue is service territory fragmentation.
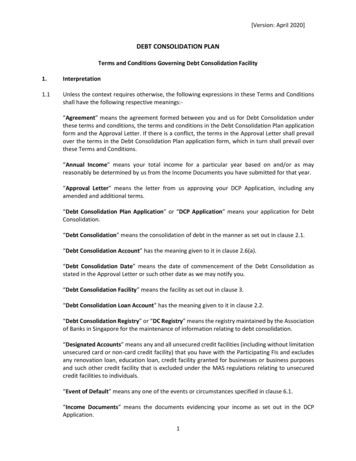
Distribution scale 1997 and 2006Distribution Scale 1997Distribution Scale 2006700,000700,0002006 LDCs1997 LDCs600,000500,000500,000Number of CustomersNumber of 0200,000100,000100,000001100199Number of LDCs2981100199298Number of LDCsSources: MUD (Municipal Utility Data) Bank 1997 (Ontario Hydro) andYearbook of Electricity Distributors 2006 (OEB). NB: For comparison purposes,6Hydro One Networks is excluded from 2006 data throughout because it was not part of 1997 data.I said earlier that I would be showing data that, to my knowledge, has not been presented in any other forum.This slide on distributor scale in 1997 and 2006 – and then next seven after it – are based on a comparison of thelast data collected by Ontario Hydro on municipal electric utilities, known as the MUD Bank (Municipal Utility DataBank), and the OEB’s current offering of the Yearbook of Electricity Distributors.With nine years between the two sets of data, I believe there is a solid ground for comparison of the progress inthe distribution sector here. My one qualification is that it is necessary to leave Hydro One out of the 2006 databecause its predecessor, Ontario Hydro, was not included in the 1997 data.The most startling piece of the scale comparison in 1997 and 2006 is just how flat the curve is in both cases andhow steeply it increases at the end.The curves are so flat because, in 1997, 254 of 305 MEUs had less than 10,000 customers and, today, 32 of 83LDCs still have less than 10,000 customers.Indeed, the two curves both start in the same place – Apple Hill, with 113 customers in 1997 and Newbury Powerwith 192 in 2006.There were actually 208 “micro” MEUs with less than 3,000 customers – more than 2/3rd of them all – and thereare still 10 micro LDCs today.This next fact will surprise you the most. Where there were only seven MEUs with more than 100,000 customersin 1997, there are actually only eight today.The reason is that the biggest got even bigger. Only three LDCs – Hydro One Brampton, Veridian andPowerStream moved into the 100,000-plus customer club.The number of medium sized utilities – those between 10,000 and 100,000 customers has not changed that mucheither. Where there were 44 MEUs in the medium category in 1997, there are now 42 in 2006.The number of small LDCs – greater than 3,000 but less than 10,000 – did go down from 46 in 1997 to 22 in 2006,but together with the 10 micros is still is more than 1/3rd of all LDCs.The result of this all is that average size has moved from 9,800 in 1997 to 42,000 customers in 2006 and themedian size has moved from 1,500 to 14,000 customers (both excluding Hydro One Networks).While we have made a lot of progress, with the average still so low and the median so far below the average, westill have a ways to go.
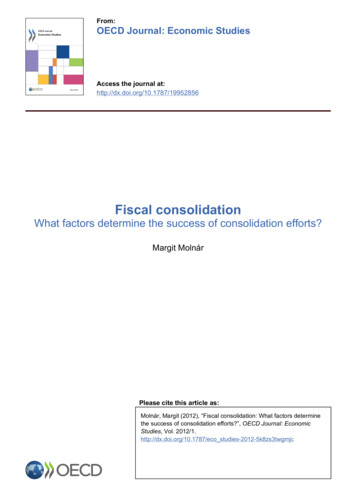
OM&A per customer 1997# of Customers 350.00OM&A/Customer3,00010,000 300.00100,000 250.00 200.00HAMILTON 150.00 100.00ST. CATHARINES 50.003,00010,000100,000 Smallest305 LDCsLargestSource: MUD (Municipal Utility Data) Bank 1997 (Ontario Hydro)7In this slide, I am showing operation, maintenance and administration for all 305 MEUs in 1997, with the X axisshowing the MEUs from smallest to largest and the Y axis showing /customer.The graph does not appear to have any particular pattern, although it does appear to have a funnel effect fromsmallest to largest, where the smallest have the highest and lowest costs in the 75 to 350 range and the largestappear to be bunched together in the 125 to 225 range.
OM&A per customer 2006500*Outlier data not included:Fort Frances - 864Great Lakes Power - 005010,000Smallest100,00083 LDCsLargestSource: Yearbook of Electricity Distributors 2006 (OEB)8The contrast of LDC OM&A in 2006 and MEU OM&A in 1997, however, is quite instructive. Again, the X axis issmallest to largest and the Y axis is -per-customer-per-year. Where the 1997 data did not show a clear pattern ofscale efficiency, the 2006 data shows a clear correlation of scale and lower costs.What is notable in the 2006 data is that the OM&A for LDCs with more than 100,000 customers actuallydecreased 7% over the nine years since 1997 from an average of 193 per customer to 180 per customer.The average of all the other groupings increased, and in some case substantially.·Micro LDCs increased from 170/customer to 291·Small LDCs increased from 163/customer to 282·Medium LDCs increased from 160/customer to 222It is worth noting here that total inflation over the period from 1997 to 2006 was 18% according to the Bank ofCanada.In this circumstance, the decrease of 7% for large LDC is thus in the range of a 25% improvement. Similarly, thismeans the increases among the micro, small and medium LDCs are then all well above inflation, especially for themicro and small LDCs.
O&M per customer 1997Operations & Maintenance/Customer 140.00 120.00 100.00 80.00HAMILTON 60.00ST. CATHARINES 40.00 20.003,00010,000100,000 Smallest305 LDCsLargestSource: MUD (Municipal Utility Data) Bank 1997 (Ontario Hydro)9When operation and maintenance is separated from administration, we get an opportunity to see what is actuallydriving the scale efficiencies – is it O&M or Administration or is it both?Again, the 1997 data does not show a distinct pattern, but the very smallest appear to have the lowest costs, withall other MEUs grouping in the middle of the cost profile.
O&M per customer 2006200*Outlier data included butnot represented:Fort Frances - 302Great Lakes Power - 388Operations & llest100,00083 LDCsLargestSource: Yearbook of Electricity Distributors 2006 (OEB)10By 2006, however, there is a slight but very distinct advantage to scale on O&M.Among the large LDCs, the O&M per customer actually decreased in real terms by 26% from 100 to 74 onaverage per customer, not counting for the 18% inflation.The average of all the other groupings increased, and in some case substantially.·Micro LDCs increased from 53/customer to 89·Small LDCs increased from 70/customer to 92·Medium LDCs increased from 75/customer to 90In this case, then, some scale efficiencies are apparent, especially beyond 100,000 customers.Before I leave this slide, I want to draw your attention to the very low O&M displayed among some of the smallestLDCs, far below 50-per-customer-per-year. While these might be an exception for this one year, it may also beindicative of LDCs that are facing financial difficulty.Without these exceptions, the trend line would be straighter downwards, showing a slight advantage to scale,likely moving from an average of about 100 per customer for micro LDCs to 75 or less for large LDCs.
Administration per customer 1997 300.00Administration/Customer 250.00 200.00 150.00 100.00ST. CATHARINESHAMILTON 50.003,00010,000100,000 Smallest305 LDCsLargestSource: MUD (Municipal Utility Data) Bank 1997 (Ontario Hydro)11When we turn to just administration per customer, the 1997 data is notable in that while top performers are evidentat across the range of scale, the smaller MEUs tended on balance to have higher administration costs.
Administration per customer 2006400*Outlier data includedbut not represented:Fort Frances - n3,00010,000100,00050Smallest83 LDCsLargestSource: Yearbook of Electricity Distributors 2006 (OEB)12What is evident in the 2006 administration per customer data is that it shows a more dramatic effect for scaleefficiencies, as is evident in the trend line’s curve.Where in 1997, as I said on the last slide, there were strong performers across the range of LDCs, in 2006, this ismuch less the case.For instance, when we examine the averages of the groupings, the administration cost per customer at the microend of the spectrum of LDCs increased from an average of 117 in 1997 to 202 in 2006, or 73%.This is in sharp contrast to the large LDCs, where the administration cost per customer increased much less froman average of 93 in 1997 to 106 in 2006, or 14%.The average of all the middle two groupings increased substantially. The small LDCs increased from an averageof 93 per customer in 1997 to 190, or 104%.The medium LDCs increased from an average of 85 per customer to 132, or 55%.
Return on Equity 199715.00%ROE10.00%HAMILTON5.00%0.00%ST. allest305 LDCsLargestSource: MUD (Municipal Utility Data) Bank 1997 (Ontario Hydro)13An examination of Return on Equity is a trickier metric for comparison because the MEUs, which were regulatedby Ontario Hydro, were, in law, not-for-profits.While LDCs are now commercial business permitted to earn a regulated Return on Equity, Ontario Hydro usedworking capital as the effective measure of a not-for-profit operation. If there was an excess of cash, the MEU waseither required to initiate rebates or rate reductions.Like the other data for 1997, there nonetheless appears to be a funnel with a wide range of ROE at the smallerscale and a narrower range at the larger scale.The consequence was that the smaller LDCs would have had the widest fluctuations in performance on a year-toyear basis.
Return on Equity 200625%20%*Outlier data included but notrepresented:Chapleau - (-65.4)Espanola (-47.85)Dutton - (-23.9)Port Colborne - (-35.48)Embrun - (-16.04)ROE (Net 5%Smallest83 LDCsLargestSource: Yearbook of Electricity Distributors 2006 (OEB)14When we turn to the 2006 data, where the LDCs were permitted to earn a 9.88% ROE, there is a distinctcorrelation between LDC scale and return on equity, and it cascades downward as scale diminishes.Among the large LDCs, the ROE average 9.90% in 2006, which is a small fraction over the permitted return. Incontrast,·Medium-sized LDCs had an ROE of 6.60%.·Small-sized LDCs had an ROE of 4.65%.·Micro-sized LDCs had an ROE of negative 7.25%. [note that a number are so far negative they have been left offthe bottom of the graph]Notably, of the 11 current LDCs returning a negative ROE in 2006, the average size was 7,600 customers.
Ontario’s LDC scale and fragmentationA Regulatory ChallengeProvinceLDCs Largest LDCNext Largest LDCs#s(Customers 2006)(Customers 2006)Toronto Hydro (678K)Hydro Ottawa (282K)Horizon (231K)PowerStream (228K)FortisBC (101K)New Westminster (29K)Enmax (458K)FortisAlbta (426K)ATCO (186k)Saskatoon MEU (57K)Swift Current MEUSherbrooke MEUSt. John Energy (35K)Antigonish (3K)8 other MEUsEdmunston MEU5 other MEUsOntario83Hydro One (1.2M)BritishColumbiaAlberta13BC Hydro (1.7M)20Epcor (620K)SaskatchewanManitobaQuebecNew BrunswickNova ScotiaPEINfld. & Lab.31103712SaskPower (441K)Man. Hydro (510K)Hydro Quebec (3.8M)NB Power (370K)NS Power (460K)Maritime Elec. (70K)Nfld. Power (227K)Others/NotesAverage 53KMedian 14K8 others 70K2 MEUs14 rural coopsNfld. & Lab. Hydro (35K)Ontario Data Source: Yearbook of Electricity Distributors 2006 (OEB)15Well, what are we to make of this data? As this next slide show, in fact, no other province in Canada has sofractured a distribution system as Ontario.Indeed, in his recent luncheon speech to the Ontario Electricity Network, OEB Chair Howard Wetston commentedon this challenge for the regulatory workload in Ontario, stating:“Comparisons with other provinces are not always particularly helpful but it may be worth mentioning that the OEB‘rate regulates’ about 83 electricity distribution companies in Ontario. All the other provinces combined ‘rateregulate’ 27.”Ontario is unique, I believe, because municipalization of the distribution sector predated the phenomenon ofvertical integration. And other than municipal amalgamations, there was no mechanism for distributionconsolidation until the passage of the Energy Competition Act in 1998.The result still today, even with all the consolidations since 1998, is a highly fragmented distribution sector wherethe median size LDC is far below the average, and the average is well below the scale in other provinces.To be clear, I am not advocating one distribution company for Ontario, as is the case in some of the otherprovinces.In my view there needs to be continued consolidations until we get to a small number of large distributors that canserve different regional needs. The additional benefit is that benchmarking, as a form of regulation and a proxy forcompetition, can thrive with a small number of large distributors.
Consolidation drivers – customers Customer cost of living / cost of doing business– New generation sources more costlier – gas, renewables,distributed generation, etc.– Transmission build for new generation increases costs– Addition of CDM to “supply mix” puts upward pressure on price– General worsening economic conditions and fuel price pressures Customer cost comparison of LDCs– “Cost allocation” regulatory requirement to remove crosssubsidies will increase interest in comparison of rates– Customers operating in multiple LDCs – Schools EnergyCoalition may be a harbinger of stakeholder interests to come Energy product and service offerings– Customers will look to LDCs to provide products, services, andleadership16This then leads me to the number of drivers for consolidation that, given the existing conditions, may serve tobring additional consolidation.Let me begin with the customer drivers – I have three to note.The first is what I would call the customer’s “cost of living/cost of doing business”.Over the next few years, customers will be facing increased electricity costs for a variety of reasons, including:·more costlier new generation sources from natural gas, renewables, DG, etc.·higher transmission costs resulting from the cost of connecting renewables,·upward pressure on price from adding the costs of CDM to the “supply mix”, and·a general worsening of economic conditions and fuel price pressures.The second customer driver is what I would call cost comparison by customer across LDCs.While most customers currently think that all LDCs have similar rates, and differ only on local service, the rates forLDCs actually differ quite significantly. Some of this is will be attributable to cost management, but most customerswould not be aware of the effect of cross-subsidies between classes of customers.I believe we are already seeing the increased scrutiny of rates and rate comparisons through the interventions ofgroups like Schools Energy Coalition, which may be a harbinger of stakeholder interests to come.The third is the differentiation of LDCs by their energy product and service offerings.Customers will increasingly be looking to LDCs to provide products, services, and leadership, and their ability torespond will be an indication of their strength.
Consolidation drivers – technology LDCs being remade by technology–––––Customer and billing systemsBusiness information and resource planning toolsSystem automation for enhanced reliability“Smart” metersFuture outlook – smart grids New technology offerings – character– High fixed cost / high depreciation – requires constant investment– Increasingly complex – requires constant attention– Pace of change makes it easy to fall behind17The next key driver for consolidation, in my view, will be technology.The most striking thing about how LDCs have changed in recent years is how they are being remade bytechnology.All LDCs have experienced the challenge of establishing new customer information and billing systems to meetthe complex requirements of industry unbundling and customer choice.But this is only the beginning of where information technology is remaking the business. IT is now at a state whereit is advantageous for LDCs to be implementing resource planning tools to effectively manage businessinformation.Technology is also making it possible to enhance system reliability through increased system automation. When“smart meters” are layered on this capability, the future outlook will be one of “smart grids”.I raise these point is the context of consolidation because the character of the new technology offerings is one ofhigh fixed cost and high depreciation. Moreover, it not only requires constant investment, its increasing complexityrequires constant management and attention. The challenge for LDCs is that the pace of change makes it easy tofall behind.
Consolidation drivers – regulatory Performance-based regulation– “Cost-of-service” not sustainable in performance basedregulatory framework– IRM will expose the potential that scale throughconsolidations can offer Regulatory burden– Not what was anticipated as “light-handed” regulation– Significant cost savings due to scale Public information– Uniformity of reporting and compliance better– Truer comparison possible, leading to increased levels ofpublic scrutiny18Following in this theme of consolidation drivers, I want to draw your attention to the regulatory ones, of which I cansee three.The first is “performance-based regulation”. I believe a number of LDCs have been continuing to operate in thecost-of-service mindset, but this will not be sustainable going forward.When the IRM framework (incentive rate making) fully takes hold, I believe scale will be revealed to be a verysignificant consolidation driver, one which is available to save the performance of the LDC. The reason is that the3rd Generation IRM, by seeking to provide long-term sustainability and predictability, may make it difficult for asmall LDC to absorb cost variability.My second regulatory driver is the “regulatory burden” itself. Today, these regulatory costs are substantial andonerous even for large, well resourced LDCs. While some of the requirements are made easier through electronicfilings, full third-party review with interventions by customer and other interest groups, all funded by the LDC asthe applicant, make the process very challenging and requires the assistance of consultants and lawyers.The result is that there are significant cost savings to be found in LDC consolidation – spreading these fixed costsover a large base.My third point on regulatory drivers for consolidation is “public information”. What we are witnessing is amovement, generally, to more uniformity of reporting and a stricter emphasis on compliance. The OEB should beapplauded for assembling the Yearbook and other public data because it makes truer comparisons possible, andleads to better transparency and public scrutiny.In my humble view, the increased availability of public information can only be an asset and its result will be amovement to consolidation.
Consolidation drivers – shareholders Competing uses of shareholder capital– Infrastructure deficit Shareholder return on equity investment– Perception growing that returns not in line with regulatoryrisks being managed– Pressure for full rate of return19The next consolidation driver I would like to address is the interests of shareholders.With the conversion of MEUs as public utilities to LDCs as commercial businesses, municipal shareholders weregiven one of the few avenues available to them to be in a commercial business. Many had an optimistic outlook ontheir financial performance and the positive effect on the municipal balance sheet.Now that there has been almost a decade of commercial experience, the perception appears to be growing thatthe financial returns are not in line with regulatory risks being managed.But even if the full return can be realized, shareholders are beginning to see competing uses for capital, especiallywith the infrastructure deficit that exists in Ontario. And since the local control advantages of direct ownership ofan LDC are narrowed through the framework of third-party regulation by the OEB, the need for continuedownership may increasingly be raised against the competing use of the capital.
Consolidation drivers – societal “Culture of Conservation”– Conservation now a prior consideration to supply decisions– Sophistication in program design and delivery an advantage Sustainable Communities– Community energy management and planning – Local IntegratedResource Planning (LIRP)– “intelligent” distribution network of Conservation, DM, DR, DG Competitive power market– Centralized procurement – a problem searching for a long-termsolution– If OPA is a transitional body, then larger LDCs are an attractivesolution to the problem20The final consolidation driver I would like to address falls under the grouping of what might be called “societal”issues.The one we have become familiar with most recently is the “Culture of Conservation”. The significance of this forthe distribution sector is that conservation is now a prior consideration to supply decisions – in short, we need tobe thinking how to use less before we plan supply to meet demand.If we are to be successful in implementing a conservation culture, it is my view is that we will increasing needsophistication in program design and delivery, and this is something where LDC scale will be important.The next societal driver we face is the phenomenon of “sustainable communities”. While this will have a variety ofimplications, for the distribution sector it means community-based energy planning and management.An LDC would put such Local Integrated Resource Planning into practice through – and I believe this is the not toodistant future – what we might call an “intelligent” distribution network.This is a distribution system that not only manages delivery, but also CDM, demand reduction, and distributedgeneration. These are the types of solutions that will be required to meet the new era of local expectations andlarger, more sophisticated LDCs are a vehicle to help deliver these results.My final societal driver is the desire for the benefits of a competitive power market. I think we can all agree thatcentralized procurement arrived as a temporary solution to market jitters and that it is indeed a problem searchingfor a long-term solution.If the OPA’s role is transitional, if only in procurement, then larger LDCs that can handle LSE responsibilities arean attractive solution to this probl
Third, I want to enumerate what I believe to be the new strategic drivers for consolidation - these are broken down into the categories of regulatory, technology, customers, shareholder, and societal. Fourth, I want to discuss what is needed for setting a path for consolidation, including the Transfer Tax rules and