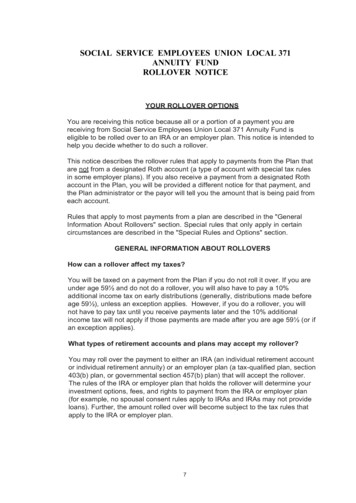
Transcription
Light Vehicle Dynamic RolloverPropensity Phases IV, V, and VIResearch ActivitiesGarrick J. ForkenbrockW. Riley GarrottNHTSA Vehicle Research & Test Center
Overview of NHTSA Rollover ResearchPhase I-APhases Spring 1997Exploratory in naturePhase III-AEmphasized maneuverselection and procedure Spring 2000development Introduction ofPhase I-B“Roll Rate Fall 1997Feedback” Evaluation of test driverPhase III-Bvariability Summer 2000 Introduction of theprogrammable steering Pulse brakemachineautomationPhase II Spring 1998 Evaluation of 12 vehiclesusing maneuversresearched in Phase IDiscussed in thispresentation2Phase IV Spring 2001 Response to TREADAct Consideration of manymaneuversPhase V Spring 2002 Research factors thatmay affect dynamicrollover propensitytests Rollover and handlingrating developmentPhase VI Evaluation of 26vehicles using PhaseIV recommendations
Phase IV BackgroundTREAD Act / Congressional Requirements: Develop dynamic rollover propensity tests tofacilitate a consumer information program Consumer Information methodology released byNovember 2002 National Academy of Sciences Report3
Additional BackgroundIn their assessment of NHTSA’s existingrollover resistance rating system(January, 2002) the National Academyof Sciences recently recommended:“NHTSA should vigorously pursue thedevelopment of dynamic testing tosupplement the information provided bySSF.”4
Additional Background NHTSA is presently providing RolloverResistance Rating Based on vehicle measurements and realworld crash data Vehicle measurement is Static StabilityFactor 5 Star ratings are similar to NCAP CrashRatings5
PullWeightWHcgNo ForceT/2Weight W6Impending RolloverW(T/2) P(Hcg)Pull/W (T/2)/ HcgPull/W SSF
Probability of Rollover per Single Vehicle atic Stability Factor71.41.451.51.551.6
Maneuver Recommendations Alliance of AutomobileManufacturers Consumers Union Ford Motor Company Heitz Automotive, Inc. ISO 3888 Part 2Consortium VW, BMW, Daimler ChryslerPorsche, Mitsubishi MTS Systems Corporation Nissan Motors Toyota Motor Company UMTRI8
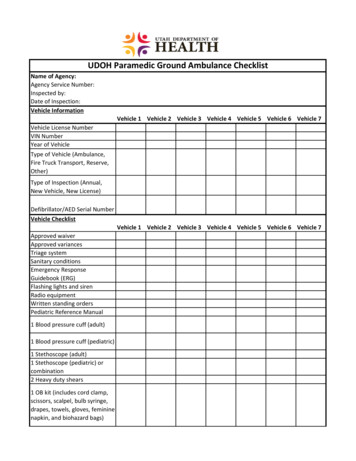
Phase IV Test Conditions
Test Vehicles2001 Chevrolet Blazer 4x2 One star static rollover ratingHigh sales volume2001 Ford Escape 4x4 1999 Mercedes ML320 4x4 “Less aggressive” stabilitycontrol interventionTwo star static rollover ratingFirst SUV with available stabilitycontrol (ESP)10Three star static rolloverratingSmaller, car-like SUV2001 Toyota 4Runner 4x4 “Aggressive” stability controlinterventionTwo star static rollover ratingRelatively high sales volume
Vehicle Configurations Instrumented Fully fueled Front and rear mountedaluminum outriggers Performed with and withoutstability control Multiple configurations Nominal vehicleReduced rollover resistance11
Reduced Rollover Resistance Roof-mounted ballast Designed to reduce SSF by0.05 Increased roll inertia fromNominal condition Escape 8.0 % Blazer 11.5% Longitudinal C.G.preserved Maneuver sensitivity check12Up to 180 lbs
Reduced Rollover Resistance(measurements taken without instrumentation)Escape4Runner 180 lbs ballastC.G. raised 1.3”SSFNOMINAL 1.11 ( )SSFRRR 1.06 ( ) Blazer 120 lbs ballastC.G. raised 1.0”SSFNOMINAL 1.26 ( )SSFRRR 1.21 ( )ML320180 lbs ballastC.G. raised 1.3”SSFNOMINAL 1.04 ( )SSFRRR 0.99 ( ) 180 lbs ballastC.G. raised 1.2”SSFNOMINAL 1.14 ( )SSFRRR 1.09 ( )Note: Nominal SSF differ from those measured without outriggers13
Test Vehicle SSF SummarySSFnom,i 1.27Static Stability Factor (SSF)1.30SSFnom,i 1.181.20SSFnom,i 1.12Baseline1.10Nominal (no instrumentation)SSFnom,i 1.05Nominal (with instrumentation)RRR (no instrumentation)1.000.90Blazer4RunnerML32014Escape
Tires OEM specification (as installedon vehicle when delivered) MakeModelDOT CodeInflation pressureTest surface damagedue to debeading Frequent tire changes Innertubes used during somemaneuvers to prevent debeading Maneuver speed iterationsselected to minimize tire wearwithin a given test series15
Test Surface All tests performed on TRC’s VDA (adry, high-mu asphalt surface) Tests performed 04/01 to 11/01, 02/02 Stable friction coefficients Peakmu: 0.94 to 0.98 Slide mu: 0.81 to 0.8816
Phase IV Maneuver Review
Characterization Maneuvers Used to define NHTSA’s dynamicrollover propensity maneuvers ConstantSpeed, Slowly Increasing Steer Used to characterize transient response PulseSteer Sinusoidal Sweep J-Turn Response Time Tests18
Dynamic Rollover PropensityManeuversAutomated Steering Driver-based SteeringNHTSA J-TurnFixed Timing FishhookRoll Rate FeedbackFishhookNissan FishhookOpen-Loop PseudoDouble Lane Change ISO 3888 Part 2CU Short CourseDriver-based Steering,Computer Corrected 19Ford PCL LC
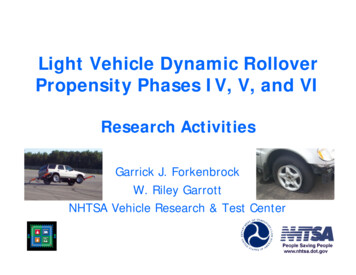
NHTSA J-Turn and FishhooksSteering magnitude basedon vehicle response2. Determine the handwheelangle at 0.3 g from SlowlyIncreasing Steer resultsMultiply by a scalar (derivedwith Phase II data)Steering rate based onsuccessful Phase II testing J-Turn 1000 deg/secFishhook 720 deg/secHandwheel Angle 60.50.4R 2 0.992810.30.20.1actuallinear fit0-0.1050010001500Count Number202500Count NumberLateral Acceleration (g) 20002500
NHTSA nner354ML320310Escape287
NHTSA Fixed Timing )Blazer3264Runner287ML320252Escape233
NHTSA Roll Rate Feedback )Blazer3264Runner287ML320252Escape233
Blazer 570 degreesEscape 505 degrees All rates 1080 deg/sec Response-dependent dwelltimes Iterative Time567801234Time5678Roll Rate (deg/sec)40200-20Handwheel (deg) 0-100-3006004002000-20010.5AY (g) Adjusts timing to maximizeroll motion 270 degree initial steer Vehicle-dependentreversal magnitude (forfishhooks)Handwheel (deg)Nissan Fishhook0-0.5-1
Closed-loop, Path-Following LaneChangesConsumers Union Short CourseISO 3888, Part 2 Course25
Ford PCL LC Comprised of a suite of closed-loop paths(double lane changes) Data is processed to remove driver effectsand facilitate comparison at a constantseverity All vehicles taken to follow the same pathAll vehicles subject to the same lateralacceleration demands Test output is an overall dynamic weighttransfer metric26
Ford PCL LCFull LaneHalf Lane27Lane and a Half
Comments Based on thePhase IV RolloverResistance Maneuvers
NHTSA J-Turn Lowest speed of two-wheel lift is metricUses Programmable Steering ControllerSimple step-steer (one cycle)Handwheel magnitude dependent onvehicle response29
J-Turn with Pulse Braking Lowest speed of two-wheel lift is metric Uses Programmable Braking and SteeringController Addition of Braking Controller makesmaneuver substantially harder to perform Timing of brake pulse dependent on vehicleresponse (Roll Rate Feedback) Results significantly influenced by whethervehicle has working ABS30
Fixed Timing Fishhook Lowest speed of two-wheel lift is metric Dwell time independent of vehicle response Handwheel magnitudes dependent on vehicleresponse Handwheel inputs within ranges establishedduring ISO and CU double lane changetesting Timing may be better for one vehicle thananother31
Roll Rate Feedback Fishhook Lowest speed of two-wheel lift is metric Handwheel magnitudes dependent on vehicleresponse Handwheel inputs within ranges establishedduring ISO and CU double lane change testing Dwell time also dependent on vehicle response Timing should no longer favor one vehicle overanother32
Nissan Fishhook Lowest speed of two-wheel lift is metric Iterative procedure requires additional testingtime Large number of tests required many tirechanges (to reduce tire wear concerns) Reversals are harsh; increases steeringmachine wear33
Ford Path Corrected Limit LaneChange (PCL LC)34
Ford PCL LC Metric Dynamic Weight Transfer at 0.7 g basedon one of four standard paths (DWTM) Method removes driver dependence bynormalizing data Extra tire testing required (tire measurements) Concerns about 0.40 second window used formetric calculation (mitigates dynamic weighttransfer observed) Metric now measured during tests performedwith a driving robot35
ISO 3888 Part 2Double Lane Change Suggested rating metric is maximumachievable “clean” run speed “Clean” run no cones struck/bypassed Test driver generated steering inputs Not as repeatable as programmablesteering controller inputs Tests are straightforward to perform Course adapts to vehicle width36
Consumers Union Short CourseDouble Lane Change Suggested rating metric is maximumachievable “clean” run speed “Clean” run no cones struck/bypassed Test driver generated steering inputs Not as repeatable as programmable steeringcontroller inputs Tests are straightforward to perform Course does not adapt to vehicle size37
Open-Loop Pseudo-Double LaneChange Uses programmable steering controller Having three major steering moves slightlydegrades repeatability Straight-forward to perform Uses programmable steering controller Additional development required38
Reporting of Phase IV FindingsDraft of Phase IV NHTSA TechnicalReport has been written Reviewsin progress Anticipated release late Spring ‘0239
Phase V Research
Phase V Overview Investigate potential use of a centrifuge Improved test equipment Alternative outrigger developmentQuantification of two-wheel lift Resolution of existing matters Cold and hot weather testingSurface effects testing Finalize methodology for Phase VI Loading41
Centrifuge Metric could be lateral acceleration atwheel lift or weight transfer Quasi-static test May be demonstrated by NHTSA using aNASA Facility42
Outrigger Development Compare three designs Reduce effects ofoutrigger installationwithout compromisingdriver safety Existing VRTC Design Use wheel loadtransducers to evaluatedynamic load transfer andcornering forcesNew VRTC Design Aluminum78 lbs per outriggerTitanium68 lbs per outriggerCarr Engineering Carbon fiber58 lbs per outrigger Testing complete43
Carbon Fiber Manufactured by CarrEngineering Light weight (58 lbs) Strong Expensive ( 25k / set)44
Titanium Designed at VRTC usingfinite element analysis Light weight (68 lbs) Less roll inertia thanaluminum or carbon fiber Strong 1/3 cost of carbon fiber 6Al-4V a common Ti alloy Low-mu hemispherical skidpads replace heaviercasters45
Quantification of Two-Wheel Lift Objective methodology required Laser-based height sensors on each wheel Eliminates video data analysis subjectivity46
Cold and Hot Weather Testing Will research the effects of temperatureextremes on dynamic rollover propensity All testing to be performed at TRC Cold weather tests performed during January ‘02 Hot weather tests to be performed Summer ‘0247
Surface Effects Testing Determine effects of different test surfaces ondynamic rollover propensity Testing performed in Arizona DaimlerChrysler Arizona Proving Grounds (APG)GM Desert Proving GroundsPerformed with the Blazer and 4Runner Testing complete Results from Arizona will be compared withthose produced at TRC48
Phase VI
Phase VI Overview Maneuvers based on Phase IV findings Three load conditions Titanium outriggers 26 Vehicles Will include a wide range of make/models forwhich state rollover rate data is available50
One star static rollover rating High sales volume 1999 Mercedes ML320 4x4 "Less aggressive" stability control intervention Two star static rollover rating First SUV with available stability control (ESP) 2001 Ford Escape 4x4 Three star static rollover rating Smaller, car-like SUV 2001 Toyota 4Runner 4x4