Transcription
Statistical BulletinJuly 2021Abstract This report estimates thecost of pure cybercrime to individualsin Australia in 2019. A survey wasadministered to a sample of 11,840adults drawn from two online panels—one using probability sampling and theother non-probability sampling—withthe resulting data weighted to betterreflect the distribution of the widerAustralian population.Thirty-four percent of respondentshad experienced some form of purecybercrime, with 14 percent beingvictimised in the last 12 months. Thisis equivalent to nearly 6.7 millionAustralian adults having ever beenthe victim of pure cybercrime, and2.8 million Australians beingvictimised in the past year.Drawing on these populationestimates, the total economic impactof pure cybercrime in 2019 wasapproximately 3.5b. Thisencompasses 1.9b in money directlylost by victims, 597m spent dealingwith the consequences ofvictimisation, and 1.4b spent onprevention costs. Victimsrecovered 389m.34Estimating the cost ofpure cybercrime toAustralian individualsCoen Teunissen, Isabella Voce and Russell G SmithCybercrime is a growing, borderless and continuallyevolving body of crimes which can threaten individuals,businesses, government and national security. Concernsabout the economic impact of cybercrime have continuedto grow as society becomes increasingly reliant upontechnology and thus increasingly vulnerable to cybercrime.In 2019, a global cybercrime survey of 10,063 adults in10 countries (NortonLifeLock 2020) showed that over athird of respondents experienced a cybercrime of somekind between 2018 and 2019. In Australia, 57 percent ofrespondents indicated they had ever been a cybercrimevictim, with 33 percent indicating they had been victimisedin the previous 12 months (NortonLifeLock 2020).This report describes the methodology and findings of astudy estimating the cost of pure cybercrime to individualsin Australia in 2019. It is imperative that the financial harmsassociated with cybercrime are assessed so that resourcesfor prevention and response activities can be targeted mosteffectively, and a baseline can be developed against which tomeasure the impact of future policy responses.
Australian Institute of CriminologyStatistical Bulletin 34Defining cybercrimeCybercrime encompasses a range of crime types (Anderson et al. 2019). Cyber-dependent crimesare those that can only be committed using information and communications technologies (McGuire& Dowling 2013). These activities—such as hacking, spreading viruses and other malware, anddistributed denial-of-service attacks—are considered to be ‘pure cybercrimes’. They are primarilydirected against machines and networks.In contrast, cyber-enabled crimes are traditional crimes which could be committed without usingcomputers, computer networks or other technology but which employ these methods to increasetheir scale or reach (Furnell & Dowling 2019). Cyber-enabled offences are crimes using the machine—such as identity theft, fraud, stalking and harassment—in which technology makes conventionalcrimes easier to commit and with a lower risk of detection.Pure cybercrime is the focus of the present study. The main forms of pure cybercrime involveillicit intrusions into computer networks (eg hacking), and the disruption or downgrading ofcomputer functionality and network space (eg viruses and distributed denial-of-service attacks; HMGovernment 2016; McGuire & Dowling 2013). These acts can result in disruption to networks andbusiness operations, the loss of important data and serious financial consequences (Australian CyberSecurity Centre 2021). They may lead to secondary crimes, such as when data gathered by hackinginto an email account is subsequently used to commit fraud (Furnell & Dowling 2019).Costs of pure cybercrimeThere remains limited evidence of the financial costs of pure cybercrime to individuals in Australia(see, for example, Bergmann et al. 2018). However, international estimates of the total cost ofcybercrime are frequently produced by cybersecurity organisations. For example, in November2020, one cybersecurity company estimated that global cybercrime costs will grow by 15 percentper year over the next five years, reaching US 10.5t annually by 2025, up from US 3t in 2015 (Cision2020). Country-specific estimates tend to be much smaller in relative terms. The Home Office (2018)estimated the cost of cybercrime in the United Kingdom—based on prevention, property loss andresponse costs—was 1.1b in the 2015–16 financial year.Conversely, there is better evidence of the costs of cyber-enabled crime. For example, the AustralianCyber Security Centre (2020) received approximately 144 reports of cybercrime relating to smallbusiness per day in 2019, costing small businesses an estimated 300m per year, but it is unclearwhich types of cybercrime were included in the cost estimates. Research conducted by the AustralianInstitute of Criminology (AIC) estimated that the total direct costs of identity crime to Commonwealthentities, state and territory agencies (including police), individuals and businesses in Australia were 3.1b in 2018–19 (most of which, but not all, was a consequence of cyber-enabled identity crime;Smith & Franks 2020). The Australian Competition and Consumer Commission (2020) found thatAustralians reported losing over 634m to scams in 2019, which likely under-estimates the trueextent of economic harm due to the well-known under-reporting of all forms of cybercrime. In theUnited States, the Federal Bureau of Investigation’s Internet Crime Complaint Center (2020, 2019)estimated the total losses from cyber-enabled crime to be US 3.5b in 2019 and US 4.2b in 2020.2
Australian Institute of CriminologyStatistical Bulletin 34In one of the few estimates of pure cybercrime available for Australia, Smith (2018) estimated thecost of pure cybercrime by serious and organised crime groups to be up to A 937m in 2016–17. Thisincluded the costs associated with hacking, malware/ransomware, denial-of-service attacks, businessemail compromise and remote access intrusion. It was a conservative estimate due to efforts to avoidthe double-counting of costs counted in other crime categories.The current studyThis study aimed to measure the prevalence of pure cybercrime and associated costs among Australianusers of digital devices. The study used a large sample of adult Australians, representing one of the firstattempts to assess how individual users of digital devices are economically affected by pure cybercrime.MethodDefining pure cybercrimeThe current study categorised pure cybercrime into three broad types: computer access crimes (CAC)—getting into a computer network or device without permissionto obtain information or data. Victims may discover that another person has gained access totheir digital device without their permission and has added, removed or made use of informationor data, such as credit card numbers, a document, photos or video files or taken personalidentity information for illegal purposes. Computer access crimes do not include the acquisitionand misuse of credit card information simply through theft, misuse of a card during a normaltransaction, nor when a victim is scammed into freely disclosing information; computer disruption crimes (CDC)—the disruption of computer or network resource operations.Signs that an individual’s device has been attacked include the device not working properly orceasing to work completely, slowed data processing, unusual messages appearing on the device,or the owner being blocked from using the device or being unable to access files because theyhave been encrypted. These attacks may be accompanied by a ransom message demandingpayment to restore the system or decrypt the data; and computer malfunction crimes (CMC)—when users are uncertain if they have experienced acomputer access crime or a computer disruption crime, but have experienced a computermalfunction affecting the operation of their devices, networks or information and they believethis was caused by criminally-motivated people.An individual was considered to have experienced one of these three types of pure cybercrime whenthey first became aware of a problem or symptom of victimisation. This awareness can come in theform of a notification from a service provider or automated computer scanning software, or becausethe victim has observed the problems themselves. Instances where cybersecurity software simplydetected a virus or other problem and prevented it from harming a device were excluded.This survey did not look at problems associated with using devices caused by user error, or problemscaused by manufacturers of devices or software. For example, respondents were asked not to includeinstances in which a device stopped working because the user failed to renew a contract, or problemsthat developed after a device was dropped or otherwise damaged physically.3
Australian Institute of CriminologyStatistical Bulletin 34This research focused on individual victims of pure cybercrime, excluding victimisation of corporateentities and businesses. Respondents were not asked about attacks on devices that were used solelyfor business or work purposes, nor attacks on digital devices and systems used in vehicles, for energysupply or other monitoring devices at their residence. In cases where a respondent’s device was usedfor both business purposes and personal use, costing estimates were limited to those associated withvictimisation through personal use.SurveyThe survey instrument was administered online and comprised 30 open and closed-choice questions.It took respondents approximately 10–15 minutes to complete if they had experienced one of thetypes of pure cybercrime examined. The questionnaire asked participants to report experiences ofCAC, CDC and CMC that had occurred at any time in the past, and during the preceding 12 months(between June 2018 and May 2019). Data were collected between 6 and 19 May 2019.Respondents were asked about the extent to which they used various digital devices, whetherthey owned these devices, the costs of the devices, their knowledge of and ability to use digitaltechnologies, their experience of the three types of cybercrime and associated financial losses.SampleThe Social Research Centre (SRC) and i-Link Research Solutions were engaged to undertake the surveyusing their respective platforms, before the two samples were combined.i-Link Research Solutions hosts a panel of over 250,000 Australians who voluntarily participate inresearch projects and surveys in exchange for incentives such as reward points and entry into cashprize draws. The AIC engaged i-Link to provide a large sample of Australians to participate in thepresent survey. The sample obtained was a non-probability sample of 10,002 participants from acrossAustralia aged 18 years and over (with a maximum age of 96 observed in the panel). Participantscompleted the survey online and i-Link offered several incentives.The SRC hosts the Life in Australia (LinA) survey, which uses random probability-based methods tosample both online and offline populations. Participants in the LinA panel were recruited randomlythrough their landline or mobile phone, and a dual-frame random digit dialling sample design wasemployed to facilitate their recruitment. A 30:70 split was present between those who were recruitedvia a landline and a mobile phone. For the landline sample, only one member per household wasinvited to join the panel, and for the mobile sample the person who answered became the selectedrespondent. Members of the LinA panel were Australian residents aged 18 years or over, with a totalof 2,672 active members being invited to take part in the survey, of whom 1,838 (68.8%) completedthe survey. The average duration of the survey was 12 minutes for pure cybercrime victims andfive minutes for non-victims. Respondents were provided with a 10 gift card or charitable donationfor their participation in the survey.The SRC initially weighted the LinA sample to population benchmarks using Australian demographicstatistics from the Australian Bureau of Statistics (ABS). The SRC assigned pseudo-weights to thenon-probability dataset using several variables: self-perception of sociability, how often you look forinformation over the internet, self-assessed ability to use digital devices, age group, highest level4
Australian Institute of CriminologyStatistical Bulletin 34of education, concession card holder status and volunteer status. Information on these additionalvariables was derived from a set of benchmark questions that selected members of the two panelswere asked.The SRC then used proprietary calibration and statistical models to blend the results from the nonprobability sample obtained from i-Link participants and the probability sample obtained from theLinA participants. Data were re-weighted to match the same population benchmarks from the ABS,obtaining a total sample size of 11,840. This methodology reduced the bias arising from the use of anon-probability sample. The benefit of this approach is that it allows for a larger online sample thanwould be possible using only probability sampling, which provides opportunities for more detailedanalysis, while the application of proprietary calibration allows for results from the sample to beextrapolated to the wider Australian population.Data blending and extrapolationTo extrapolate findings to the wider Australian population, the data obtained from this weightedsample were applied to the Australian Bureau of Statistics demographic statistics for 2019 (ABS 2019).For example, the total losses occurring in Australia were estimated by obtaining a total observed lossfrom the weighted sample, dividing by the entire sample size and then multiplying by the number ofAustralians aged 18 years or over based on the ABS data for 2019.This method was chosen over obtaining individual means or medians and applying these toproportions of the wider population due to large variations in mean size, but also due toinconsistencies in the results where those who experienced losses or recoveries could not recall theexact figures, and large proportions of individuals who reported experiencing multiple crime types.Costing methodologyFour types of costs were included in the analysis, which only included money lost or spent in theyear 2019: money directly lost—the amount of money taken from victims as a result of CAC, CMC and/or CDCthat they experienced during the last 12 months; money spent on consequences—the amount of money victims spent as a result of directly dealingwith the consequences of CAC, CMC and/or CDC that they experienced during the last 12 months(such as the costs of buying new hardware or software and repairing devices). See Table 6 for thefull list of costing items; money spent on prevention—the amount of money respondents (both victims and non-victims)spent in order to protect themselves from CAC, CMC and/or CDC during the last 12 months (suchas the costs of new hardware, backup data storage or storage devices, insurance etc). See Table 9for the full list of costing items; and money recovered—the amount of money victims recovered or were reimbursed following theirexperience of CAC, CMC and/or CDC during the last 12 months.5
Australian Institute of CriminologyStatistical Bulletin 34For each of these costs, the total amount lost or spent was divided by the number of respondentsin the sample (n 11,840), then multiplied by the Australian population aged 18 years or over basedon the ABS data for 2019. The total amount lost or spent was based on respondents’ estimates onlywhere this information was known to them. The final cost after recoveries was calculated by summingthe total money directly lost, total money spent on consequences, and the total money spent onprevention, then subtracting the total money recovered.LimitationsThere are limitations to this survey. These include the ability of respondents to determine whetherthey were a victim of particular forms of cybercrime, to accurately recall the amount of money lostdue to cybercrime, and to distinguish between money spent on prevention (by victims and nonvictims) and money spent on general computer hardware upgrades. While the use of probability andnon-probability surveys allows for a large sample, and the use of the probability sample to calibratethe data from the non-probability sample improves the representativeness of the data, it is possiblethat unidentified biases may have been introduced during the weighting or calibration process thatcould not be accounted for.Sample characteristicsTables 1 and 2 outline the sample characteristics in terms of device ownership, usage and knowledge.On average, participants spent 39.2 hours using any digital device in the week prior to the survey(range: 0–168 hours), of which 12.5 hours were spent on work or business-related activities only(range 0–168).Table 1: Device ownership and frequency of use (weighted data, n 11,840)Frequency of device use for personal use (%)bPercent of sampleowning devicea 546.028.419.46.3Mobile phone95.585.710.43.30.6Smart rinter/scanner75.725.139.926.78.3Digital camera54.014.435.037.712.9ca: This includes both personal devices and devices used for work or business. Missing data on device ownership includes:desktop n 9, laptop n 3, tablet n 10, mobile n 3, smart devices n 7, modem n 12, printer n 6, digital camera n 14b: Frequency of use refers to personal use only, and does not include devices used solely for business or work purposes.Figures only include respondents who reported that they owned each device. Missing data on frequency of use includes:desktop n 3,114, laptop n 2,156, tablet n 3,899, mobile n 402, smart devices n 5,587, modem n 2,764, printer/scannern 1,256, digital camera n 4,846c: Smart devices included watches, TVs, and other ‘smart’ devices not including mobile phones and computersNote: Percentages may not total 100 due to roundingSource: Cost of cybercrime survey [AIC data file]6
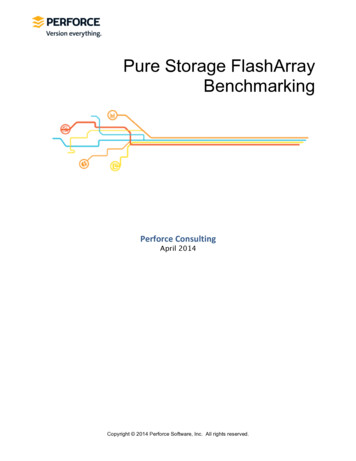
Australian Institute of CriminologyStatistical Bulletin 34Table 2: Knowledge of and ability to use devices (weighted data, n 11,840) (%)Very lowLowModerateHighVery eAbilityNote: Percentages may not total 100 due to rounding. Excludes 3 respondents who did not report their self-ratedknowledge of technological devices, and 22 respondents who did not report their self-rated ability to use technologicaldevicesSource: Cost of cybercrime survey [AIC data file]ResultsPrevalence of pure cybercrimeAs shown in Figure 1, 34 percent of the weighted sample had ever experienced at least one form ofpure cybercrime, with 14 percent having experienced pure cybercrime in the last 12 months. Themost prevalent type of victimisation was CDC, with 29 percent of all respondents indicating they hadexperienced a CDC at any time in the past, compared with 12 percent for CAC and nine percent forCMC (11%, 6% and 4% in the last 12 months, respectively).Extrapolating these findings out to the entire Australian population of individuals aged 18 and over(n 19,753,290; ABS 2019), it is estimated that 6,690,439 Australians have been the victim of purecybercrime at some point in the past, with 2,822,027 Australians being victimised in the past year.Figure 1: Experience of pure cybercrime at any time in the past and in the last 12 months(weighted sample, n 11,840) (%)50Ever experiencedExperienced in last 12 rallCAC8.54.1CDCCMCNote: CAC computer access crimes; CDC computer disruption crimes; CMC computer malfunction crimesSource: Cost of cybercrime survey [AIC data file]7
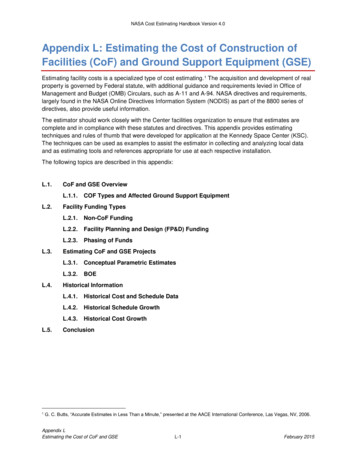
Australian Institute of CriminologyStatistical Bulletin 34Figure 2 presents the prevalence of pure cybercrime victimisation in the last 12 months, bycybercrime type. This shows the significant overlap between the three major categories of purecybercrime. Among the 14 percent of respondents who experienced any form of pure cybercrimein the last 12 months, 15 percent (2% of all respondents) experienced all three forms. A further19 percent (3% of all respondents) experienced two forms of cybercrime.Figure 2: Pure cybercrime victimisation in the last 12 months by crime type(weighted sample, n 11,840)CAC2.2%1.3%CDC6.7%2.1%0.3%1.1%CMC0.6%Note: CAC computer access crimes; CDC computer disruption crimes; CMC computer malfunction crimesSource: Cost of cybercrime survey [AIC data file]Economic impact of pure cybercrimeUsing the weighted data extrapolated to the entire adult Australian population of individuals aged18 and over (ABS 2019), the overall economic harm caused to the population by these crime typesin the past 12 months was calculated (see Table 3). In the past 12 months, it is estimated thatAustralians had a total of 1.9b directly taken from them during a pure cybercrime, in addition tolosing 597.4m dealing with the consequences of that victimisation. During this period, Australians(both victims and non-victims) also spent an estimated 1.4b on prevention costs. However, the trueexpenditure on prevention may be close to 1.6b after accounting for the individuals who spentmoney but could not recall how much. Even though Australians were able to recover 388.7m of the 1.9b lost, the total economic impact of pure cybercrime on Australian individuals as a whole in 2019was approximately 3.5b.8
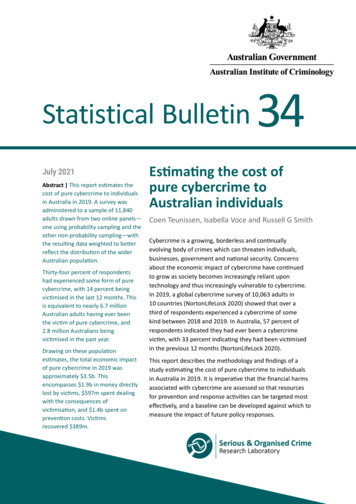
Australian Institute of CriminologyStatistical Bulletin 34Table 3: Extrapolated costs of pure cybercrime to Australian individuals (A m)Total money directly lostTotal money spent on consequencesTotal money spent on prevention by victimsaTotal money spent on prevention by non-victimsTotal money recoveredFinal cost after recoveriesbAll 36.73,498.71,737.0707.1166.9a: The total money spent on prevention by victims also includes 103.9m for victims who experienced multiple types ofcybercrime victimisation. This is because respondents were asked if they had spent any money on prevention measures,and then the results were analysed according to whether or not they had been a victim, and by crime typeb: Total money recovered is subtracted from the subtotal to provide the final cost after recoveriesNote: CAC computer access crimes; CDC computer disruption crimes; CMC computer malfunction crimesSource: Cost of cybercrime survey [AIC data file]CAC resulted in the greatest direct losses and amounts recovered, while CDC incurred the highestcost to victims in dealing with the consequences. Non-victims spent more money on preventionthan victims.Money directly lostA total of 42 percent of CAC victims, 15 percent of CDC victims and 16 percent of CMC victimsreported losing money due to victimisation. More often than not for CDC and CMC, cybercrimevictims knew they had lost money to the crime but were unsure how much they had lost. However,for all three types, when victims knew how much they had lost, the amount was most often lessthan 1,000 (see Figure 3).Figure 3: Amounts lost to pure cybercrime in past 12 months, by crime type (weighted sample,n 1,792) .51003.1Don't knowLess than 1,0004.3Over 1,0002.00.10.0Over 50,000Note: CAC computer access crimes; CDC computer disruption crimes; CMC computer malfunction crimesSource: Cost of cybercrime survey [AIC data file]9
Australian Institute of CriminologyStatistical Bulletin 34To obtain the total amount of money lost by victims, respondents were asked how much moneythey had lost in the last year as a result of experiencing each type of cybercrime: CAC, CDC and CMC.Victims of multiple types of pure cybercrime attributed the costs separately to each type.The total amount lost by victims was 1,053,227 for CAC, 64,637 for CDC, and 29,522 for CMC (seeTable 4). These totals were then extrapolated out to the Australian population, resulting in 1.8b forCAC, 107.8m for CDC and 49.3m for CMC.Table 4: Money directly lost by victimsCACCDCCMC7241,402484Number of victims who lost money (%)305 (42%)208 (15%)76 (16%)Number of victims who could report how much theylost (%)a171 (24%)87 (6%)30 (6%) 5,033 (24,564) 1,648 (9,696) 1,556 (5,782) 300 200 300 215,000 90,000 32,000 1,053,227 64,637 29,522 1,757,153,578 107,838,098 49,254,562Number of victims in past yearaAmount taken per victimMean (SD)MedianMaximum lostExtrapolationsTotal amount lost in samplebExtrapolated totalca: Presented as the proportion of all victims of that crime type in the past 12 monthsb: Estimated total based on the weighted populationc: Total amount divided by the sample (n 11,840), multiplied by the Australian population aged 18 years or over based onthe ABS data for 2019 (n 19,753,290)Note: CAC computer access crimes; CDC computer disruption crimes; CMC computer malfunction crimes. Money figuresrounded to nearest dollarSource: Cost of cybercrime survey [AIC data file]Money spent on consequencesTo obtain the total amount of money spent dealing with the consequences of pure cybercrime,victims were asked how much money they spent on various responses taken in the last year.Respondents were asked to estimate this separately for CAC, CDC and CMC. Victims of multiple typesof pure cybercrime attributed the costs separately to each type (see Table 5).The total amount victims spent dealing with the consequences of pure cybercrime was 84,445 forCAC, 233,425 for CDC and 40,181 for CMC (see Table 6). These totals were then extrapolated to theAustralian population, resulting in estimated costs of 140.9m for CAC, 389.4m for CDC and 67.0mfor CMC (see Table 7).10
Australian Institute of CriminologyStatistical Bulletin 34Table 5: Money victims spent on consequences of pure cybercrime, by crime typeCACCDCCMC7241,402484219 (30%)422 (30%)115 (24%)110 (15%)251 (18%)58 (12%)Number of victims in past yearNumber of victims who spent money on consequences (%)aNumber of victims who could report how much they spent (%)aa: Presented as the proportion of all victims of that crime type in the past 12 monthsNote: CAC computer access crimes; CDC computer disruption crimes; CMC computer malfunction crimesSource: Cost of cybercrime survey [AIC data file]Table 6: Mean cost of dealing with consequences of cybercrime victimisation when expenditurewas known (A )Cost itemMean costTotal cost (weighted)CACCDCCMCCACCDCCMCBuying new hardware55240058938,16640,37315,969Buying new additional software1771731944,32610,1391,183Buying peripheral hardware to usewith new systems2741855632,1995,1513,572IT repair shop costs23718524911,79327,90912,457Re-installing lost data36114814710,32611,6602,728Increased insurance premiums107128198601873682Bank fees161733672,8846431,219Service provider charges12694552,5112,094159Cost of physical security190327601,6732,65173Value of time off 02623004259,22283884,445233,42540,181Travel costs for repairs/purchasesOtherTotal combinedaa: Item costs may not equal the combined total due to roundingNote: CAC computer access crimes; CDC computer disruption crimes; CMC computer malfunction crimes. Money figuresrounded to nearest dollarSource: Cost of cybercrime survey [AIC data file]Table 7: Extrapolated costs of dealing with the consequences of cybercrime victimisation (A )Total amount spent in sampleExtrapolated 433,61067,035,409a: This uses an estimate of the total based on the weighted populationb: Total amount divided by the sample (n 11,840), multiplied by the Australian population aged 18 years or over based onthe ABS data for 2019 (n 19,753,290)Note: CAC computer access crimes; CDC computer disruption crimes; CMC computer malfunction crimes. Money figuresrounded to nearest dollarSource: Cost of cybercrime survey [AIC data file]11
Australian Institute of CriminologyStatistical Bulletin 34Money spent on preventionTo obtain the total cost of prevention measures implemented by victims and non-victims, all respondentswere asked how much money they had spent on various prevention measures in the last year. Unlikethe costing for direct losses and consequences, respondents were not asked about prevention costsseparately for CAC, CDC and CMC. Because respondents could be victims of multiple cybercrime types,prevention costs were estimated for all victims to avoid double-counting costs (see Table 8).The total amount spent on prevention was 204,253 for victims and 620,391 for non-victims (seeTable 9). These totals were then extrapolated out to the Australian population, resulting in estimatedcosts of 340.8m for victims and 1.0b for non-victims (see Table 10).Table 8: Descriptive and costing statistics for money spent on prevention in the past yearVictimsaNon-victimsb1,79210,0481,118 (62%)3,981 (40%)645 (36%)2,464 (25%)Number of respondentsNumber who spent money on prevention (%)Number who could report how much they spent (%)a: Presented as proportion of victims in the past yearb: Presented as proportion of non-victims in the past yearSource: Cost of cybercrime survey [AIC data file]Table 9: Mean cost of prevention when expenditure was known (A )Cost itemMean costTotal cost ng new hardware37538863,665205,410Buying backup data storage or storage devices20417555,171183,635Buying new security or other software15213140,587125,070Cyber security training costs3363168,4035,387Taking out insurance3024865,52853,494Changing service providers2531799,55920,027Buying physical security2972824,41621,042Time off work to install new devices and 253620,391Total combinedaa: Item costs may not equal the combined tota
response costs—was 1.1b in the 2015-16 financial year. . Cyber Security Centre (2020) received approximately 144 reports of cybercrime relating to small . business per day in 2019, costing small businesses an estimated 300m per year, but it is unclear . which types of cybercrime were included in the cost estimates. Research conducted .