Transcription
Monitoring Tomcat with JMX
Christopher SchultzChief Technology OfficerTotal Child Health, Inc.* Slides available on the Linux Foundation / ApacheCon2016 web site and athttp://people.apache.org/ schultz/ApacheCon NA 2016/Monitoring Apache Tomcat withJMX.odp
Java Management Extensions Protocol and API for managing and monitoring–Access data via JMX “Mbeans”–Read and write bean attributes–Invoke operations–Receive notifications JVM exposes certain status Tomcat exposes certain status
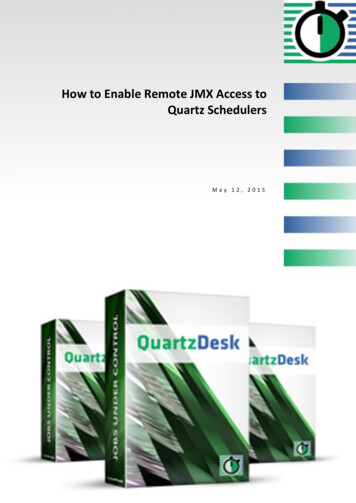
Monitoring JVM Heap status Total, free, used memory Garbage collection GC pause times
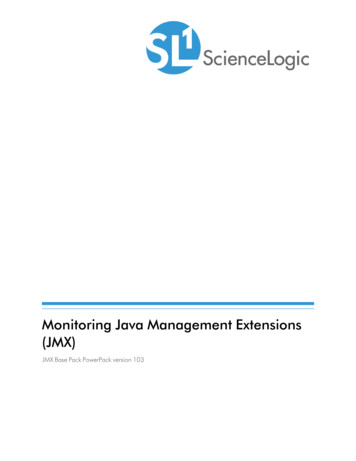
Monitoring Tomcat Status of connector Status of request-processor thread pool Status of data sources Request performance
JMX Tools jconsole (JDK) VisualVM (JDK, app bundle) Most profilers (e.g. YourKit, etc.) Custom tools using javax.management API
Monitoring JVM: Heap
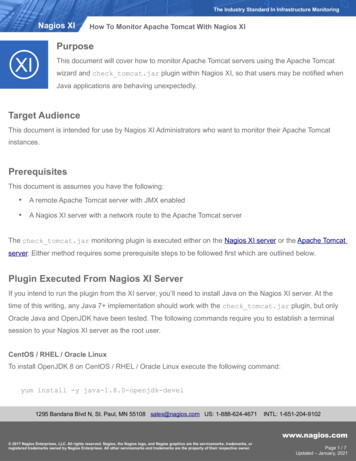
Monitoring Tomcat Status of data sourcesStatus of request-processorthread pool Request performance Session information
Monitoring Tomcat Status of data sourcesStatus of request-processorthread pool Request performance Session information
Monitoring Tomcat: Requests
Monitoring Tomcat: Requests
Monitoring Tomcat: Requests
Monitoring Tomcat Status of data sourcesStatus of request-processorthread pool Request performance Session information
Monitoring Tomcat: Sessions
Monitoring Tomcat Status of data sourcesStatus of request-processorthread pool Request performance Session information
Monitoring Tomcat: DataSources
Monitoring Tomcat Status of data sourcesStatus of request-processorthread pool Request performance Session information
Monitoring Tomcat: Threads
Monitoring Tomcat: Threads
Monitoring Tomcat: Threads
Monitoring Tomcat: Threads
Monitoring Your Application Monitor Application Processes Performance Metrics On-the-fly re-configuration
Monitoring Your Application Write an MBean– Create an Interface: FooMBean– Create an Implementation: Foo– Create an XML MBean descriptorDeploy package to Tomcat– Publish the MBean to the MBean serverQuery / invoke as necessary* Example code available athttp://people.apache.org/ schultz/ApacheCon NA 2016
Example MBean Servlet Filter that captures total request processingtime– Timestamp prior to request– Timestamp after request– Add the delta to a JMX-accessible counter:RequestStats
RequestStats MBean Write an MBeanpublic interface RequestStatsMBean {public long getProcessingTime();public long getRequestCount();public void resetCounters();}public class RequestStatsimplements RequestStatsMBean {[.]public void updateStats(long timestamp,ServletRequest request, long elapsed) incrementAndGet();}public long getProcessingTime(){return totalElapsedTime.get();}public long getRequestCount() {return requestCount.get();}public void resetCounters() {totalElapsedTime.set(0l);requestCount.set(0l);}}
RequestStats MBean Write an MBean descriptor mbeans-descriptors mbean name "RequestStats" . operation name "getProcessingTime"description "Gets the total number ofmilliseconds spent processing requests."impact "INFO"returnType "long" / operation name "getRequestCount"description "Gets the total number ofrequests processed."impact "INFO"returnType "long" / operationname "resetCounters"description "Resets allcounters."impact "ACTION"returnType "void" / /mbean /mbeans-descriptors
RequestStats MBean Create JAR–Java interface–Java implementation–mbeans-descriptors.xmlPut JAR into CATALINA BASE/lib
RequestStats MBeanWrite the Filter public void init(FilterConfig config) {MBeanServer server getServer();server.registerMBean( stats, newObjectName("Example:RequestStats RequestStats,name " filterName;));}public void doFilter(.) {timestamp elapsed System.currentTimeMillis();chain.doFilter(request, response);elapsed System.currentTimeMillis() - elapsed;stats.updateStats(timestamp, request, elapsed);}
RequestStats MBeanMap the Filter filter filter-name servlet-request-stats /filter-name filter-class filters.RequestStatsFilter /filter-class init-param param-name name /param-name param-value servlets /param-value /init-param /filter filter-mapping filter-name servlet-request-stats /filter-name url-pattern /servlets/* /url-pattern /filter-mapping filter filter-name jsp-request-stats /filter-name filterclass filters.RequestStatsFilter /filter-class init-param param-name name /param-name paramvalue jsps /param-value /init-param /filter filter-mapping filter-name jsp-request-stats /filter-name url-pattern /jsp/* /urlpattern /filter-mapping
RequestStats MBean
RequestStats MBean
Automated Monitoring Remote Access Large Scale Constant
Automated Monitoring Remote Access Large Scale Constant Need more tools!
Automated Monitoring st community version available
Automated Monitoring
Nagios Monitoring Plug-in architecture (i.e. arbitrary scripts) Freely-available JMX plug-in: check jmx ./check jmx -U i\-O java.lang:type Memory -A NonHeapMemoryUsage -K used\-w 29000000 -c 30000000JMX WARNING NonHeapMemoryUsage.used 29050880
Nagios Monitoring Problems with check jmx–Complex configuration for remote JMX–JVM launch for every check–Course-grained authentication options
Nagios Monitoring Alternative Option: Tomcat's JMXProxyServlet–JMX data available via HTTP–Can use Tomcat's authentication tools ./check jmxproxy -U 'http://localhost/manager/jmxproxy?get java.lang:type Memory&att HeapMemoryUsage&key used' \-w 29000000 -c 30000000JMX CRITICAL: OK - Attribute get 'java.lang:type Memory' - HeapMemoryUsage- key 'used' 100875248* check jmxproxy can be found athttp://wiki.apache.org/tomcat/tools/check jmxproxy.pl
Nagios Monitoring
JMX Command-line Tricks Show all logged-in usernamesfor sessionid in wget -O - 'http://user:pwd@host/manager/jmxproxy?invoke Catalina:type Manager,context /myapp,host localhost&op listSessionIds' \ sed -e "s/ /\n/g" grep ' [0-9A-Za-z]\ \(\.*\)\? ' ;\do wget -O – "http://user:pwd@host/manager/jmxproxy?invoke Catalina:type Manager,context /myapp,host localhost&op getSessionAttribute&ps sessionid,user" ; done 2 /dev/null \ grep User
Tracking Values Over Time Some metrics are best observed as deltas–Session count–Request error count Requires that you have a history of data Requires that you consult the history of that data check jmxproxy provides such capabilities
Tracking Values Over Time ./check jmxproxy -U 'http://localhost/manager/jmxproxy?get java.lang:type Memory&att HeapMemoryUsage&key used' -w 33554432 -c 50331648 --write number.out--compare number.outJMX OK: OK - Attribute get 'java.lang:type Memory' - HeapMemoryUsage - key 'used' 102278904,delta [.] ./check jmxproxy -U 'http://localhost/manager/jmxproxy?get java.lang:type Memory&att HeapMemoryUsage&key used' -w 33554432 -c 50331648 --write number.out--compare number.outJMX OK: OK - Attribute get 'java.lang:type Memory' - HeapMemoryUsage - key 'used' 113806144,delta 11527240 ./check jmxproxy -U 'http://localhost/manager/jmxproxy?get java.lang:type Memory&att HeapMemoryUsage&key used' -w 33554432 -c 50331648 --write number.out--compare number.outJMX OK: OK - Attribute get 'java.lang:type Memory' - HeapMemoryUsage - key 'used' 109264056,delta -4542088
Tracking Values Over Time Session count– Tomcat actually provides this already via Manager'ssessionCreateRate attributeRequest errors ./check jmxproxy -U 'http://localhost/manager/jmxproxy?get Catalina:type RequestProcessor,worker "http-nio-127.0.0.18217",name HttpRequest1&att errorCount' -w 1 -c 10 --write errors.txt--compare errors.txtJMX OK: OK - Attribute get 'Catalina:type RequestProcessor,worker "httpnio-127.0.0.1-8217",name HttpRequest1' - errorCount 0, delta 0
Detecting OutOfMemory Many sources of OOME–Heap exhaustion–PermGen exhaustion–Hit thread limit–Hit file descriptor limit
Detecting OutOfMemory Two types of heap OOME–One thread generates lots of local references–All threads collaborate to generate globally-reachable objects (e.g.session data) Former is recoverable, latter is not You want to be notified in any case
Memory Pool Thresholds
Memory Pool Thresholds
Memory Pool Thresholds
Memory Pool Thresholds
Memory Pool Thresholds Choice of how to detect exceeded-threshold conditions–Polling using check jmxproxy–Register a notification listener from Java Have that listener take some action
Detect OutOfMemory Monitoring Memory Thresholds–Set threshold on startup–Register a notification listener (callback)–Watch “exceeded” count (poll)–Report to monitoring software (Nagios)–Repeat for each memory pool you want to watch–Hope the JVM does not fail during notification–This is getting ridiculous
Detecting OutOfMemory JVM has an easier wayUse -XX:OnOutOfMemoryError to run a command on firstOOME detected by the JVMNeed a command to notify Nagios
Notify Nagios on OOME Script that wraps curl curl -si \--data-urlencode 'cmd typ 30' \--data-urlencode 'cmd mod 2' \--data-urlencode "host myhost" \--data-urlencode "service JVM:Heap:OOME" \--data-urlencode "plugin state 2" \--data-urlencode "plugin output OOME CRITICAL" cript can be found at ssive-check.sh
Monitoring Tomcat with JMX JMX Provides Monitoring and Management of JVMs Tomcat exposes a great amount of information via JMX Applications can expose anything to JMX via MBeans JRE ships with tools for light JMX interaction Practical use of JMX requires some additional tools
Resources Presentation Slideshttp://people.apache.org/ schultz/ApacheCon NA 2016/Monitoring ApacheTomcat with JMX.odp Nagios passive-check end-passive-check.sh check jmxproxyhttp://wiki.apache.org/tomcat/tools/check jmxproxy.pl Special thanks to Christopher Blunck (MBeans info)http://oss.wxnet.org/mbeans.html
Java Management Extensions Protocol and API for managing and monitoring - Access data via JMX "Mbeans" - Read and write bean attributes - Invoke operations - Receive notifications JVM exposes certain status Tomcat exposes certain status