Transcription
PROVIDER DATA SUMMARY NOVEMBER 2020Virginia Department ofBehavioral Health &Developmental ServicesProvider Data SummarySemi-Annual ReportState Fiscal Year 2020-2021May 1, 2020 to October 31, 20201Developmental Services and Office of Clinical Quality Improvement 3.12.21
PROVIDER DATA SUMMARY NOVEMBER 2020Provider Data SummarySemi-Annual ReportIntroductionThis is the fifth Provider Data Summary Report that providesupdates on the status of DD Waiver service availability andactivities completed by the Office of Provider Development (OPD)in the Division of Developmental Services (DDS) at theDepartment of Behavioral Health and Developmental Services(DBHDS).Executive SummaryAs with previous reports, the focus is on identifying service development needs based on areview of developmental disability (DD) waiver population and authorization data in eachlocality in Virginia. The “Baseline Measurement Tool (BMT),” which is used by OPD in conductingthis review, has been updated to include the data from 5/1/2020 to 10/31/20 and to realignhistorical data previously reported as the DBHDS Developmental Services regions with thePrimary DBHDS regions. All past data in the BMT has been updated to reflect this change.Providers are encouraged to review the BMT in conducting market research and in strategicplanning efforts. Provider Data Summary webinars continue on a semiannual basis to provide aforum for sharing the results of ongoing analysis of the opportunities for DD servicesdevelopment across all regions. Webinars include a basic overview of findings, provide supporton using the data provided, and encourage the development of business acumen in the DDprovider community (for more information see http://www.hcbsbusinessacumen.org/.As with previous reports, there is consideration of a subset of DD Waiver services considered tobe more integrated or critical, which include: Benefits Planning, Community Coaching,Community Engagement, Community Guide, Electronic Home-Based Services, Employment andCommunity Transportation, Independent Living Supports, In-home Supports, Peer Mentoring,Shared Living, Supported Living, Crisis Support Services, Private Duty Nursing, Skilled Nursing,and Sponsored Residential.Following the Executive Summary, this report provides data visualizations in three sections: KeyPerformance Measures, Regional Data, and Identified Gaps. The Executive Summary providesupdates on various efforts to support provider development, the Key Performance Measures2Developmental Services and Office of Clinical Quality Improvement 3.12.21
PROVIDER DATA SUMMARY NOVEMBER 2020section focuses on measures designed to track Virginia’s success in moving to more integratedoptions, the Regional Data section provides information specific to each region aroundavailability, and the Identified Gaps section encourages the exploration of opportunities basedon barriers identified through the Regional Support Team referral process.The Provider Data Summary Report provides a means to track provider development efforts andcommunicate changes observed in the DD services system over time. In order to moreeffectively accomplish its mission, Provider Development was reorganized into three distinctcapacity-building teams at the following levels - Individual, Provider, and System.In February 2020, the reassignment of Community Resource Consultants (CRCs) occurred acrossthese three areas, providing access to one CRC in each capacity-building area per region.Primary outcomes include:Individual: People with developmental disabilities live personallymeaningful lives in their community of choice.Provider: Providers of developmental disability waiver services haveaccess to information and technical assistance that supports bestpractices.System: DBHDS provides resources for supports coordinators andproviders that are based on promising and best practices in supportingpeople with developmental disabilities in Virginia.Areas of expertise by capacity building team:3Developmental Services and Office of Clinical Quality Improvement 3.12.21
PROVIDER DATA SUMMARY NOVEMBER 2020Data in this report are compared across two points in time – Baseline 2018 and October 2020 sothat a more meaningful understanding of progress can be achieved. This report provides ameans to share Virginia's success in meeting measures established under the SettlementAgreement. Measures in this report include: Data continues to indicate an annual 2% increase in the overall DD waiver populationreceiving services in the most integrated settings Data continues to indicate that at least 90% of individuals new to the waivers, includingfor individuals with a “supports need level” of 6 or 7, since FY16 are receiving services inthe most integrated setting The Data Summary indicates an increase in services available by locality over time 86% of people with a DD waiver, who are identified through indicator #13 of III.D.6,desiring a more integrated residential service option (defined as independent livingsupports, in-home support services, supported living, and sponsored residential) haveaccess to an option that meets their preferences within nine months 95% of provider agency staff meet provider orientation training requirements 95% of provider agency direct support professionals (DSPs) meet competency trainingRequirements At least 95% of people receiving services/authorized representatives participate in thedevelopment of their own service plan At least 75% of people with a job in the community chose or had some input in choosingtheir job At least 86% of people receiving services in residential services/their authorizedrepresentatives choose or help decide their daily schedule At least 75% of people receiving services who do not live in the family home/theirauthorized representatives chose or had some input in choosing where they live At least 50% of people who do not live in the family home/their authorizedrepresentatives chose or had some input in choosing their housematesIn addition to the above measures, we have included a variety of data about the individuals inthe DD population, as well as the providers who are approved to support them. These additionsalign with requirements set forth in the Settlement Agreement joint filing from January 2020(per V.D.6).DBHDS has continued to make progress with various initiatives designed to improve DD waiverprovider capacity in Virginia. The following list highlights the status of Provider Developmentactivities since the last report:4Developmental Services and Office of Clinical Quality Improvement 3.12.21
PROVIDER DATA SUMMARY NOVEMBER 2020The My Life My Community (MLMC) Provider Database and Provider Designation Process werelaunched on November 15, 2019. All DD Waiver providers are encouraged to register on thedatabase, which will serve as the centralized location for finding DD services in Virginia. As ofOctober 2020, 109 providers registered and have DD Professional Membership at the MLMCProvider Database. Collectively, four providers hold badges in Autism, Accessibility, BehavioralSupport, and Complex Health Supports. To date, twenty–one providers have passed surveys,and for some providers the next step is to submit the required evidential documents. Providerscan check their status on the database and, if needed, register at the following -profile.In July 2020, the Office of Provider Development held a statewide Provider Roundtable andSupport Coordinator webinar in lieu of in-person, regional meetings due to the COVID-19pandemic. It was attended by 460 participants. These meetings serve as a forum to exchangeinformation about topics impacting providers and support coordination, as well as providespace for shared learning.Provider Development Activities during the period of May 2020 – October 2020 includedCommunity Resource Consultants meeting with 33 unique providers seeking to diversify orexpand services. Region 1 had three providers, Region 2 had five providers, Region 3 had fourproviders, Region 4 had fifteen providers, and Region 5 had three providers. One new Individual& Family Caregiver Training provider and one new Community Guide provider have startedproviding services. Providers contacted are noted as considering the following DD Waiverservices: Community Housing Guide (1), Benefits Planning (1), Supported Living (3), IndependentLiving Supports (1), Employment and Community Transportation (1), Peer Mentoring (1), andIndividual & Caregiver Training (1). In addition, two organizations are considering providingElectronic Home Based Services in Virginia. Barriers included DMAS finalizing the billingprocess, COVID-19, waiting on licensing approval, regulatory limitation on Electronic HomeBased Services, lack of candidates to hire as Direct Support Professionals, out of state providersstarting services in Virginia having to complete additional requirements, and, as with the lastreport, the lack of regulations and a policy manual.Regarding the status of Virginia’s efforts to implement the two remaining waiver services,Employment and Community Transportation forms and processes have been developed, aMedicaid Memo is forthcoming. While there are no authorizations for Peer Mentoring yet, theArc of Virginia has initiated the training of Peer Mentors. CRCs are available to work withproviders interested in being an administrative agency for this service.5Developmental Services and Office of Clinical Quality Improvement 3.12.21
PROVIDER DATA SUMMARY NOVEMBER 2020The Jump-Start Funding Program has awarded approximately 23,500 during the reportingperiod. This program continues to create more integrated residential and day services optionsin underserved areas. Funds are available to assist providers with service expansion in allregions. Provider Development staff have presented program information at regional ProviderRoundtables. Information on how to apply is located /provider-development.The DSP Supervisory Training was updated and expanded to meet indicators of the DOJSettlement Agreement, and it was made available on the Commonwealth of Virginia LearningCenter (COVLC) July 1, 2020. This training consists of 3 modules that take approximately 2 ½hours to complete. It is mandatory for new DSP Supervisors and optional for DSP Supervisorswho have already received a certificate from completion of the previous version of the trainingin COVLC.Supervisory completion rates are included in the chart below. These results consider whethersupervisors completed the curriculum (or the modules individually) and reflect the numbers thatpassed the included knowledge-based test:In order to continue to adapt to distance learning needs due to the COVID-19 pandemic, theOffice of Provider Development continues to work to create virtual methods of providingtraining to providers throughout the Commonwealth. An Instructor Led Remote (virtual) versionof the Community Connections and Person Centered Thinking classes have been developed by6Developmental Services and Office of Clinical Quality Improvement 3.12.21
PROVIDER DATA SUMMARY NOVEMBER 2020The Learning Community for Person Centered Practices (TLCPCP). To register for one of theseclasses, visit http://www.personcenteredpractices.org/. The Office of Provider Development iscurrently working alongside the Partnership for People with Disabilities at VCU to adapt the PlanFacilitation curriculum to an Instructor Led (virtual) format, and those trainings will beannounced in the coming months.Next steps for Provider Development include: working directly with providers to address barriers to service provision with aconcentrated focus on Community Guide, Employment and Community Transportation,Peer Mentoring, Crisis Supports Services, and Skilled Nursing updating and posting online the core provider training modules for all DD waiverservices producing and distributing a searchable PDF version of the DD Case ManagementManual, which is currently online at the Partnership for People with Disabilities website continued participation in the community of practice initiative around Charting theLifecourse incorporating Business Acumen practices into provider development efforts develop plans for the next Provider Innovation Collaborative to be held after the end ofthe public health emergency increasing the number of providers per region identified as having expertise to supportpeople with complex needsNotable updates in this report include: Since September of 2016, 3,192 people have moved into more integrated settingsdefined as settings of no more than four people with developmental disabilities In the past six months, 47.9% of people at Supports Intensity Scale levels 6 and 7 whoenrolled in the DD Waiver are receiving their services in more integrated settings of fouror fewer people with DD In the past six months, provider counts have decreased in Community Coaching (-3),Electronic Home Based Services (-1), Supported Living (-2), Crisis Support Services (-1),and Skilled Nursing (-1) Community Engagement and Community Coaching services have experiencedsignificant decreases during the COVID-19 public health emergency7Developmental Services and Office of Clinical Quality Improvement 3.12.21
PROVIDER DATA SUMMARY NOVEMBER 2020 Despite a decrease in authorizations, Community Engagement increased by 3 providers All data in the Baseline Measurement Tool has been updated to reflect the primaryDBHDS service regions. Sub region designations have been updated to enablecomparisons across reporting periods and to support providers in better understandingthe potential customer base in the areas, as well as potential opportunities for programdevelopment.Providers are encouraged to download and use the Baseline Measurement Tool, which containsWaiver Management System data from current waiver authorizations. The BMT providesbaseline and subsequent data on integrated services, collected at six month intervals, across allcities and counties in Virginia. The BMT also considers the DD Waiver population in each localityincluding type of waiver and Supports Intensity Scale (SIS ) level. The BMT, webinarslideshows, and other materials related to Provider Development are available for downloadonline at es/provider-development. Anyspecific questions about the report can be directed to the Office of Provider Development atDBHDS (eric.williams@dbhds.virginia.gov ).Location of the BMT online:8Developmental Services and Office of Clinical Quality Improvement 3.12.21
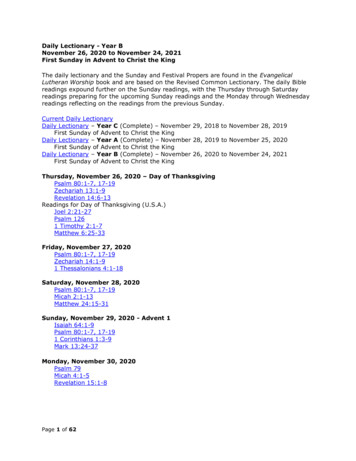
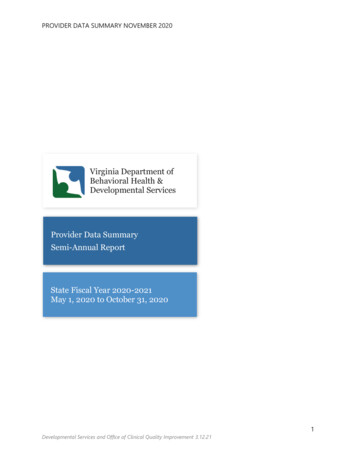
PROVIDER DATA SUMMARY NOVEMBER 2020Measure 1: Data continues to indicate an annual 2% increase in the overall DD waiverpopulation receiving services in the most integrated settings. The chart below illustrates theoverall trend in living situations for people with DD Waiver from September 30, 2019 toSeptember 30, 2020 compared to baseline on September 30, 2016. Over the course of the lastyear there has been an overall shift of 1.2% toward more integrated settings. From baseline,there has been a total increase toward integrated settings of 6.3%. Measure not met.Integrated Settings Comparision1.2% 2,1029.30.2012,6172,1549.30.1911,7812,4469.30.16 ng TypeIntegratedNon-integratedTotalBaseline elopmental Services and Office of Clinical Quality Improvement 3.12.21
PROVIDER DATA SUMMARY NOVEMBER 2020Integrated living situations by locality10Developmental Services and Office of Clinical Quality Improvement 3.12.21
PROVIDER DATA SUMMARY NOVEMBER 202011Developmental Services and Office of Clinical Quality Improvement 3.12.21
PROVIDER DATA SUMMARY NOVEMBER 202012Developmental Services and Office of Clinical Quality Improvement 3.12.21
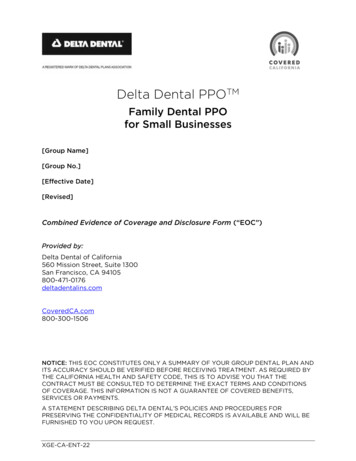
PROVIDER DATA SUMMARY NOVEMBER 2020Measure 2: Data continues to indicate that at least 90% of individuals new to the waivers,including for individuals with a “supports need level” of 6 or 7, since FY16 are receivingservices in the most integrated setting. The tables below provides data that illustrates that78.3% of all people new to the DD waivers reside in integrated settings and among those, 47.9%of people with Supports Intensity Scale 6 or 7 receive services in integrated settings. At 78.3%,measure not met.Measure 3: The Data Summary indicates an increase in services available by locality overtime. This chart reports the number of localities demonstrating an increase in the number ofproviders, within the locality, offering more integrated or specialized services above theestablished baseline and/or showing an increase in the number of integrated or specializedservice types offered, within the locality, above the established baseline. Data reflects thecomparison in numbers between October 2020 and June 2018. When considering both factors,there has been an increase in the number of localities by 30.1% for increasing provider countand service type. Changes in reporting this measure will enable trend reports over time insubsequent reporting. Measure met.13Developmental Services and Office of Clinical Quality Improvement 3.12.21
PROVIDER DATA SUMMARY NOVEMBER 2020Change in number of localities with provider count changesand/or the types of more integrated services, within thelocality, since rovider CountNo ChangeService TypeMeasure 4: 86% of people with a DD waiver, who are identified through indicator #13 ofIII.D.6, desiring a more integrated residential service option (defined as independentliving supports, in-home support services, supported living, and sponsored residential)have access to an option that meets their preferences within nine months.In the 1st Quarter, two individuals referred to the RST were identified upon referral with Barrier 2defined as “Services and activities unavailable in desired location.” The first instance, reported inRegion 4, was resolved when the person moved into a sponsored residential home. In thesecond instance, reported in Region 3, a person is living at home with personal assistance andprivate duty nursing services. The individual would like additional private duty nursing serviceshowever remain living in their own home at this time. Second quarter data is pending, which willbe included in the next report. In both instances where this barrier occurred, the situations wereresolved to individual satisfaction. Measure met.Measure 5: 95% of provider agency staff meet provider orientation training requirements.Quality Review Team data demonstrates a decrease in compliance from 4th quarter FY19 to 1stquarter FY20 reporting. Reporting across both quarters is reflected in the chart below, no recordreviews reported for the Building Independent Waiver in the 1st quarter FY21. Consideredtogether, results fall below the 95% target. Measure not met.14Developmental Services and Office of Clinical Quality Improvement 3.12.21
PROVIDER DATA SUMMARY NOVEMBER 2020Waver TypeCommunity LivingFamily and Individual SupportsBuilding IndependenceAll Waivers4th Quarter FY2081/8793.1%25/2792.6%4/4100%110/11893.2%1st Quarter FY2143/5676.8%6/1442.9%0/049/7070%Measure 6: 95% of provider agency direct support professionals (DSPs) meet competencytraining requirements. Quality Review Team data demonstrates a decrease in compliance from4th quarter FY19 to 1st quarter FY20 reporting. Reporting across both quarters is reflected in thechart below, no record reviews reported for the Family and Individual Supports and BuildingIndependent Waiver in the 1st quarter FY21. Considered together, results fall below the 95%target. Measure not met.15Developmental Services and Office of Clinical Quality Improvement 3.12.21
PROVIDER DATA SUMMARY NOVEMBER 2020Waver TypeCommunity LivingFamily and Individual SupportsBuilding IndependenceAll Waivers4th Quarter FY2079/8395.2%9/1090%4/4100%92/9795%1st Quarter FY2115/4037.5%0/00/015/4037.5%Measure 7: At least 95% of people receiving services in residential settings/theirauthorized representatives participate in the development of their own service plan.Consistently above 99% for the first and second quarters FY21. Measure met.16Developmental Services and Office of Clinical Quality Improvement 3.12.21
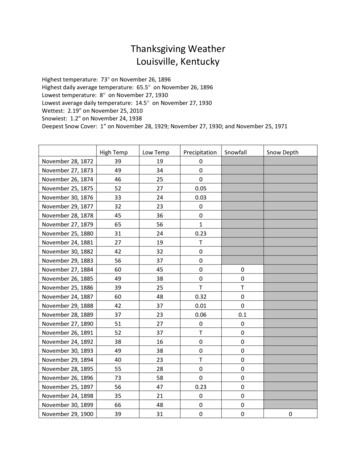
PROVIDER DATA SUMMARY NOVEMBER 2020Measure 8: At least 75% of people with a job in the community chose or had some inputin choosing their job. The following chart is derived from the National Core Indicators InPerson Survey (IPS) State Report 2019-20 Virginia (VA) Report. Results indicate that a combined90% of those surveyed who had a job (n 51) either chose or had some input on choosing theirjob. Measure met.Who chose the place where you n made the choice Person had some inputSomeone else choseSource: NCIMeasure 9: At least 86% of people receiving services in residential settings/theirauthorized representatives choose or help decide their daily schedule. Consistently above99% for the first and second quarters FY21. Measure met.17Developmental Services and Office of Clinical Quality Improvement 3.12.21
PROVIDER DATA SUMMARY NOVEMBER 2020Measure 10: At least 75% of people receiving services who do not live in the familyhome/their authorized representatives chose or had some input in choosing where theylive. Consistently above 99% for the first and second quarters FY21. Measure met.Measure 11: At least 50% of people who do not live in the family home/their authorizedrepresentatives chose or had some input in choosing their housemates. Consistently above99% for the first and second quarters FY21. Measure met.DemographicsIn order to understand the composition of the DD waiver and waiting list, the following sectionincludes data specific to the types of services received, including who receives them and wherethey are provided. Regional data is provided when available.18Developmental Services and Office of Clinical Quality Improvement 3.12.21
PROVIDER DATA SUMMARY NOVEMBER 2020Individuals on the Waiver Waiting ListThe two following tables provide information about people on the DD waiver waiting list. Youwill find a breakdown of DBHDS regions by priority (table 1) and by time on the list (table 2).Residential setting by size and type as defined by the Integrated Residential Services ReportComparison of living situations between 9.30.16 and 9.30.2019Developmental Services and Office of Clinical Quality Improvement 3.12.21
PROVIDER DATA SUMMARY NOVEMBER 2020Day services by type as defined by the Integrated Day Services ReportComparison of day situations between 9.30.16 and 9.30.20Additional population demographicsIn order to understand the composition of the DD waiver, the following tables include dataspecific to the types of services received, including who receives them and where they areprovided. Regional data is provided when available.DemographicTotalNumber of Individuals in all DD waivers1486232930211151277111Number of Individuals with BI WaiverNumber of Individuals with FIS WaiverNumber of Individuals with CL WaiverNumber of Individuals in Training CentersNumber of children residing in ICF/IIDsNumber of children residing in NFs55Number of adults residing in ICF/IIDs377Number of adults residing in NFs104Number of Individuals in independent 18876652666771470Additional service capacity demographicsThe following chart provides information about the availability of specific services.DemographicNumber of licensed DD 6210014087206229Number of providers of supported employment56Number of ICF/IID non-state operated beds forchildrenNumber of ICF/IID non-state operated beds foradultsNumber of independent housing options11640499320Developmental Services and Office of Clinical Quality Improvement 3.12.21
PROVIDER DATA SUMMARY NOVEMBER 2020DD Waiver Service AuthorizationsBehavioral Services Providers21Developmental Services and Office of Clinical Quality Improvement 3.12.21
PROVIDER DATA SUMMARY NOVEMBER 2020The data above display the number of providers and/or provider organizations providingtherapeutic consultation behavioral services over the past five fiscal years (note: FY21 data isthrough September 2020). It should be noted that the counts presented may display individualpractitioners that have a solo practice consisting of one behaviorist, as well as larger providergroups that have many behaviorists employed and are providing this waiver service.The graph above displays the number of providers and/or provider organizations by region thatare providing therapeutic consultation behavioral services to individuals in FY21 (note: data arethrough September 2020). When reviewing these data, it should be noted that numerousproviders deliver services across multiple regions of the state, thus a total count of providers inthe histogram above would exceed the total number of providers that are delivering this service.22Developmental Services and Office of Clinical Quality Improvement 3.12.21
PROVIDER DATA SUMMARY NOVEMBER 2020Children’s and Youth ResidentialIn order to enhance the information provided through this report, DBHDS will focus on a specialtopic or area that may be shared once for information and review, or may contribute to ongoinganalysis. This report introduces new information about children and youth residential services.DBDHS will be collecting suggestions from providers participating in the semi-annual webinarsfor future topics to ensure new content is tailored to community interests and needs. Based onthe information provided here, showing the regional breakdown of providers and number ofchildren/youth supported, a limited number of children currently receive congregate residentialservices under the DD waiver in Virginia with none receiving these services in regions 1 or 2currently. DBHDS will collect feedback from providers on how this information can be enhancedin future reports. The data provided in the two tables below are based on approved serviceauthorization lines over the report period from May 1, 2020 thru October 31, 2020. The regiondetermined by service zip code and provider tax identifier for individuals from birth age lessthan 18 as of October 31, 2020.23Developmental Services and Office of Clinical Quality Improvement 3.12.21
PROVIDER DATA SUMMARY NOVEMBER 2020Note: Sub regions have been realigned with the DBHDS Primary Regions24Developmental Services and Office of Clinical Quality Improvement 3.12.21
PROVIDER DATA SUMMARY NOVEMBER 202025Developmental Services and Office of Clinical Quality Improvement 3.12.21
PROVIDER DATA SUMMARY NOVEMBER 202026Developmental Services and Office of Clinical Quality Improvement 3.12.21
PROVIDER DATA SUMMARY NOVEMBER 202027Developmental Services and Office of Clinical Quality Improvement 3.12.21
PROVIDER DATA SUMMARY NOVEMBER 202028Developmental Services and Office of Clinical Quality Improvement 3.12.21
PROVIDER DATA SUMMARY NOVEMBER 202029Developmental Services and Office of Clinical Quality Improvement 3.12.21
PROVIDER DATA SUMMARY NOVEMBER 202030Developmental Services and Office of Clinical Quality Improvement 3.12.21
PROVIDER DATA SUMMARY NOVEMBER 202031Developmental Services and Office of Clinical Quality Improvement 3.12.21
PROVIDER DATA SUMMARY NOVEMBER 202032Developmental Services and Office of Clinical Quality Improvement 3.12.21
PROVIDER DATA SUMMARY NOVEMBER 202033Developmental Services and Office of Clinical Quality Improvement 3.12.21
PROVIDER DATA SUMMARY NOVEMBER 202034Developmental Services and Office of Clinical Quality Improvement 3.12.21
PROVIDER DATA SUMMARY NOVEMBER 202035Developmental Services and Office of Clinical Quality Improvement 3.12.21
PROVIDER DATA SUMMARY NOVEMBER 202036Developmental Services and Office of Clinical Quality Improvement 3.12.21
PROVIDER DATA SUMMARY NOVEMBER 202037Developmental Services and Office of Clinical Quality Improvement 3.12.21
PROVIDER DATA SUMMARY NOVEMBER 202038Developmental Services and Office of Clinical Quality Improvement 3.12.21
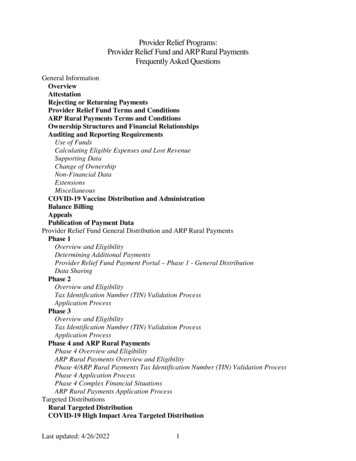
PROVIDER DATA SUMMARY NOVEMBER 2020The overall change in people authorized and provider counts are seen below. Significantdeclines in authorizations are noted in Community Engagement and Community Coaching,decreases that coincide with the extended period of the COVID-19 pandemic. It should benoted that interrupted services have resulted in suspended authorizations, but many individualsmay continue to choose a provider, want services, and be seeking a clear date to return. DBHDSexpects some loss in these services due to the pandemic, but also a readjustment over time asthe pandemic subsides and reauthorizations occur.39Developmental Services and Office of Clinical Quality Improvement 3.12.21
PROVIDER DATA SUMMARY NOVEMBER 2020DBHDS is working to integrate the RST referral process into the Waiver Management System toease communication, tracking and data reporting and is now incorporating RST barrier data inthis Provider Data Summary report. The inclusion of this data relates to the following draftmeasure under negotiation with the Department of Justice:Measure86% of people with a DD waiver, who are identified through indicator #13 of III.D.6 (below),desiring a more integrated residential service option (defined as independent living supports, inhome support services, supported living, and sponsored residential) have access to an optionthat meets their preferences within nine months.III.D.6.13. DBHDS will identify individua
Developmental Services Provider Data Summary Semi-Annual Report State Fiscal Year 2020-2021 May 1, 2020 to October 31, 2020 . PROVIDER DATA SUMMARY NOVEMBER 2020 2 . Settlement Agreement, and it was made available on the Commonwealth of Virginia Learning Center (COVLC) July 1, 2020. This training consists of 3 modules that take approximately 2 ½